. 2021 Jan 16:20:607-624.
doi: 10.1016/j.omto.2021.01.003. eCollection 2021 Mar 26.

The lncRNA DLGAP1-AS1/miR-149-5p/TGFB2 axis contributes to colorectal cancer progression and 5-FU resistance by regulating smad2 pathway

Affiliations

The lncRNA DLGAP1-AS1/miR-149-5p/TGFB2 axis contributes to colorectal cancer progression and 5-FU resistance by regulating smad2 pathway

Linlin Qu et al. Mol Ther Oncolytics. .

Abstract

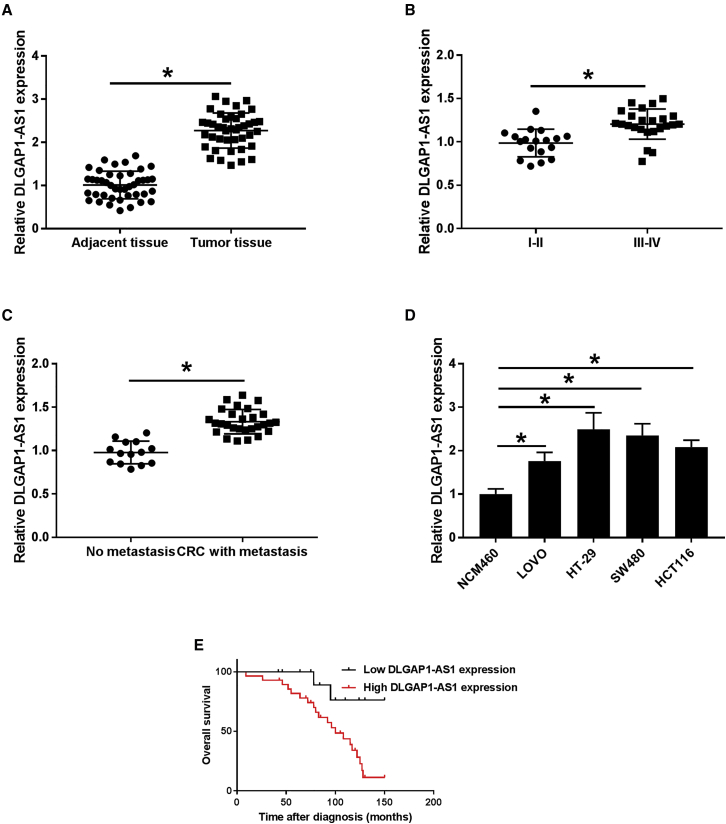
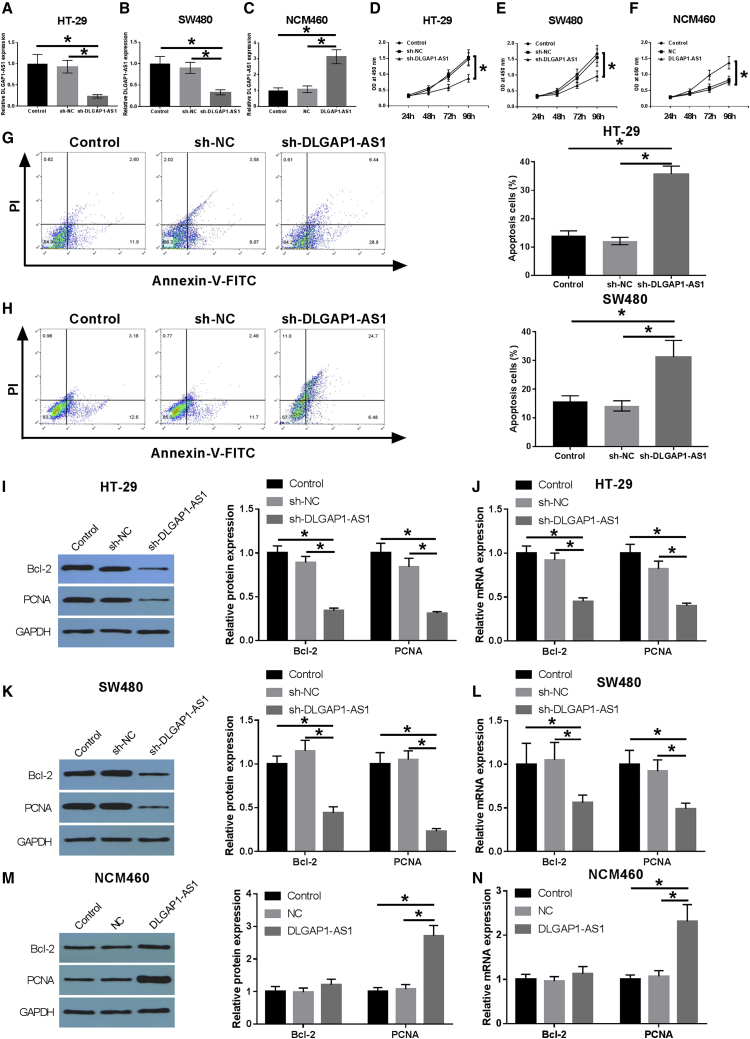
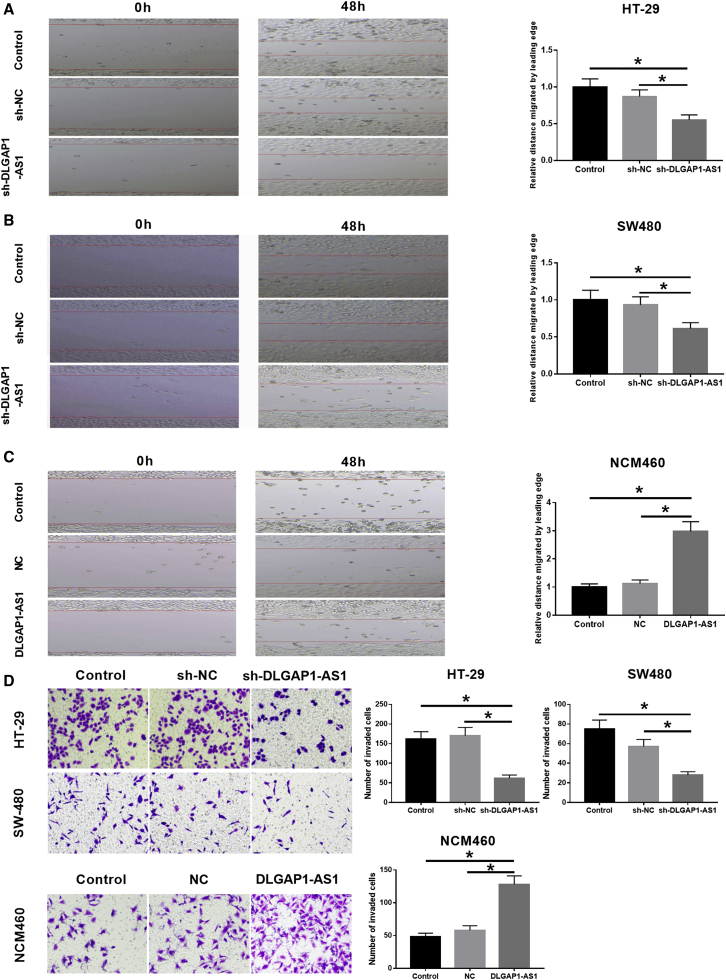
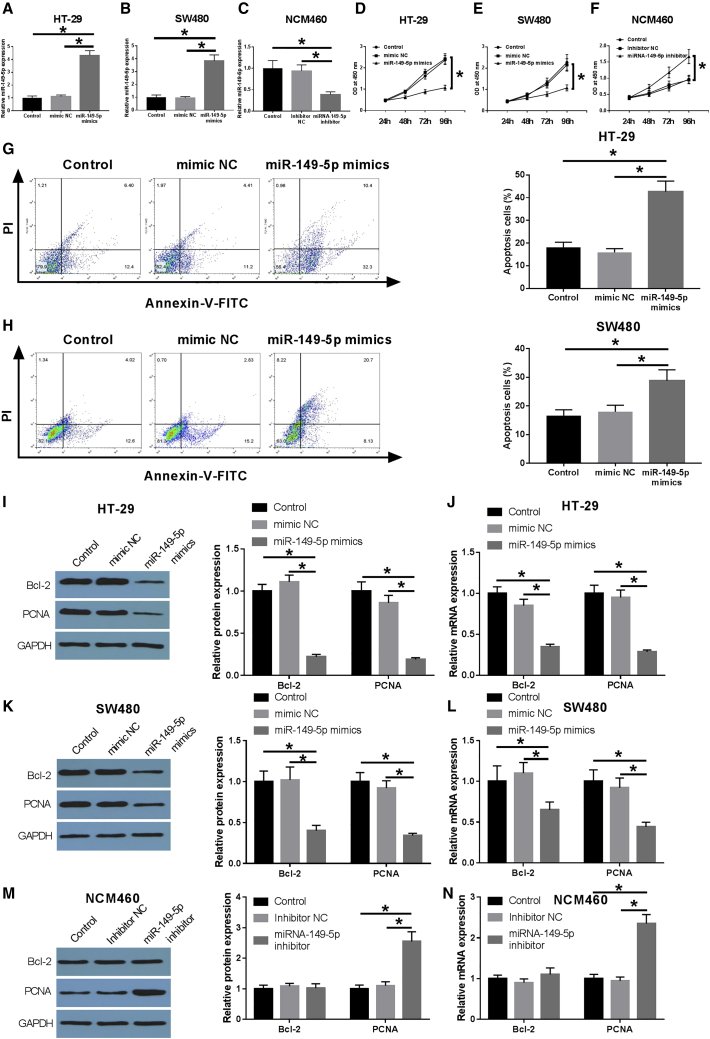
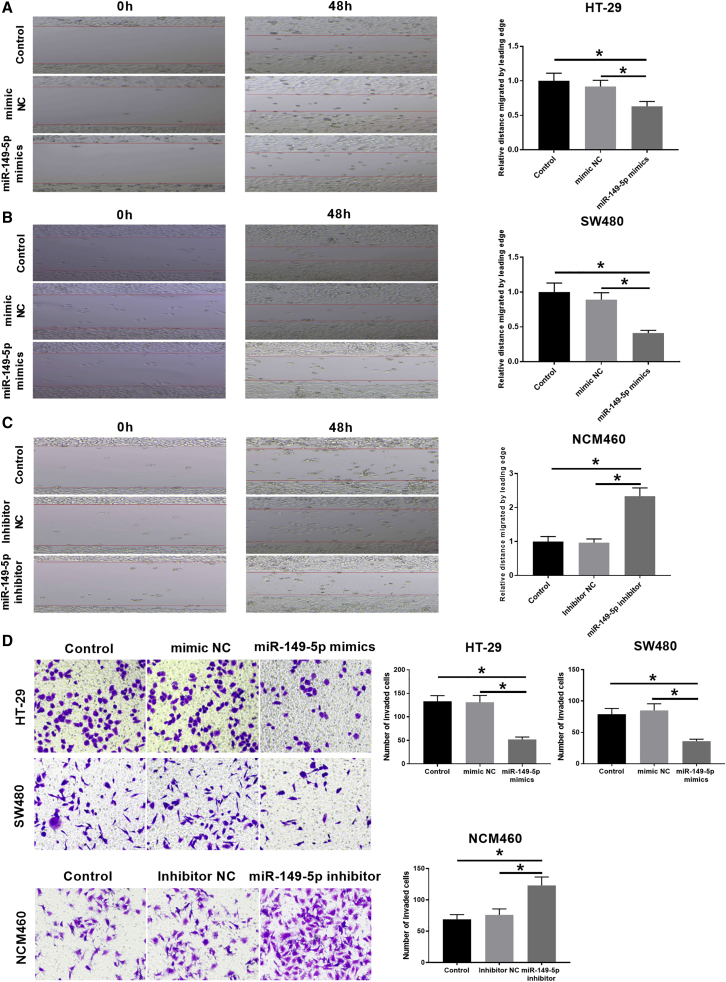
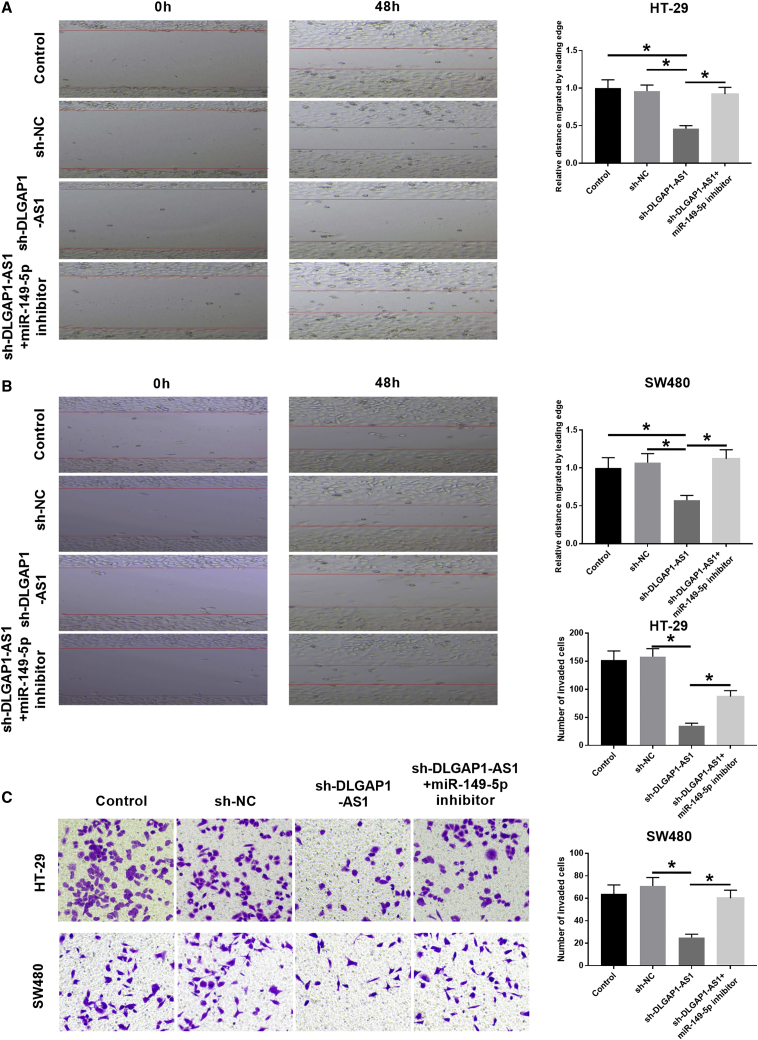
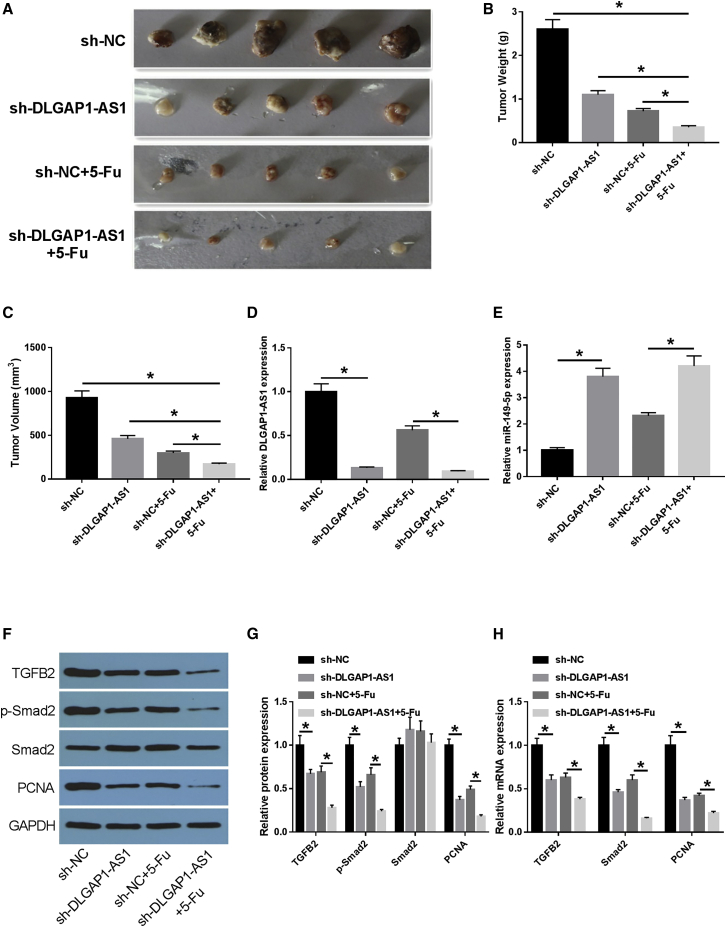
Colorectal carcinoma (CRC) ranks as the third most common malignancy. Long non-coding RNA DLGAP1-AS1 was reported to be dysregulated and to play a pivotal role in hepatocellular carcinoma (HCC). This work aims to analyze the functions and molecular basis of DLGAP1-AS1 in CRC progression and 5-fluorouracil resistance. Cell Counting Kit-8 (CCK-8) assay, Transwell assay, flow cytometry, and western blot were utilized to measure the CRC cell activity, invasiveness, and apoptosis. RNA immunoprecipitation (RIP) and dual-luciferase reporter gene assay were adopted to verify the direct mutual action between DLGAP1-AS1 and miR-149-5p. The effect of DLGAP1-AS1 knockdown on tumor growth and chemosensitivity of 5-fluorouracil (5-FU) were investigated in the mouse CRC xenograft models. Functional assays showed that silencing DLGAP1-AS1 expression remarkably inhibited cell proliferation and aggressiveness ability and enhanced apoptosis rate and cell chemosensitivity to 5-FU. In addition, miR-149-5p was identified as a tumor suppressor and a direct downstream target of DLGAP1-AS1 in CRC. Furthermore, miR-149-5p was confirmed to directly bind to TGFB2 and DLGAP1-AS1 could regulate the expression of TGFB2 signaling pathway via miR-149-5p in CRC. These new findings indicate that DLGAP1-AS1 knockdown inhibited the progression of CRC and enhanced the 5-FU sensitivity of CRC cells through miR-149-5p/TGFB2 regulatory axis, suggesting that DLGAP1-AS1 may be a promising therapeutic target for CRC.

Keywords: DLGAP1-AS1; TGFB2; chemoresistance; colorectal cancer; lncRNA; miR-149-5p.


Conflict of interest statement

The authors declare no competing interests.

Figures

None
Graphical abstract
Figure 1
Figure 1
The expression level of DLGAP1-AS1 was verified in CRC samples and CRC cell lines, and the correlation between DLGAP1-AS1 expression and clinical manifestations and prognosis was analyzed (A) The expression level of DLGAP1-AS1 was detected by qRT-PCR in cancer and adjacent tissues of CRC patients. (B) The expression of DLGAP1-AS1 was detected by qRT-PCR in different tumor stages. (C) The expression level of DLGAP1-AS1 was compared between metastatic and non-metastatic CRC patients. (D) The expression levels of DLGAP1-AS1 in LoVo, HT-29, SW480, HCT116 CRC cell lines, and NCM460 normal colon epithelial cells were detected by qRT-PCR. (E) Kaplan-Meier overall survival (OS) curves were illustrated on the basis of DLGAP1-AS1 level. Data are the means ± SD of triplicate determinants (∗p < 0.05).
Figure 2
Figure 2
DLGAP1-AS1 can promote the proliferation and inhibit apoptosis of HT-29 and SW480 cells (A and B) The HT-29 and SW480 cells were divided into control group, shNC group, and sh-DLGAP1-AS1 group. The expression level of DLGAP1-AS1 mRNA was detected by qRT-PCR. (C) The NCM460 cells were divided into control group, NC group, and DLGAP1-AS1 group. The expression level of DLGAP1-AS1 mRNA was detected by qRT-PCR. (D–F) The CCK-8 method was used to detect the cell viability of HT-29, SW480, and NCM460 cells. (G and H) Apoptosis was detected by flow cytometry in HT-29 and SW480 cells. (I) Expression levels of apoptosis- and proliferation-related indexes (Bcl-2, PCNA) were detected by western blot (WB) in HT-29 cells. (J) qRT-PCR was used to detect the expression level of apoptosis- and proliferation-related indexes (Bcl-2, PCNA) in HT-29 cells. (K) Expression levels of apoptosis- and proliferation-related indexes (Bcl-2, PCNA) were detected by WB in SW480 cells. (L) qRT-PCR was used to detect the expression level of apoptosis- and proliferation-related indexes (Bcl-2, PCNA) in SW480 cells. (M) Expression levels of apoptosis- and proliferation-related indexes (Bcl-2, PCNA) were detected by WB in NCM460 cells. (N) qRT-PCR was used to detect the expression level of apoptosis- and proliferation-related indexes (Bcl-2, PCNA) in NCM460 cells. Data are the means ± SD of triplicate determinants (∗p < 0.05).
Figure 3
Figure 3
DLGAP1-AS1 promotes the migration and invasion of CRC cells (A–C) Scratch healing tests were used to detect the mobility of cells in HT-29, SW480, and NCM460 cells. (D) Matrigel experiments were used to detect cell invasion in HT-29, SW480, and NCM460 cells. Data are the means ± SD of triplicate determinants (∗p < 0.05).
Figure 4
Figure 4
There is a targeted regulation relationship between DLGAP1-AS1 and hsa-miR-149-5p (A) The binding site of hsa-miR-149-5p on DLGAP1-AS1 was predicted by the bioinformatics method. (B and C) The target regulation of DLGAP1-AS1 and hsa-miR-149-5p was confirmed by double luciferase reporter assay in HT-29 and SW480 cells, respectively. (D and E) After interfering with the expression level of DLGAP1-AS1, the expression level of hsa-miR-149-5p was detected by qRT-PCR in HT-29 and SW480 cells, which suggested that DLGAP1-AS1 was negatively correlated with the expression level of hsa-miR-149-5p. (F) qRT-PCR was used to detect the expression of hsa-miR-149-5p in CRC tissues and adjacent tissues. (G) A negative correlation between hsa-miR-149-5p and DLGAP1-AS1 was determined by Spearman’s correlation analysis. (H) The expression levels of hsa-miR-149-5p in LoVo, HT-29, SW480, HCT116 CRC cell lines, and NCM460 normal colon epithelial cells were detected by qRT-PCR. (I–L) The co-precipitated RNA were detected by an RNA immunoprecipitation experiment and qRT-PCR in HT-29 and SW480 cells. DLGAP1-AS1 and hsa-miR-149-5p were presented as fold enrichment in Ago2 relative to IgG immunoprecipitate. Data are the means ± SD of triplicate determinants (∗p < 0.05).
Figure 5
Figure 5
Hsa-miR-149-5p inhibited the proliferation of CRC cells and promoted apoptosis (A and B) The HT-29 and SW480 cells were divided into control group, mimic NC group, and miR-149-5p mimic group. The expression level of miR-149-5p was detected by qRT-PCR. (C) The NCM460 cells were divided into control group, inhibitor NC group, and miR-149-5p inhibitor group. The expression level of miR-149-5p was detected by qRT-PCR. (D–F) The CCK-8 method was used to detect the cell viability of HT-29, SW480, and NCM460 cells. (G and H) Apoptosis was detected by flow cytometry in HT-29 and SW480 cells. (I) Expression levels of apoptosis- and proliferation-related indexes (Bcl-2, PCNA) were detected by WB in HT-29 cells. (J) qRT-PCR was used to detect the expression level of apoptosis- and proliferation-related indexes (Bcl-2, PCNA) in HT-29 cells. (K) Expression levels of apoptosis- and proliferation-related indexes (Bcl-2, PCNA) were detected by WB in SW480 cells. (L) qRT-PCR was used to detect the expression level of apoptosis- and proliferation-related indexes (Bcl-2, PCNA) in SW480 cells. (M) Expression levels of apoptosis- and proliferation-related indexes (Bcl-2, PCNA) were detected by WB in NCM460 cells. (N) qRT-PCR was used to detect the expression levels of apoptosis- and proliferation-related indexes (Bcl-2, PCNA) in NCM460 cells. Data are the means ± SD of triplicate determinants (∗p < 0.05).
Figure 6
Figure 6
Hsa-miR-149-5p inhibited the migration and invasion of CRC cells (A–C) Scratch healing tests were used to detect the mobility of cells in HT-29, SW480, and NCM460 cells. (D) Matrigel experiments were used to detect cell invasion in HT-29, SW480, and NCM460 cells. Data are the means ± SD of triplicate determinants (∗p < 0.05).
Figure 7
Figure 7
There is a targeted regulation relationship between TGFB2 and hsa-miR-149-5p (A) The binding site of hsa-miR-149-5p on TGFB2 was predicted by the bioinformatics method. (B and C) The binding relationship of TGFB2 and hsa-miR-149-5p was confirmed by double luciferase reporter assay in HT-29 and SW480 cells, respectively. (D–I) After increasing or inhibiting the expression level of hsa-miR-149-5p, the expression levels of TGFB2 were detected by WB and qRT-PCR in HT-29, SW480, and NCM460 cells, respectively. (J) qRT-PCR was used to detect the expression of TGFB2 in CRC and adjacent tissues. (K) The expression levels of TGFB2 in LoVo, HT-29, SW480, HCT116 CRC cell lines, and NCM460 normal colon epithelial cells were detected by qRT-PCR. (L) A negative correlation between hsa-miR-149-5p and TGFB2 was determined by Spearman’s correlation analysis. (M–P) The co-precipitated RNA were detected by RNA immunoprecipitation experiment and qRT-PCR in HT-29 and SW480 cells. TGFB2 and hsa-miR-149-5p were presented as fold enrichment in Ago2 relative to IgG immunoprecipitate. Data are the means ± SD of triplicate determinants (∗p < 0.05).
Figure 8
Figure 8
DLGAP1-AS1 directly bound hsa-miR-149-5p and further affects the proliferation and apoptosis of CRC cells by regulating the TGFB2 signaling pathway (A and B) CRC cells were divided into four groups: control, shRNA NC, sh-DLGAP1-AS1, and sh-DLGAP1-AS1+hsa-miR-149-5p inhibitor. The mRNA expression level of DLGAP1-AS1 was detected by qRT-PCR in HT-29 and SW480 cells. (C and D) CCK-8 assay was used to detect the cell viability of HT-29 and SW480 cells, respectively. (E and F) Flow cytometry was adopted to detect the level of apoptosis in HT-29 and SW480 cells. (G and H) The expression level of TGFB2 and its downstream signal pathway molecules p-Smad2, Smad2, and proliferation-related index (PCNA) was detected by WB. (I) The expression level of TGFB2 and its downstream signal pathway molecules p-Smad2, Smad2, and proliferation-related index (PCNA) was detected by qRT-PCR. Data are the means ± SD of triplicate determinants (∗p < 0.05).
Figure 9
Figure 9
DLGAP1-AS1 directly bound hsa-miR-149-5p and further affects the migration and invasion of CRC cells by regulating the TGFB2 signaling pathway (A and B) Scratch healing test was used to detect the movement ability of HT-29 and SW480 cells. (C) Matrigel experiments were used to detect cell invasion in HT-29 and SW480 cells. Data are the means ± SD of triplicate determinants (∗p < 0.05).
Figure 10
Figure 10
DLGAP1-AS1 contributed to the chemosensitivity of 5-FU in HT-29 cells (A) The expression levels of DLGAP1-AS1, hsa-miR-149-5p, and TGFB2 in HT-29 and 5-FU-resistant HT-29 (HT-29/5FU) cells were detected by qRT-PCR. HT-29 cells were treated with 5-FU after DLGAP1-AS1 knockdown and/or miR-149-5p inhibition. (B) The expression level of DLGAP1-AS1 was detected by qRT-PCR. (C) The cell viability of each group was detected by CCK-8. (D and E) Apoptosis was detected by flow cytometry. (F and G) The expression level of TGFB2 was detected by WB. (H) The expression level of TGFB2 was detected by qRT-PCR. Data are the means ± SD of triplicate determinants (∗p < 0.05).
Figure 11
Figure 11
DLGAP1-AS1 can inhibit the growth of xenograft tumor model of CRC in nude mice and promote the sensitivity of tumor tissue to 5-FU (A) The subcutaneous transplanted tumor (drug-resistant cell line) model of CRC in nude mice was established. At 21 days upon cell implantation, tumors were excised and imaged. (B) Tumor weight of xenografts. (C) Tumor volume of xenografts. (D) The expression level of DLGAP1-AS1 was detected by qRT-PCR. (E) The expression of hsa-miR-149-5p was detected by qRT-PCR. (F and G) The expression levels of TGFB2 and its downstream signal pathway molecules p-Smad2, Smad2, and proliferation-related index (PCNA) were detected by WB. (H) The expression levels of TGFB2 and its downstream signal pathway molecule Smad2 and proliferation-related index (PCNA) were detected by qRT-PCR. Data are the means ± SD of triplicate determinants (∗p < 0.05).

References

    1. Siegel R.L., Miller K.D., Jemal A. Cancer statistics, 2018. CA Cancer J. Clin. 2018;68:7–30. - PubMed
    1. Bray F., Ferlay J., Soerjomataram I., Siegel R.L., Torre L.A., Jemal A. Global cancer statistics 2018: GLOBOCAN estimates of incidence and mortality worldwide for 36 cancers in 185 countries. CA Cancer J. Clin. 2018;68:394–424. - PubMed
    1. Zhong X., Fang Y.J., Pan Z.Z., Lu M.S., Zheng M.C., Chen Y.M., Zhang C.X. Dietary fiber and fiber fraction intakes and colorectal cancer risk in Chinese adults. Nutr. Cancer. 2014;66:351–361. - PubMed
    1. Torre L.A., Siegel R.L., Ward E.M., Jemal A. Global Cancer Incidence and Mortality Rates and Trends--An Update. Cancer Epidemiol. Biomarkers Prev. 2016;25:16–27. - PubMed
    1. Sun L., Jiang C., Xu C., Xue H., Zhou H., Gu L., Liu Y., Xu Q. Down-regulation of long non-coding RNA RP11-708H21.4 is associated with poor prognosis for colorectal cancer and promotes tumorigenesis through regulating AKT/mTOR pathway. Oncotarget. 2017;8:27929–27942. - PMC - PubMed

LinkOut - more resources