

HACSim: an R package to estimate intraspecific sample sizes for genetic diversity assessment using haplotype accumulation curves
- PMID: 33816897
- PMCID: PMC7924493
- DOI: 10.7717/peerj-cs.243
HACSim: an R package to estimate intraspecific sample sizes for genetic diversity assessment using haplotype accumulation curves
Abstract
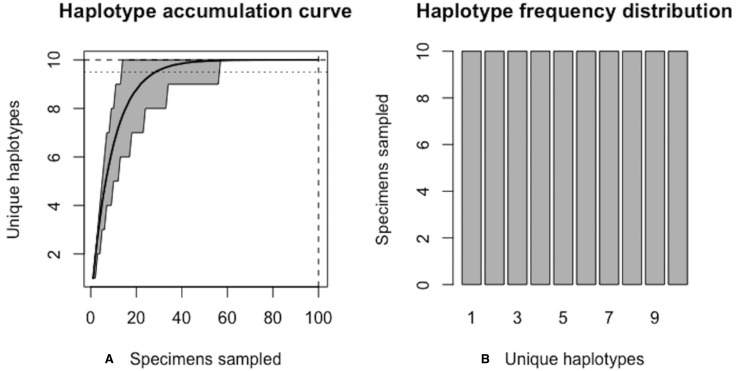
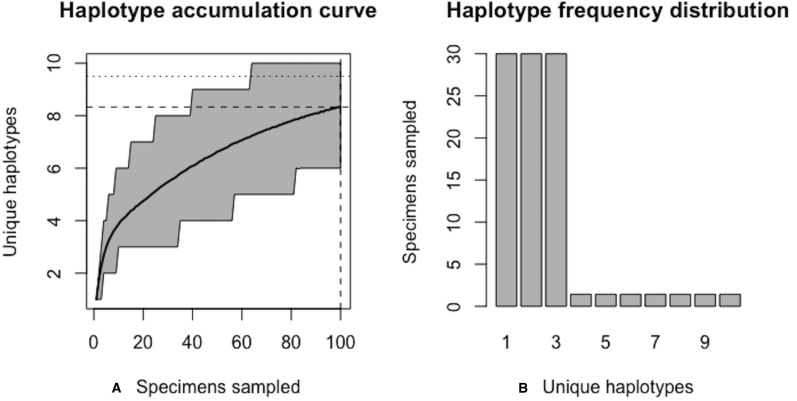
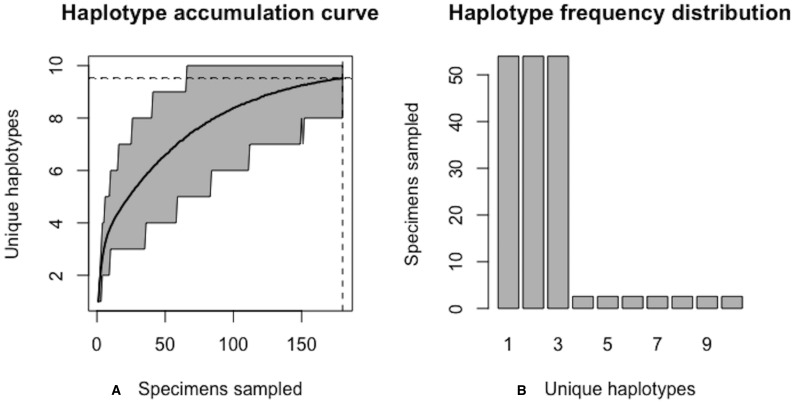
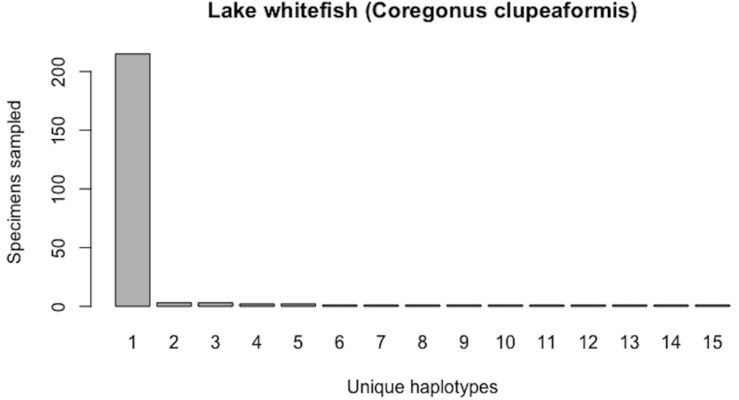
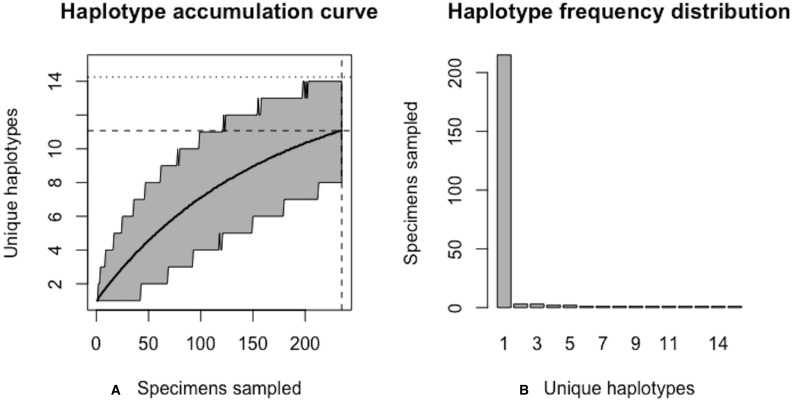
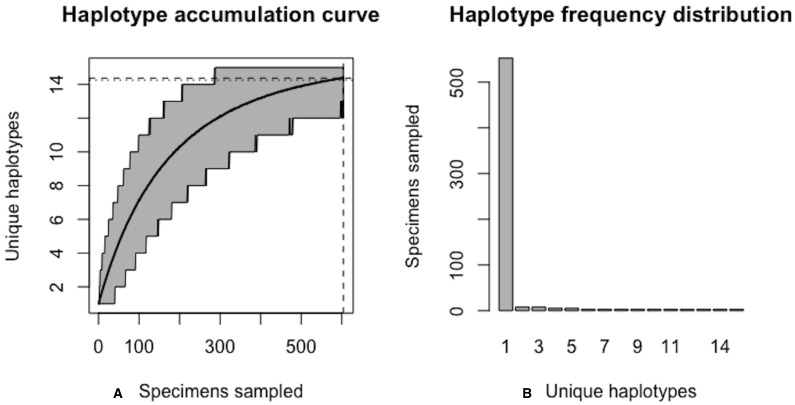
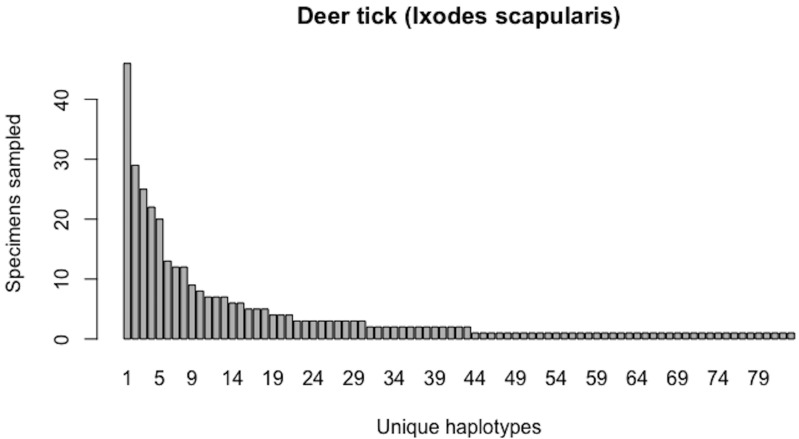
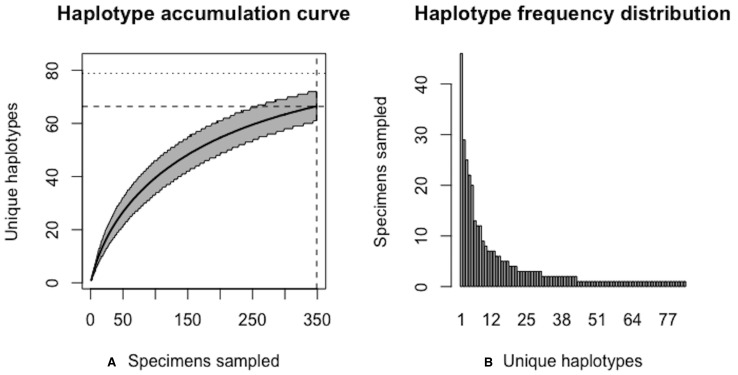
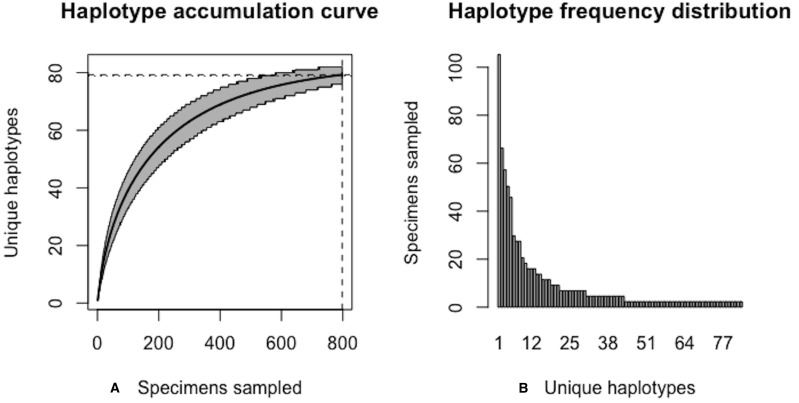
Assessing levels of standing genetic variation within species requires a robust sampling for the purpose of accurate specimen identification using molecular techniques such as DNA barcoding; however, statistical estimators for what constitutes a robust sample are currently lacking. Moreover, such estimates are needed because most species are currently represented by only one or a few sequences in existing databases, which can safely be assumed to be undersampled. Unfortunately, sample sizes of 5-10 specimens per species typically seen in DNA barcoding studies are often insufficient to adequately capture within-species genetic diversity. Here, we introduce a novel iterative extrapolation simulation algorithm of haplotype accumulation curves, called HACSim (Haplotype Accumulation Curve Simulator) that can be employed to calculate likely sample sizes needed to observe the full range of DNA barcode haplotype variation that exists for a species. Using uniform haplotype and non-uniform haplotype frequency distributions, the notion of sampling sufficiency (the sample size at which sampling accuracy is maximized and above which no new sampling information is likely to be gained) can be gleaned. HACSim can be employed in two primary ways to estimate specimen sample sizes: (1) to simulate haplotype sampling in hypothetical species, and (2) to simulate haplotype sampling in real species mined from public reference sequence databases like the Barcode of Life Data Systems (BOLD) or GenBank for any genomic marker of interest. While our algorithm is globally convergent, runtime is heavily dependent on initial sample sizes and skewness of the corresponding haplotype frequency distribution.
Keywords: Algorithm; DNA barcoding; Extrapolation; Iterative method; Sampling sufficiency; Species.
©2020 Phillips et al.
Conflict of interest statement
The authors declare there are no competing interests.
Figures
Similar articles
-
Incomplete estimates of genetic diversity within species: Implications for DNA barcoding.Ecol Evol. 2019 Feb 16;9(5):2996-3010. doi: 10.1002/ece3.4757. eCollection 2019 Mar. Ecol Evol. 2019. PMID: 30891232 Free PMC article. Review.
-
The impact of genetic diversity on the accuracy of DNA barcoding to identify species: A study on the genus Phellodendron.Ecol Evol. 2019 Aug 20;9(18):10723-10733. doi: 10.1002/ece3.5590. eCollection 2019 Sep. Ecol Evol. 2019. PMID: 31624576 Free PMC article.
-
A simulation study of sample size for DNA barcoding.Ecol Evol. 2015 Dec 1;5(24):5869-79. doi: 10.1002/ece3.1846. eCollection 2015 Dec. Ecol Evol. 2015. PMID: 26811761 Free PMC article.
-
DNA barcoding allows identification of European Fanniidae (Diptera) of forensic interest.Forensic Sci Int. 2017 Sep;278:106-114. doi: 10.1016/j.forsciint.2017.06.023. Epub 2017 Jun 29. Forensic Sci Int. 2017. PMID: 28734268
-
DNA barcode reference libraries for the monitoring of aquatic biota in Europe: Gap-analysis and recommendations for future work.Sci Total Environ. 2019 Aug 15;678:499-524. doi: 10.1016/j.scitotenv.2019.04.247. Epub 2019 Apr 27. Sci Total Environ. 2019. PMID: 31077928 Review.
Cited by
-
A DNA barcode-based survey of wild urban bees in the Loire Valley, France.Sci Rep. 2021 Feb 26;11(1):4770. doi: 10.1038/s41598-021-83631-0. Sci Rep. 2021. PMID: 33637824 Free PMC article.
-
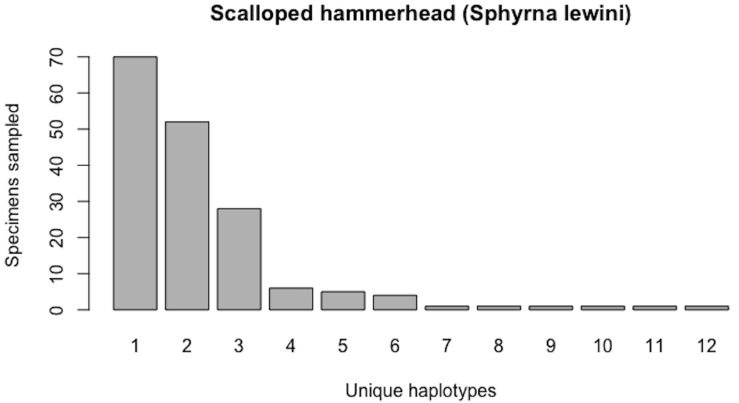
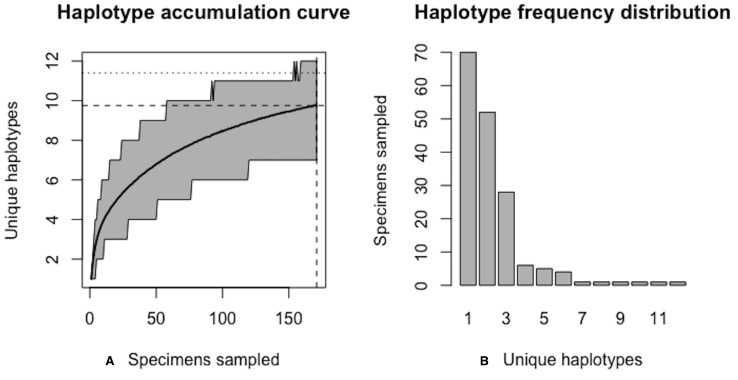
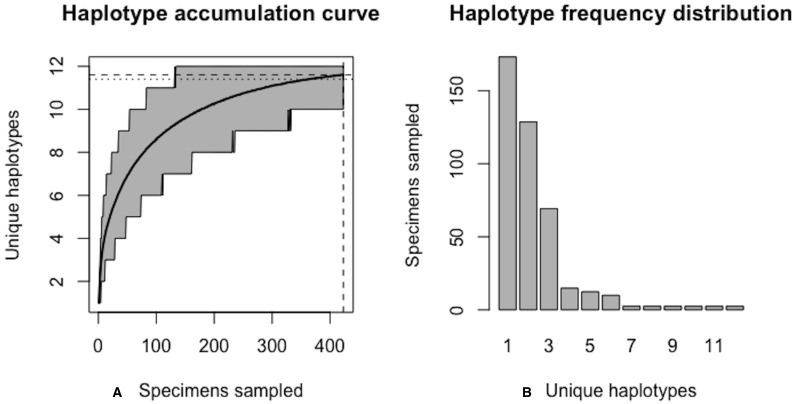
Genetic population dynamics of the critically endangered scalloped hammerhead shark (Sphyrna lewini) in the Eastern Tropical Pacific.Ecol Evol. 2022 Dec 28;12(12):e9642. doi: 10.1002/ece3.9642. eCollection 2022 Dec. Ecol Evol. 2022. PMID: 36619714 Free PMC article.
-
Application of deep autoencoder as an one-class classifier for unsupervised network intrusion detection: a comparative evaluation.PeerJ Comput Sci. 2020 Dec 7;6:e327. doi: 10.7717/peerj-cs.327. eCollection 2020. PeerJ Comput Sci. 2020. PMID: 33816977 Free PMC article.
-
Opportunities and challenges of macrogenetic studies.Nat Rev Genet. 2021 Dec;22(12):791-807. doi: 10.1038/s41576-021-00394-0. Epub 2021 Aug 18. Nat Rev Genet. 2021. PMID: 34408318 Review.
-
VLF: An R package for the analysis of very low frequency variants in DNA sequences.Biodivers Data J. 2023 Jan 26;11:e96480. doi: 10.3897/BDJ.11.e96480. eCollection 2023. Biodivers Data J. 2023. PMID: 38327328 Free PMC article.
References
Associated data
LinkOut - more resources
Full Text Sources