. 2020 Nov 30:6:e307.
doi: 10.7717/peerj-cs.307. eCollection 2020.

A machine learning framework for the prediction of chromatin folding in Drosophila using epigenetic features

Affiliations

A machine learning framework for the prediction of chromatin folding in Drosophila using epigenetic features

Michal B Rozenwald et al. PeerJ Comput Sci. .

Abstract

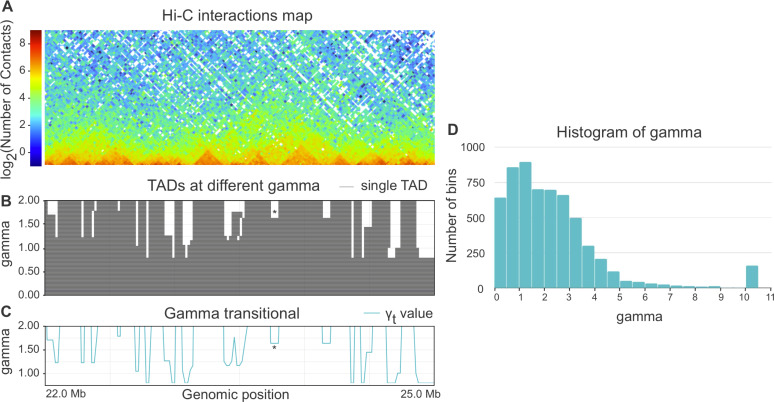
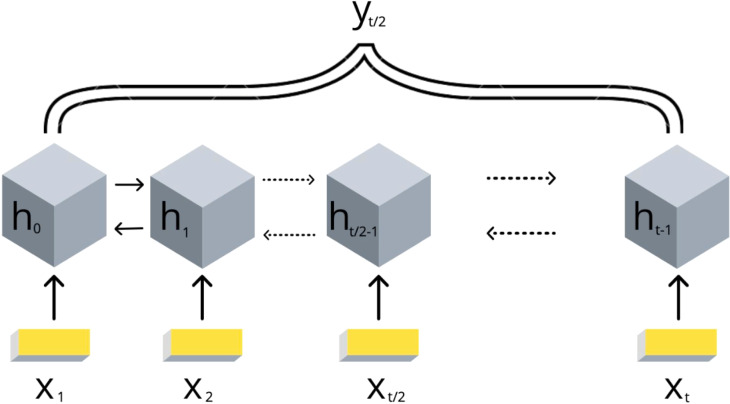
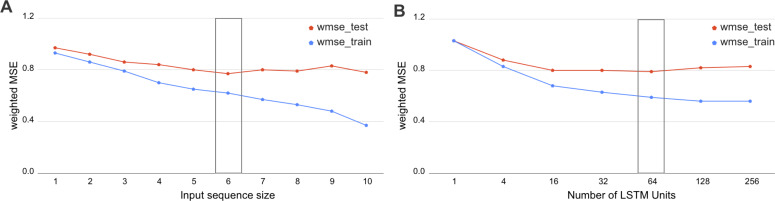
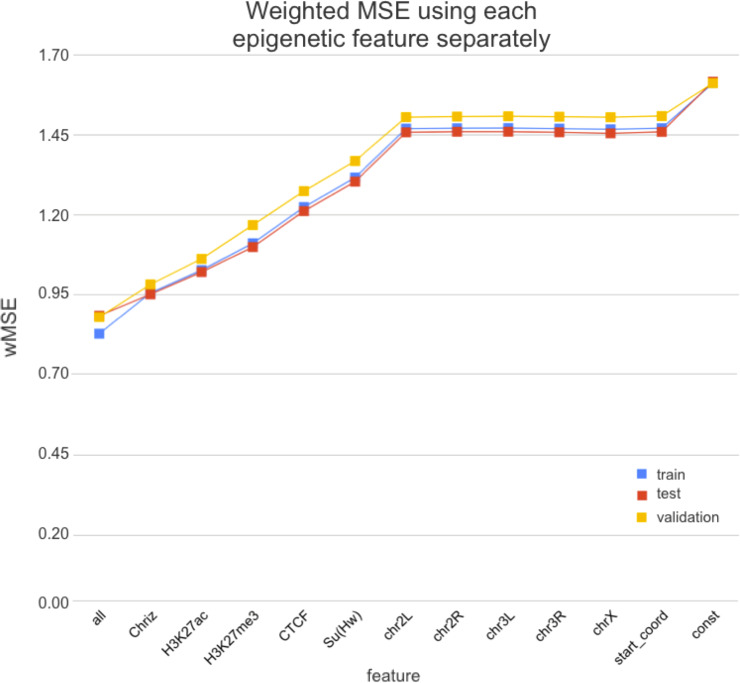
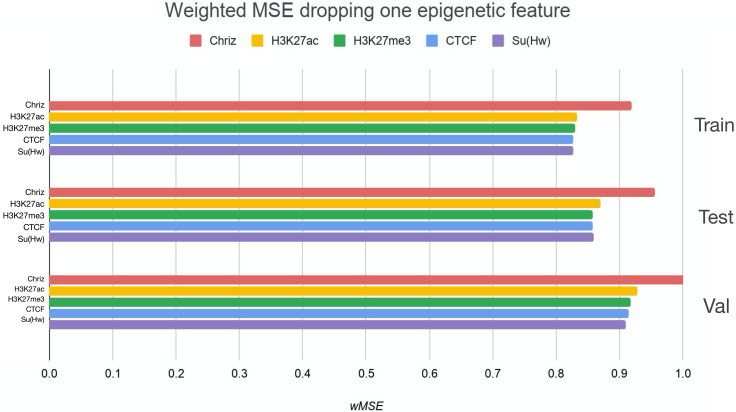
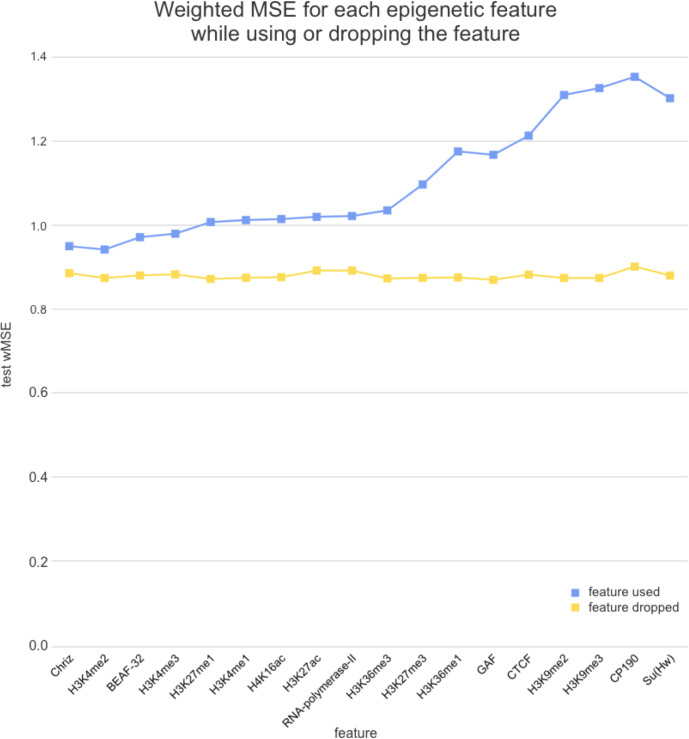
Technological advances have lead to the creation of large epigenetic datasets, including information about DNA binding proteins and DNA spatial structure. Hi-C experiments have revealed that chromosomes are subdivided into sets of self-interacting domains called Topologically Associating Domains (TADs). TADs are involved in the regulation of gene expression activity, but the mechanisms of their formation are not yet fully understood. Here, we focus on machine learning methods to characterize DNA folding patterns in Drosophila based on chromatin marks across three cell lines. We present linear regression models with four types of regularization, gradient boosting, and recurrent neural networks (RNN) as tools to study chromatin folding characteristics associated with TADs given epigenetic chromatin immunoprecipitation data. The bidirectional long short-term memory RNN architecture produced the best prediction scores and identified biologically relevant features. Distribution of protein Chriz (Chromator) and histone modification H3K4me3 were selected as the most informative features for the prediction of TADs characteristics. This approach may be adapted to any similar biological dataset of chromatin features across various cell lines and species. The code for the implemented pipeline, Hi-ChiP-ML, is publicly available: https://github.com/MichalRozenwald/Hi-ChIP-ML.

Keywords: Chromatin; DNA folding patterns; Gradient Boosting; Hi-C experiments; Linear Regression; Machine Learning; Recurrent Neural Networks (RNN); Topologically Associating Domains (TADs).


Conflict of interest statement

Mikhail Gelfand is an Academic Editor for PeerJ. Grigory V. Sapunov is employed by Intento, Inc.

Figures

Figure 1
Figure 1. (A–C) Example of annotation of chromosome 3R region by transitional gamma. For a given Hi-C matrix of Schneider-2 cells (A), TAD segmentations (B) are calculated by Armatus for a set of gamma values (from 0 to 10, a step of 0.01). Each line in B represents a single TAD. Then gamma transitional (C) is calculated for each genomic region as the minimal value of gamma where the region becomes inter-TAD or TAD boundary. The blue line in C represents the transitional gamma value for each genomic bin. The plots (B) and (C) are limited by gamma 2 for better visualization, although they are continued to the value of 10. Asterisk (*) denotes the region with gamma transitional of 1.64, the minimal value of gamma, where the corresponding region transitions from TAD to inter-TAD. (D) The histogram of the target value transitional gamma for Schneider-2 cell line. Note the peak at 10.
Figure 2
Figure 2. Scheme of the implemented bidirectional LSTM recurrent neural networks with one output.
The values of {x1, .., xt} are the DNA bins with input window size t, {h1, .., ht} are the hidden states of the RNN model, yt∕2 represents the corresponding target value transitional gamma of the middle bin xt∕2. Note that each bin xi is characterized by a vector of chromatin marks ChIP-chip data.
Figure 3
Figure 3. Selection of the biLSTM parameters.
Weighted MSE scores for the train and test datasets are presented. (A) Results of RNN with 64 units for different sizes of sequence length. The sequence size corresponds to the input window size of the RNN or number of bins used together as an input sequence for the neural network. (B) Results of RNN with an input sequence of six bins for the different number of LSTM units. The box highlights the best scores. The biLSTM with six input bins and 64 LSTM units was used throughout this study if not specified otherwise.
Figure 4
Figure 4. Weighted MSE using one feature for each input bin in the biLSTM RNN.
The first mark (‘all’) corresponds to scores of NNs using the first dataset of chromatin marks features together, the last mark (‘const’) represents wMSE using constant prediction. Note that the lower the wMSE value the better the quality of prediction.
Figure 5
Figure 5. Weighted MSE using four out of five chromatin marks features together as the biLSTM RNN input.
Each colour corresponds to the feature that was excluded from the input. Note that the model is affected the most when Chriz factor is dropped from features.
Figure 6
Figure 6. Weighted MSE on the test dataset while using each chromatin mark either as a single feature (blue line) or excluding it from the biLSTM RNN input (yellow line).

References

    1. Barski A, Cuddapah S, Cui K, Roh T-Y, Schones DE, Wang Z, Wei G, Chepelev I, Zhao K. High-resolution profiling of histone methylations in the human genome. Cell. 2007;129(4):823–837. doi: 10.1016/j.cell.2007.05.009. - DOI - PubMed
    1. Belokopytova PS, Nuriddinov MA, Mozheiko EA, Fishman D, Fishman V. Quantitative prediction of enhancer–promoter interactions. Genome Research. 2020;30(1):72–84. doi: 10.1101/gr.249367.119. - DOI - PMC - PubMed
    1. Bkhetan ZA, Plewczynski D. Three-dimensional epigenome statistical model: genome-wide chromatin looping prediction. Scientific Reports. 2018;8:5217. doi: 10.1038/s41598-018-23276-8. - DOI - PMC - PubMed
    1. Chathoth KT, Zabet NR. Chromatin architecture reorganization during neuronal cell differentiation in Drosophila genome. Genome Research. 2019;29(4):613–625. doi: 10.1101/gr.246710.118. - DOI - PMC - PubMed
    1. Chepelev I, Wei G, Wangsa D, Tang Q, Zhao K. Characterization of genome-wide enhancer-promoter interactions reveals co-expression of interacting genes and modes of higher order chromatin organization. Cell Research. 2012;22(3):490–503. doi: 10.1038/cr.2012.15. - DOI - PMC - PubMed