

Early survey with bibliometric analysis on machine learning approaches in controlling COVID-19 outbreaks
- PMID: 33816964
- PMCID: PMC7924648
- DOI: 10.7717/peerj-cs.313
Early survey with bibliometric analysis on machine learning approaches in controlling COVID-19 outbreaks
Abstract
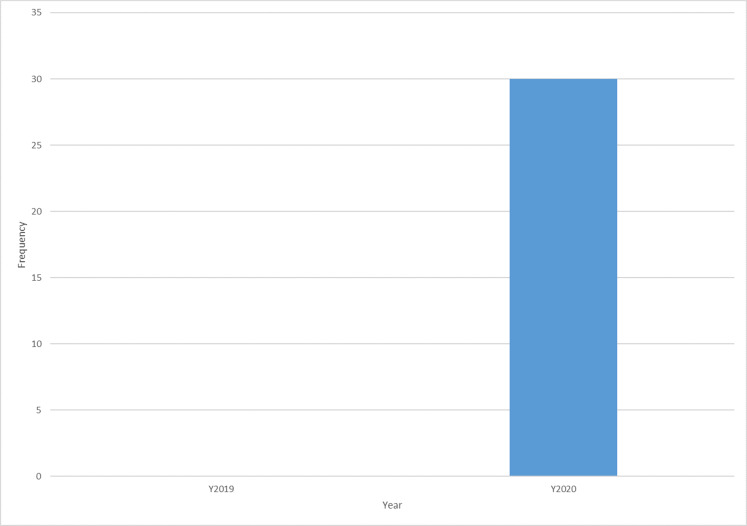
Background and objective: The COVID-19 pandemic has caused severe mortality across the globe, with the USA as the current epicenter of the COVID-19 epidemic even though the initial outbreak was in Wuhan, China. Many studies successfully applied machine learning to fight COVID-19 pandemic from a different perspective. To the best of the authors' knowledge, no comprehensive survey with bibliometric analysis has been conducted yet on the adoption of machine learning to fight COVID-19. Therefore, the main goal of this study is to bridge this gap by carrying out an in-depth survey with bibliometric analysis on the adoption of machine learning-based technologies to fight COVID-19 pandemic from a different perspective, including an extensive systematic literature review and bibliometric analysis.
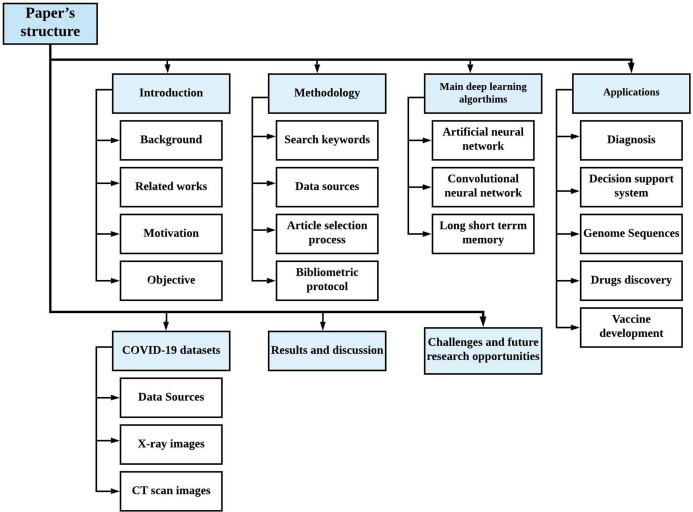
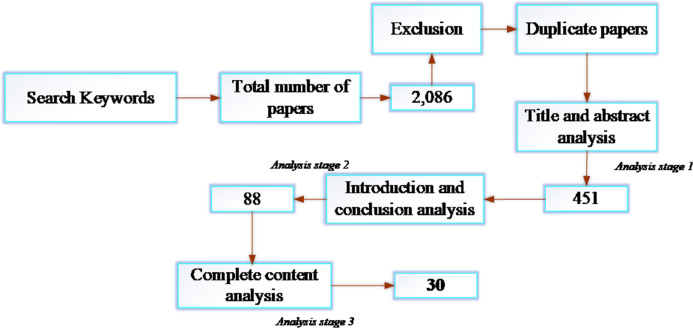
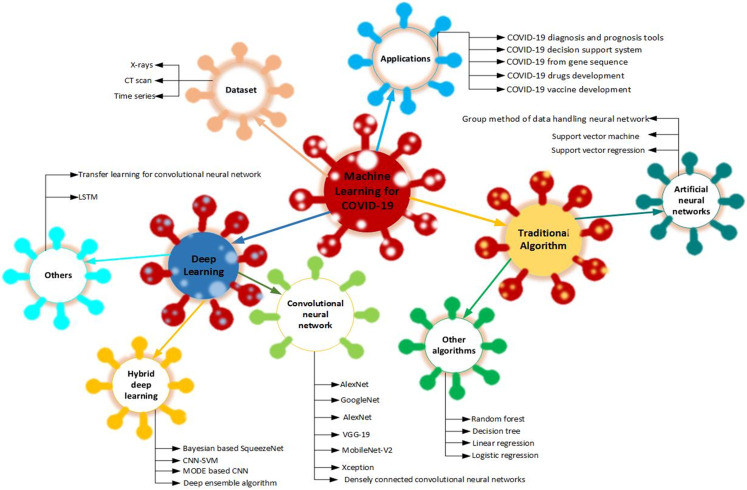
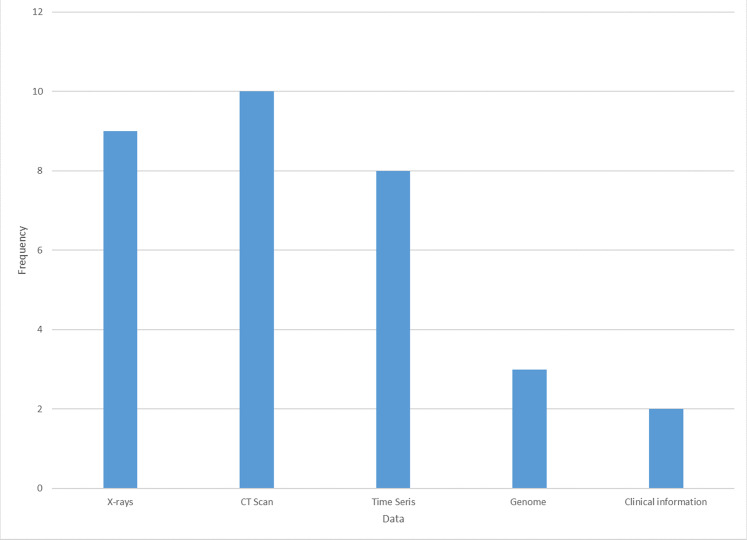
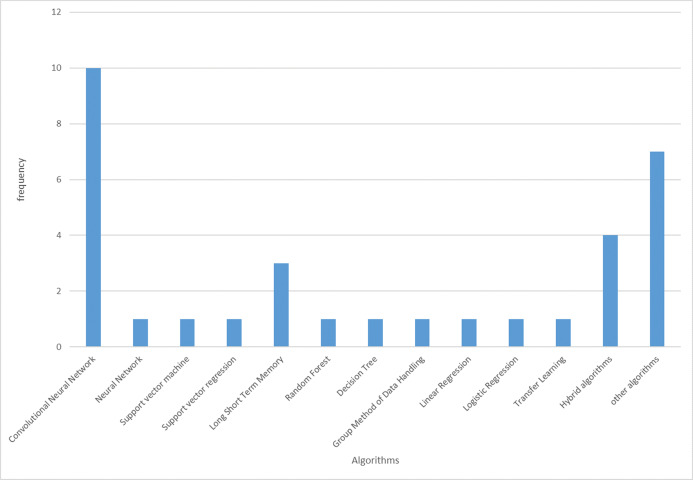
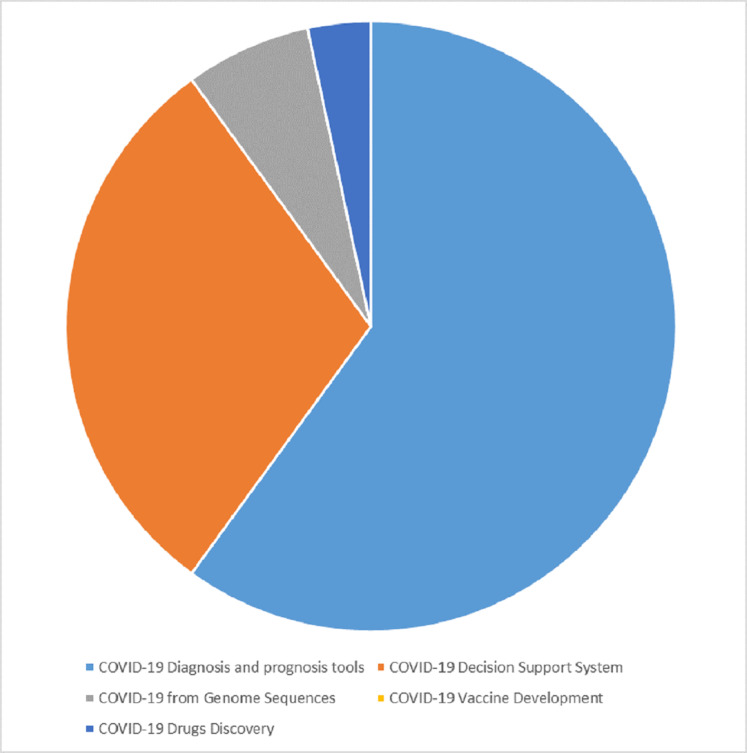
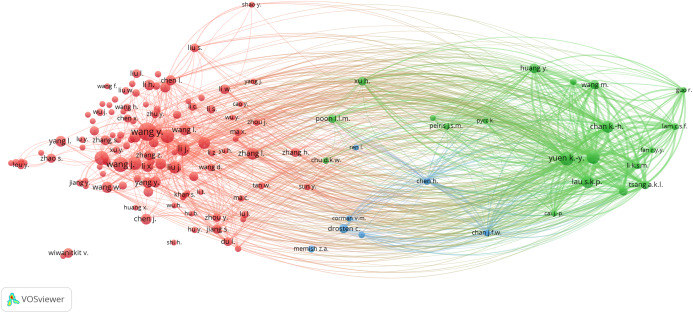
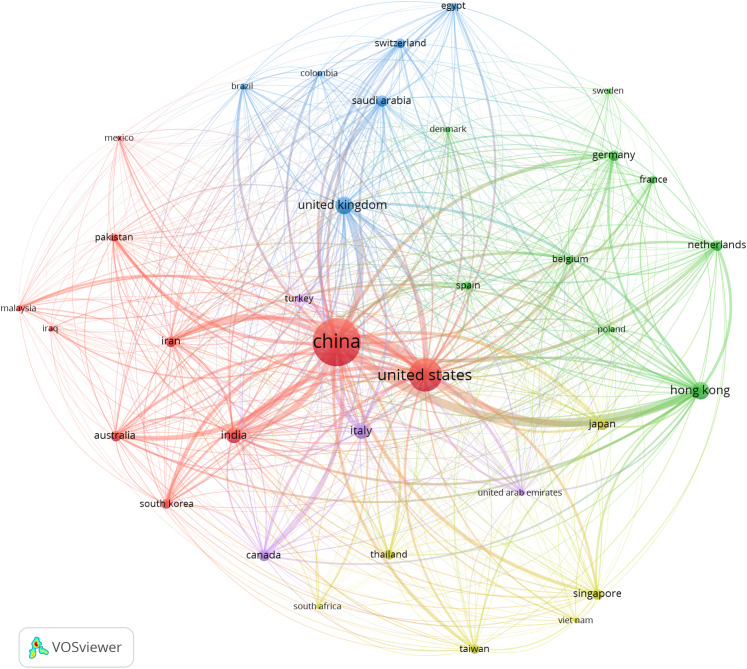
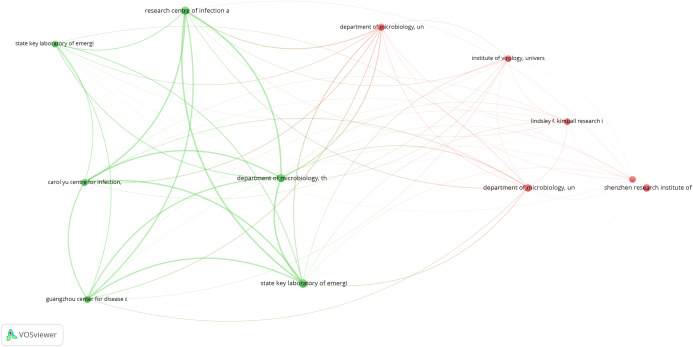
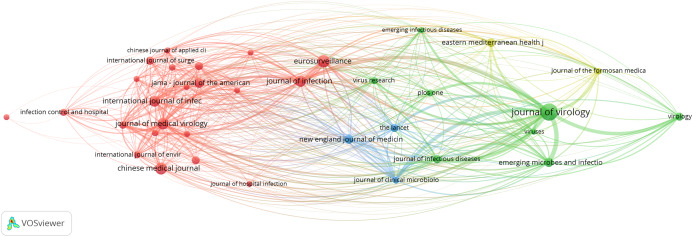
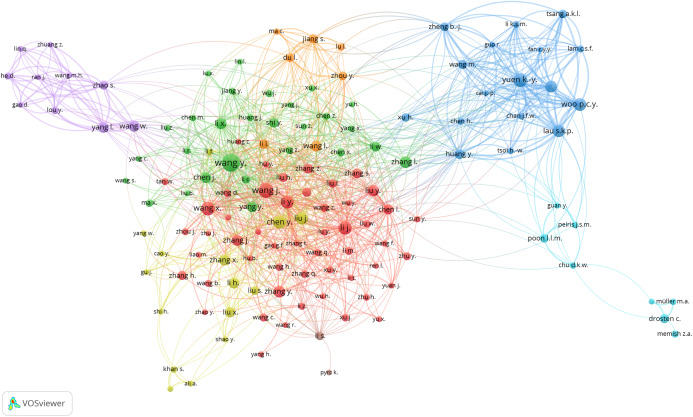
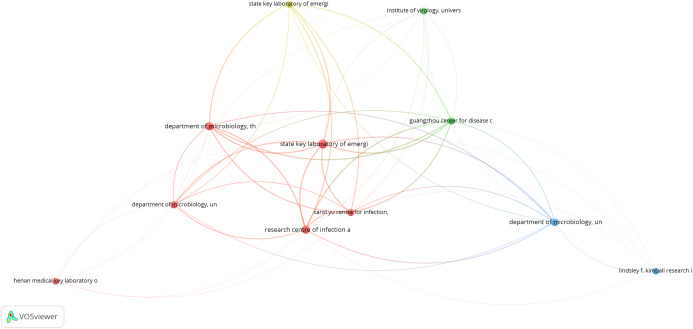
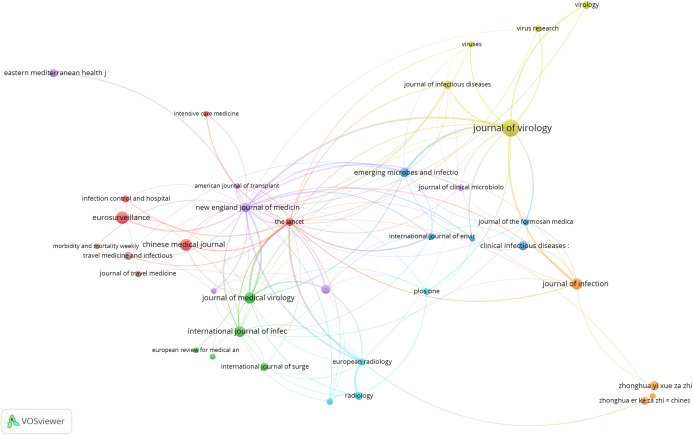
Methods: We applied a literature survey methodology to retrieved data from academic databases and subsequently employed a bibliometric technique to analyze the accessed records. Besides, the concise summary, sources of COVID-19 datasets, taxonomy, synthesis and analysis are presented in this study. It was found that the Convolutional Neural Network (CNN) is mainly utilized in developing COVID-19 diagnosis and prognosis tools, mostly from chest X-ray and chest CT scan images. Similarly, in this study, we performed a bibliometric analysis of machine learning-based COVID-19 related publications in the Scopus and Web of Science citation indexes. Finally, we propose a new perspective for solving the challenges identified as direction for future research. We believe the survey with bibliometric analysis can help researchers easily detect areas that require further development and identify potential collaborators.
Results: The findings of the analysis presented in this article reveal that machine learning-based COVID-19 diagnose tools received the most considerable attention from researchers. Specifically, the analyses of results show that energy and resources are more dispenses towards COVID-19 automated diagnose tools while COVID-19 drugs and vaccine development remains grossly underexploited. Besides, the machine learning-based algorithm that is predominantly utilized by researchers in developing the diagnostic tool is CNN mainly from X-rays and CT scan images.
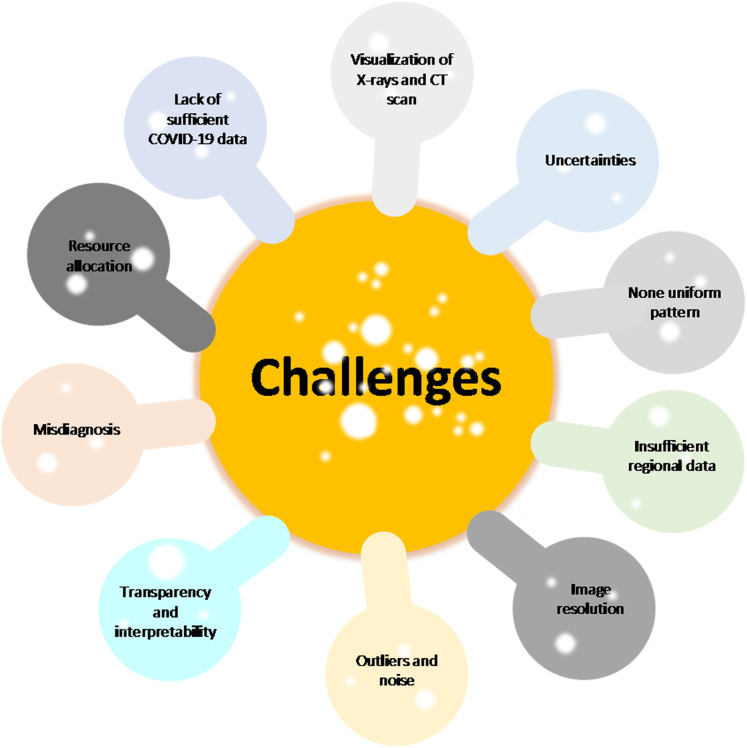
Conclusions: The challenges hindering practical work on the application of machine learning-based technologies to fight COVID-19 and new perspective to solve the identified problems are presented in this article. Furthermore, we believed that the presented survey with bibliometric analysis could make it easier for researchers to identify areas that need further development and possibly identify potential collaborators at author, country and institutional level, with the overall aim of furthering research in the focused area of machine learning application to disease control.
Keywords: Bibliometric analysis; COVID-19 diagnosis tool; COVID-19 pandemic; Convolutional neural network; Machine learning.
© 2020 Chiroma et al.
Conflict of interest statement
The authors declare that they have no competing interests.
Figures
Similar articles
-
A Comprehensive Overview of the COVID-19 Literature: Machine Learning-Based Bibliometric Analysis.J Med Internet Res. 2021 Mar 8;23(3):e23703. doi: 10.2196/23703. J Med Internet Res. 2021. PMID: 33600346 Free PMC article. Review.
-
Machine-Learning-Based Disease Diagnosis: A Comprehensive Review.Healthcare (Basel). 2022 Mar 15;10(3):541. doi: 10.3390/healthcare10030541. Healthcare (Basel). 2022. PMID: 35327018 Free PMC article. Review.
-
Brain Disorder Detection and Diagnosis using Machine Learning and Deep Learning - A Bibliometric Analysis.Curr Neuropharmacol. 2024;22(13):2191-2216. doi: 10.2174/1570159X22999240531160344. Curr Neuropharmacol. 2024. PMID: 38847379 Free PMC article. Review.
-
Machine Learning Research Trends in Africa: A 30 Years Overview with Bibliometric Analysis Review.Arch Comput Methods Eng. 2023 Apr 29:1-31. doi: 10.1007/s11831-023-09930-z. Online ahead of print. Arch Comput Methods Eng. 2023. PMID: 37359741 Free PMC article. Review.
-
An automated diagnosis and classification of COVID-19 from chest CT images using a transfer learning-based convolutional neural network.Comput Biol Med. 2022 May;144:105383. doi: 10.1016/j.compbiomed.2022.105383. Epub 2022 Mar 10. Comput Biol Med. 2022. PMID: 35290811 Free PMC article.
Cited by
-
Publications on COVID-19 in radiology journals in 2020 and 2021: bibliometric citation and co-citation network analysis.Eur Radiol. 2023 May;33(5):3103-3114. doi: 10.1007/s00330-022-09340-y. Epub 2022 Dec 26. Eur Radiol. 2023. PMID: 36571605 Free PMC article.
-
CovFrameNet: An Enhanced Deep Learning Framework for COVID-19 Detection.IEEE Access. 2021 May 25;9:77905-77919. doi: 10.1109/ACCESS.2021.3083516. eCollection 2021. IEEE Access. 2021. PMID: 36789158 Free PMC article.
-
Machine Learning-Based Research for COVID-19 Detection, Diagnosis, and Prediction: A Survey.SN Comput Sci. 2022;3(4):286. doi: 10.1007/s42979-022-01184-z. Epub 2022 May 12. SN Comput Sci. 2022. PMID: 35578678 Free PMC article.
-
Machine Learning-Based Approach for Identifying Research Gaps: COVID-19 as a Case Study.JMIR Form Res. 2024 Mar 5;8:e49411. doi: 10.2196/49411. JMIR Form Res. 2024. PMID: 38441952 Free PMC article.
-
Bibliometric analysis for artificial intelligence in the internet of medical things: mapping and performance analysis.Front Artif Intell. 2024 Aug 12;7:1347815. doi: 10.3389/frai.2024.1347815. eCollection 2024. Front Artif Intell. 2024. PMID: 39188356 Free PMC article. Review.
References
-
- Ardakani AA, Kanafi AR, Acharya UR, Khadem N, Mohammadi A. Application of deep learning technique to manage COVID-19 in routine clinical practice using CT images: results of 10 convolutional neural networks. Computers in Biology and Medicine. 2020;121:103795. doi: 10.1016/j.compbiomed.2020.103795. - DOI - PMC - PubMed
LinkOut - more resources
Full Text Sources
Miscellaneous