. 2021 Apr:34:100778.
doi: 10.1016/j.eclinm.2021.100778. Epub 2021 Mar 30.

Assessment of pulmonary arterial circulation 3 months after hospitalization for SARS-CoV-2 pneumonia: Dual-energy CT (DECT) angiographic study in 55 patients

Affiliations

Assessment of pulmonary arterial circulation 3 months after hospitalization for SARS-CoV-2 pneumonia: Dual-energy CT (DECT) angiographic study in 55 patients

Martine Remy-Jardin et al. EClinicalMedicine. 2021 Apr.

Abstract

Background: During COVID-19, the main manifestations of the disease are not only pneumonia but also coagulation disorders. The purpose of this study was to evaluate pulmonary vascular abnormalities 3 months after hospitalization for SARS-CoV-2 pneumonia in patients with persistent respiratory symptoms.

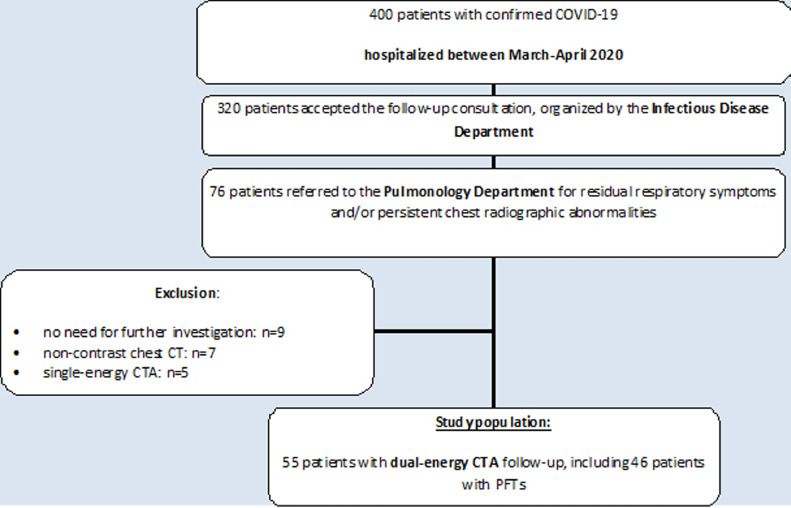
Methods: Among the 320 patients who participated in a systematic follow-up 3 months after hospitalization, 76 patients had residual symptoms justifying a specialized follow-up in the department of pulmonology. Among them, dual-energy CT angiography (DECTA) was obtained in 55 patients.

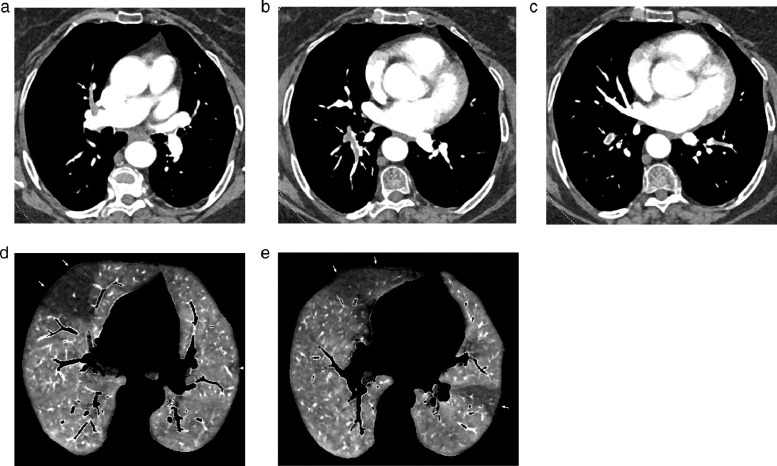
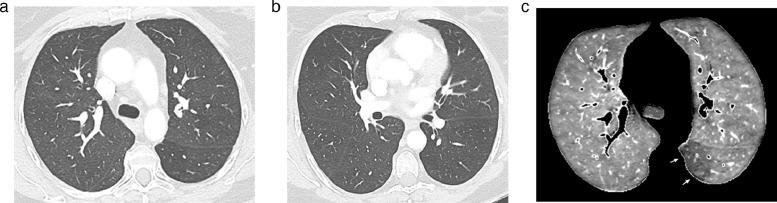
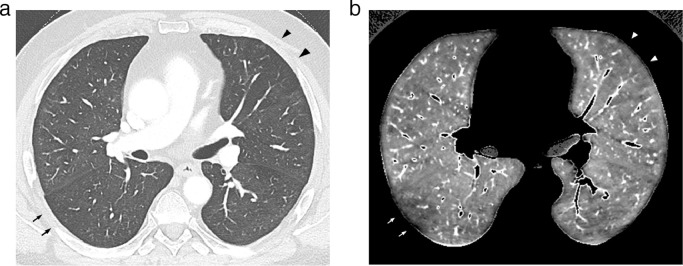
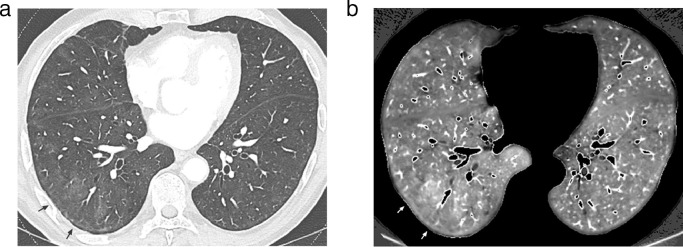
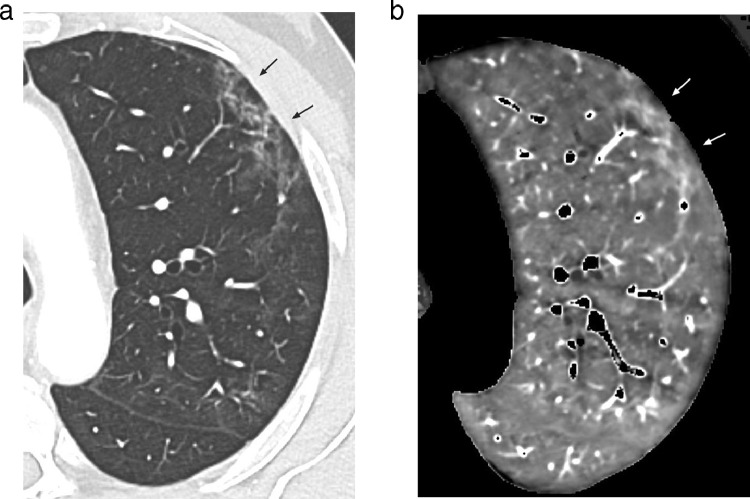
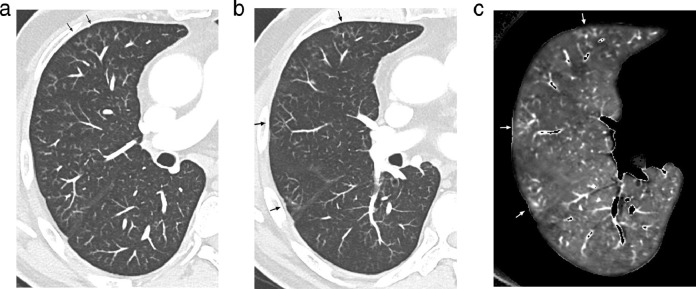
Findings: The 55 patients had partial (n = 40; 72.7%) or complete (n = 15; 27.3%) resolution of COVID-19 lung infiltration. DECTA was normal in 52 patients (52/55; 94.6%) and showed endoluminal filling defects in 3 patients (3/55; 5.4%) at the level of one (n = 1) and two (n = 1) segmental arteries of a single lobe and within central and peripheral arteries (n = 1). DECT lung perfusion was rated as non-interpretable (n = 2;3.6%), normal (n = 17; 30.9%) and abnormal (n = 36; 65.5%), the latter group comprising 32 patients with residual COVID-19 opacities (32/36; 89%) and 4 patients with normal lung parenchyma (4/36; 11%). Perfusion abnormalities consisted of (a) patchy defects (30/36; 83%), (b) PE-type defects (6/36; 16.6%) with (n = 1) or without proximal thrombosis (n = 5); and (c) focal areas of hypoperfusion (2/36; 5.5%). Increased perfusion was seen in 15 patients, always matching GGOs, bands and/or vascular tree-in- bud patterns.

Interpretation: DECT depicted proximal arterial thrombosis in 5.4% of patients and perfusion abnormalities suggestive of widespread microangiopathy in 65.5% of patients. Lung microcirculation was abnormal in 4 patients with normal lung parenchyma.

Keywords: COVID-19; CT angiography; Dual-energy CT; Lung perfusion; Pulmonary embolism.


Conflict of interest statement

Author MRJ received nonfinancial support for clinical research purposes from Siemens Healthineers. Author JR received personal fees as consultant for Siemens Healthineers and non-financial support for clinical research purposes. All other authors have nothing to declare.

Figures

Fig 1:
Fig. 1
Flow-chart of the study population.
Fig 2:
Fig. 2
Dual-energy CT angiography obtained in a 74 yr-old obese female(BMI: 38.64 kg/m2), 16 weeks after COVID-19 pneumonia with oxygen requirement. Mediastinal images obtained at the level of the right bronchus intermedius (Fig. 2a) and left atrium (Fig. 2b-Fig. 2c) showing multiple filling defects within lobar, segmental and sub-segmental arteries (arrows) in both lungs. Perfusion images obtained at the level of the upper (Fig. 2d) and lower (Fig. 2e) lobes showing large PE-type perfusion defects in both lungs (arrows) and a small PE-type defect in the let upper lobe (arrowhead, Fig. 2d).
Fig 3:
Fig. 3
Dual-energy CT angiography obtained in a 57 yr-old obese female(BMI: 33.58 kg/m2), 14 weeks after COVID-19 pneumonia with high-flow oxygen requirement. Lung images obtained at the level of the carina (Fig. 3a) and right bronchus intermedius (Fig. 3b) showing the absence of lung abnormality, in particular at the level of the apical segment of the left lower lobe. 3c: Perfusion image obtained at the same level as that of Fig. 3a showing a peripheral PE-type defect in the apical segment of the left lower lobe (arrows).
Fig 4:
Fig. 4
Dual-energy CT angiography obtained in a 63 yr-old obese male(BMI: 31.9 kg/m2), 12 weeks after COVID-19 pneumonia requiring invasive ventilation. 4a: Lung image obtained at the level of the right bronchus intermedius showing a triangular zone of hypo-attenuation with small-sized pulmonary vessels suggestive of chronic pulmonary arterial obstruction in the anterior segment of the left upper lobe (arrowheads). Subtle hypoattenuated area in the apical segment of the right lower lobe (arrows). 4b: Perfusion image obtained at the same level as that of Fig. 4a showing a PE-type defect in the anterior segment of the left upper lobe (arrowheads) and a peripheral, truncated PE-type defect (arrows) in the apical segment of the right lower lobe.
Fig 5:
Fig. 5
Dual-energy CT angiography obtained in a 75 yr-old male with normal BMI(BMI: 23.43 kg/m2), 14 weeks after COVID-19 pneumonia with oxygen requirement. 5a: Lung image obtained at the level of the lower lung zones showing areas of mild ground glass attenuation in the right middle and right lower lobes. The arrows point to the largest area of GGO. 5b: Perfusion image obtained at the same level as that of Fig. 5a showing increased perfusion matching with areas of GGO, well demonstrated at the level of the largest area of GGO (arrows).
Fig 6:
Fig. 6
Dual-energy CT angiography obtained in a 68 yr-old male with normal BMI(BMI: 24.08 kg/m2), 12 weeks after COVID-19 pneumonia requiring invasive ventilation. 6a: Lung image (magnified view) obtained at the level of the left upper lobe showing dense ground-glass opacities in the peripheral lung (arrows). 6b: Perfusion image obtained at the same level as that of Fig. 6a showing increased perfusion matching with peripheral areas of ground-glass attenuation (arrows).
Fig 7:
Fig. 7
Dual-energy CT angiography obtained in a 60 yr-old male with normal BMI(BMI: 24.5 kg/m2), 16 weeks after COVID-19 pneumonia requiring invasive ventilation. 7a: Lung image (magnified view of the right lung; 1-mm thick) obtained at the level of the right bronchus intermedius showing a subtle vascular tree-in-bud pattern in the right lung, more pronounced in the anterior segment of the right upper lobe (arrows). Lung image (magnified view of the right lung; 3-mm thick, maximum-intensity projection) (Fig. 7b) obtained 1 cm below Fig. 7a and corresponding perfusion image (Fig. 7c) showing superimposition of areas of increased perfusion on areas of vascular tree-in-bud (arrows).

References

    1. Raptis C.A., Hammer M.M., Short R.G. Chest CT and coronavirus disease (COVID-19): a critical review of the literature to date. AJR. 2020;215:1–4. - PubMed
    1. Connors J.M., Levy J.H. Thromboinflammation and the hypercoagulability of COVID-19. J Thromb Haemost. 2020;18:1559–1561. - PMC - PubMed
    1. Han H., Yang L., Liu R. Prominent changes in blood coagulation of patients with SARS-CoV-2 infection. Clin Chem Lab Med. 2020;58:1116–1120. - PubMed
    1. Wichmann D., Sperhake J.P., Lütgehetmann Autopsy findings and venous thromboembolism in patients with COVID-19. Ann Intern Med. 2020;173:268–277. - PMC - PubMed
    1. Lax S.F., Skok K., Zechner P. Pulmonary arterial thrombosis in COVID-19 with fatal outcome: results from a prospective, single-center, clinicopathologic case series. Ann Intern Med. 2020;173:350–361. - PMC - PubMed