

SARS-CoV-2 prevalence associated to low socioeconomic status and overcrowding in an LMIC megacity: A population-based seroepidemiological survey in Lima, Peru
- PMID: 33817611
- PMCID: PMC8009628
- DOI: 10.1016/j.eclinm.2021.100801
SARS-CoV-2 prevalence associated to low socioeconomic status and overcrowding in an LMIC megacity: A population-based seroepidemiological survey in Lima, Peru
Abstract
Background: Worldwide, Peru has one of the highest infection fatality rates of COVID-19, and its capital city, Lima, accumulates roughly 50% of diagnosed cases. Despite surveillance efforts to assess the extent of the pandemic, reported cases and deaths only capture a fraction of its impact due to COVID-19's broad clinical spectrum. This study aimed to estimate the seroprevalence of SARS-CoV-2 in Lima, stratified by age, sex, region, socioeconomic status (SES), overcrowding, and symptoms.
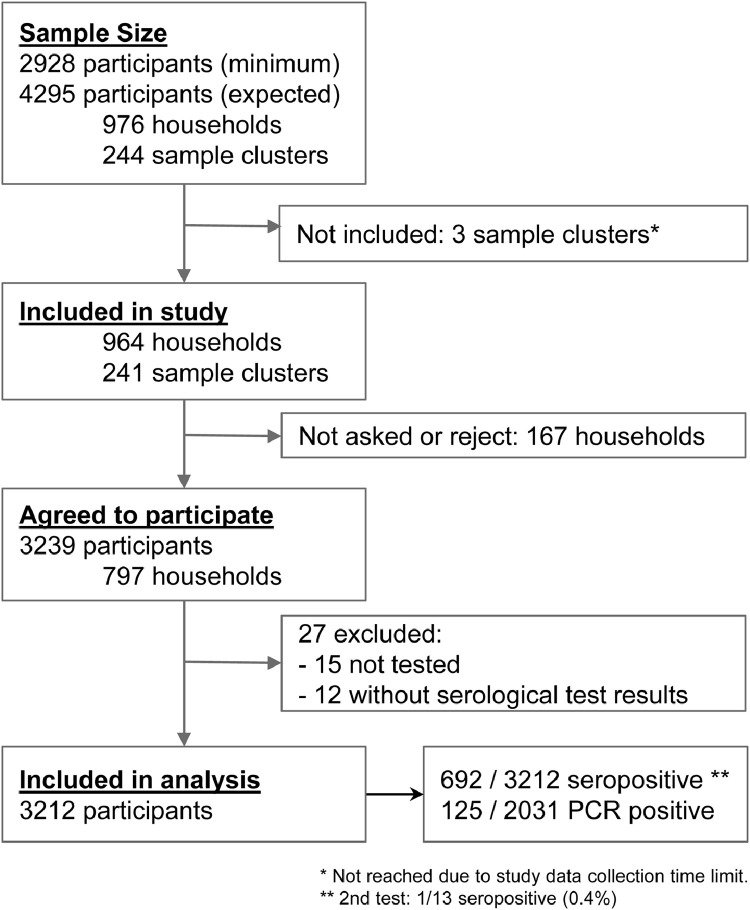
Methods: We conducted a multi-stage, population-based serosurvey in Lima, between June 28th and July 9th, 2020, after 115 days of the index case and after the first peak cases. We collected whole blood samples by finger-prick and applied a structured questionnaire. A point-of-care rapid serological test assessed IgM and IgG antibodies against SARS-CoV-2. Seroprevalence estimates were adjusted by sampling weights and test performance. Additionally, we performed RT-PCR molecular assays to seronegatives and estimated the infection prevalence.
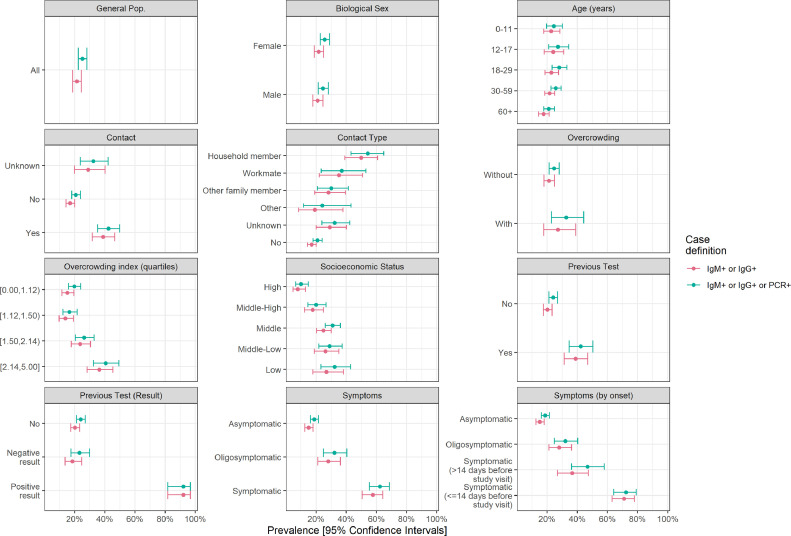
Findings: We enrolled 3212 participants from 797 households and 241 sample clusters from Lima in the analysis. The SARS-CoV-2 seroprevalence was 20·8% (95%CI 17·2-23·5), and the prevalence was 25·2% (95%CI 22·5-28·2). Seroprevalence was equally distributed by sex (aPR=0·96 [95%CI 0·85-1·09, p = 0·547]) and across all age groups, including ≥60 versus ≤11 years old (aPR=0·96 [95%CI 0·73-1·27, p = 0·783]). A gradual decrease in SES was associated with higher seroprevalence (aPR=3·41 [95%CI 1·90-6·12, p<0·001] in low SES). Also, a gradual increase in the overcrowding index was associated with higher seroprevalence (aPR=1·99 [95%CI 1·41-2·81, p<0·001] in the fourth quartile). Seroprevalence was also associated with contact with a suspected or confirmed COVID-19 case, whether a household member (48·9%, aPR=2·67 [95%CI 2·06-3·47, p<0·001]), other family members (27·3%, aPR=1·66 [95%CI 1·15-2·40, p = 0·008]) or a workmate (34·1%, aPR=2·26 [95%CI 1·53-3·35, p<0·001]). More than half of seropositive participants reported never having had symptoms (56·1%, 95% CI 49·7-62·3).
Interpretation: This first estimate of SARS-CoV-2 seroprevalence in Lima shows an intense transmission scenario, despite the government's numerous interventions early established. Susceptibles across age groups show that physical distancing interventions must not be relaxed. SES and overcrowding households are associated with seroprevalence. This study highlights the importance of considering the existing social inequalities for implementing the response to control transmission in low- and middle-income countries.
Keywords: COVID-19; Lima; Peru; Population-based; Prevalence; SARS-CoV-2; Seroprevalence.
© 2021 The Authors.
Conflict of interest statement
Dr. Margot Vidal declared having been Executive Director of the Directorate of Noncommunicable Diseases of the National Center for Public Health at INS during the study's execution. The other authors have no conflicts of interest.
Figures
References
-
- WHO. Coronavirus disease (COVID-19) Weekly epidemiological update [Internet]. 2020 [cited 2021 Jan 25]. Available from: https://www.who.int/docs/default-source/coronaviruse/situation-reports/2...
-
- MINSA. Current situation COVID-19, as of July 9, 2020 [Internet]. Ministry of Health of Peru; 2020 [cited 2021 Jan 29]. Available from: https://www.dge.gob.pe/portal/docs/tools/coronavirus/coronavirus090720.pdf
-
- Juscamayta-López E., Tarazona D., Valdivia F., Rojas N., Carhuaricra D., Maturrano L., et al. Phylogenomics reveals multiple introductions and early spread of SARS-CoV-2 into Peru [Internet]. 2020. Available from: http://dx.doi.org/ 10.1101/2020.09.14.296814 - PMC - PubMed
-
- MINSA. Situation Room COVID-19 Peru [Internet]. Ministry of Health of Peru. 2020 [cited 2020 Jul 31]. Available from: https://covid19.minsa.gob.pe/sala_situacional.asp
LinkOut - more resources
Full Text Sources
Other Literature Sources
Miscellaneous
