. 2021 Mar 2:4:100090.
doi: 10.1016/j.jtauto.2021.100090. eCollection 2021.

An elevated polyclonal free light chain level reflects a strong interferon signature in patients with systemic autoimmune diseases

Affiliations

An elevated polyclonal free light chain level reflects a strong interferon signature in patients with systemic autoimmune diseases

Eléonore Bettacchioli et al. J Transl Autoimmun. .

Abstract

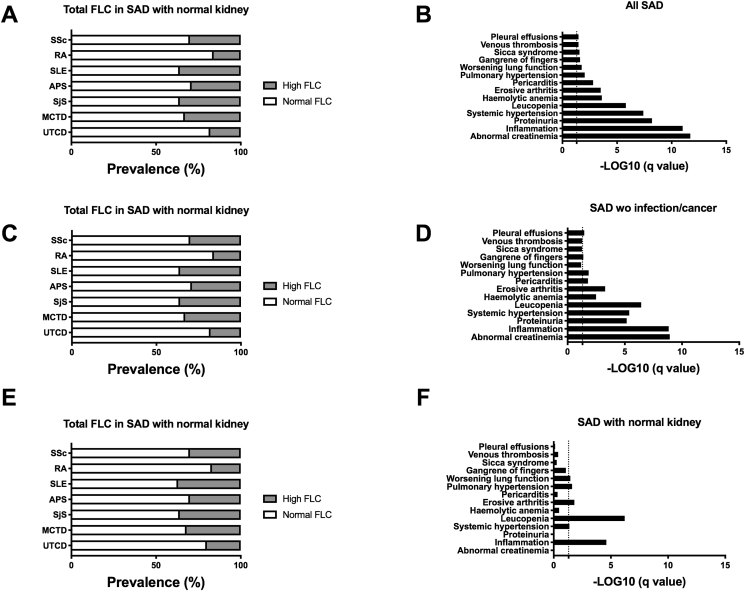
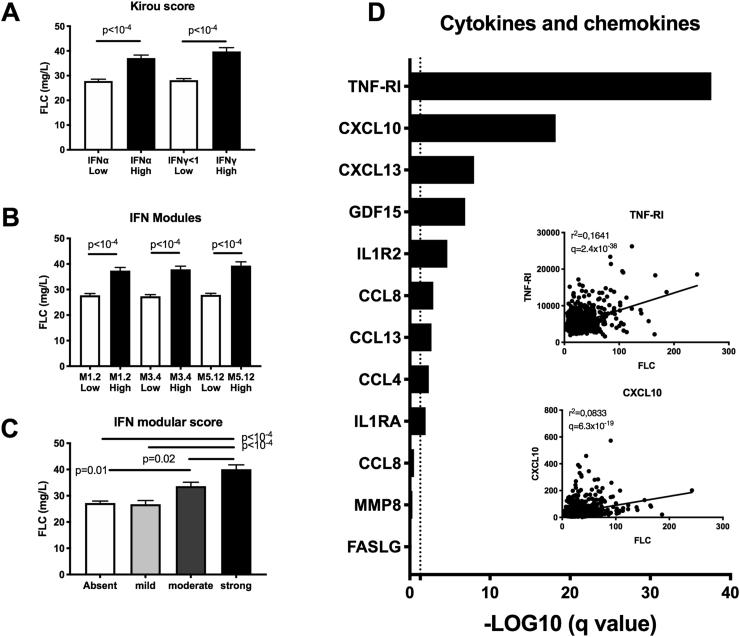
High amount of polyclonal free light chains (FLC) are reported in systemic autoimmune diseases (SAD) and we took advantage of the PRECISESADS study to better characterize them. Serum FLC levels were explored in 1979 patients with SAD (RA, SLE, SjS, Scl, APS, UCTD, MCTD) and 614 healthy controls. Information regarding clinical parameters, disease activity, medications, autoantibodies (Ab) and the interferon α and/or γ scores were recorded. Among SAD patients, 28.4% had raised total FLC (from 12% in RA to 30% in SLE and APS) with a normal kappa/lambda ratio. Total FLC levels were significantly higher in SAD with inflammation, active disease in SLE and SjS, and an impaired pulmonary functional capacity in SSc, while independent from kidney impairment, infection, cancer and treatment. Total FLC concentrations were positively correlated among the 10/17 (58.8%) autoantibodies (Ab) tested with anti-RNA binding protein Ab (SSB, SSA-52/60 kDa, Sm, U1-RNP), anti-dsDNA/nucleosome Ab, rheumatoid factor and negatively correlated with complement fractions C3/C4. Finally, examination of interferon (IFN) expression as a potential driver of FLC overexpression was tested showing an elevated level of total FLC among patients with a high IFNα and IFNγ Kirou's score, a strong IFN modular score, and the detection in the sera of B-cell IFN dependent factors, such as TNF-R1/TNFRSF1A and CXCL10/IP10. In conclusion, an elevated level of FLC, in association with a strong IFN signature, defines a subgroup of SAD patients, including those without renal affectation, characterized by increased disease activity, autoreactivity, and complement reduction.

Keywords: APS, primary antiphospholipid syndrome; AUC, area under the curve; Ab, autoantibody; Autoantibodies; Autoimmune diseases; CCP, cyclic citrulinated peptide; CXCL10, C-X-C motif chemokine 10; F, female; FLC, free light chains; Free light chains; HC, healthy controls; IFN, interferon; Interferon signature; M, male; MCTD, mixed connective tissue disease; MDA, malondialdehyde; NK, natural killer; PC, phosphorylcholine; RA, rheumatoid arthritis; RF, rheumatoid factor; RNP, ribonucleoprotein; ROC, Receiver Operating Characteristics; SAD, systemic autoimmune diseases; SD, standard deviation; SLE, systemic lupus erythematosus; Scl, systemic sclerosis; SjS, Sjögren's syndrome; TH1, T helper type 1; TNF-R1, tumor necrosis factor receptor 1; UCTD, undetermined connective tissue disease; VAS, visual analogical scale; κ, kappa; λ, lambda.


Conflict of interest statement

All authors declare that they have no conflict of interest.

Figures

Fig. 1
Fig. 1
Free light chain (FLC) levels are elevated in systemic autoimmune diseases (SAD). A. Serum levels for total FLC (FLC-κ+λ) in controls (n ​= ​614), SAD patients (n ​= ​1979) and within the subgroups of SAD patients without infection and/or a history of cancer (n ​= ​1782), and with normal kidney function (n ​= ​1274). The dotted lines represent the selected cut-off fixed at 95% specificity: 37 ​mg/L for total FLC. B: ROC curves were performed in controls and SAD in order to determine the area under the curve (AUC) and cut-off values (95% specificity). C: ROC curves showing similar AUC characteristics when the SAD patient subgroup without renal impairment was selected instead of all SAD patients. D: Concordance assessment between total FLC (FLC-κ+λ), FLC kappa (FLC-κ), and FLC lambda (FLC-λ) using the Kappa coefficient of Cohen.
Fig. 2
Fig. 2
Elevated free light chain (FLC) levels are reported in patients with systemic autoimmune disease (SAD) and associations with clinical manifestations. A: Distribution of patients with elevated total FLC levels, results are expressed as percentages. B: Significant clinical parameters associated with elevated total FLC in all SAD patients are presented. C/D: Distribution and clinical associations in the subgroup of SAD patients without infection and/or cancer. E/F: Distribution and clinical associations in the subgroup of SAD patients with normal kidney function. Abbreviations: SLE: systemic lupus erythematosus; RA: Rheumatoid Arthritis; SjS: Sjögren Syndrome; SSc: Systemic Sclerosis; APS: Primary Antiphospholipid Syndrome; MCTD: Mixed connective tissue disease; and UTCD: Undetermined connective tissue disease. For statistical analysis a T-test comparing SAD with normal versus elevated FLC levels was used and adjusted false discovery rate values (q-values), with a threshold <0.05, were expressed as –log10 of the q value.
Fig. 3
Fig. 3
Free light chain (FLC) levels are associated with increased disease activity in patients with systemic autoimmune diseases (SAD), pulmonary functions in systemic sclerosis (SSc) and independent of current treatments. A. Visual analogical scale representing the disease activity scoring system designed for the PRECISESADS study, according to the FLC status of SLE, RA, SjS, SSc, APS, MTCD and UTCD patients. B. Pulmonary function using FVC, FLCO and FVC/FLCO ratio was assessed for SSc; and the disease activity scores ESSDAI and SLEDAI, were calculated and only available for SjS and SLE patients, respectively. For statistical analysis, a T-test comparing SADs with normal FLC versus elevated FLC levels was used and adjusted false discovery rate values (q-values) with a threshold <0.05 were expressed as –log10 of the q value. C. Heat-map displaying treatments (anti-malarial, steroids, immunosuppressant and biological) taken by SADs patients according to their serum FLC levels. Results are expressed as percentages of patients currently taking the corresponding treatment. Abbreviations: FVC: forced vital capacity; DLCO: Diffusing Capacity for Carbon Monoxide; ESSDAI: EULAR Sjogren's Syndrome Disease Activity Index; SLEDAI: systemic lupus erythematosus disease activity index; SLE: systemic lupus erythematosus; RA: Rheumatoid Arthritis; SjS: Sjögren's syndrome.
Fig. 4
Fig. 4
Free light chain (FLC) levels are correlated with a subset of autoantibodies and complement reduction in systemic autoimmune diseases (SAD). A: all systemic autoimmune disease (SAD) patients. B: subgroup of SAD patients with normal renal function. Abbreviations: SSA/B: anti-sicca syndrome A or B autoantibodies (Ab); dsDNA-NcX: anti-DNA/nucleosome or anti-chromatin Ab; C3/C4 low: complement faction C3c/C4 with a negative correlation (low); dsDNA: anti-double stranded DNA Ab; Sm: anti-Smith Ab; RF: rheumatoid factors; U1-RNP: anti-U1 ribonucleoprotein Ab; MDA: anti-malondialdehyde modified LDL Ab; B2GPI: beta-2 glycoprotein I Ab; PC: anti-phosphatidyl choline Ab; aCL: anti-cardiolipin Ab; Centromere: anti-centromere Ab; Scl70: anti-Scl70 Ab; CCP2: anti-citrullinated peptide generation 2 Ab; IgG: immunoglobulin G; IgM: immunoglobulin M. For statistical analysis pairwise Pearson's correlations between total FLC and biological parameters were calculated and the adjusted false discovery rate values (q-values) expressed using the –log10 of the q value.
Fig. 5
Fig. 5
Elevated levels of free light chains (FLC) found in patients with systemic autoimmune disease (SAD) are associated with an interferon (IFN) signature and pro-inflammatory cytokines and chemokines. Serum total FLC levels in patients with SAD according to their IFN signature based on (A) Kirou's score that evaluates IFNα and IFNγ signatures; (B) modular score based on 3 co-clustered gene sets: M1.2, M3.4 and M5.12. The M1.2 was induced by IFNα/β, while both M1.2 and M3.4 transcripts were upregulated by IFNα/β and IFNγ; (C) the number of positive modules: 0 (absent); 1 (mild); 2 (moderate); and 3 (strong). High Kirou's scores and IFN modules score were determined based on the mean value ​+ ​2 standard deviations from the control population. D: Free light chain levels are correlated with inflammatory cytokines and chemokines in patients with SAD. For statistical analysis pairwise Pearson's correlations between total FLC and pro-inflammatory cytokines and chemokines were calculated and the adjusted false discovery rate values (q-values) expressed using the –log10 of the q value. Correlation curves with Spearman's rho and q values are also displayed for TNF-R1 and CXCL10.

References

    1. Brooks W.H., Le Dantec C., Pers J.O., Youinou P., Renaudineau Y. Epigenetics and autoimmunity. J. Autoimmun. 2010;34:J207–J219. - PubMed
    1. Barrat F.J., Crow M.K., Ivashkiv L.B. Interferon target-gene expression and epigenomic signatures in health and disease. Nat. Immunol. 2019;20:1574–1583. - PMC - PubMed
    1. Gazeau P., Alegria G.C., Devauchelle-Pensec V., Jamin C., Lemerle J., Bendaoud B. Memory B cells and response to abatacept in rheumatoid arthritis. Clin. Rev. Allergy Immunol. 2017;53:166–176. - PubMed
    1. Simonin L., Pasquier E., Leroyer C., Cornec D., Lemerle J., Bendaoud B. Lymphocyte disturbances in primary antiphospholipid syndrome and application to venous thromboembolism follow-up. Clin. Rev. Allergy Immunol. 2017;53:14–27. - PubMed
    1. Alonso R., Buors C., Le Dantec C., Hillion S., Pers J.O., Saraux A. Aberrant expression of CD6 on B-cell subsets from patients with Sjogren's syndrome. J. Autoimmun. 2010;35:336–341. - PubMed