. 2021 Jul;34(7):e4516.
doi: 10.1002/nbm.4516. Epub 2021 Apr 4.

Imaging acute effects of bevacizumab on tumor vascular kinetics in a preclinical orthotopic model of U251 glioma

Affiliations

Imaging acute effects of bevacizumab on tumor vascular kinetics in a preclinical orthotopic model of U251 glioma

Tavarekere N Nagaraja et al. NMR Biomed. 2021 Jul.

Abstract

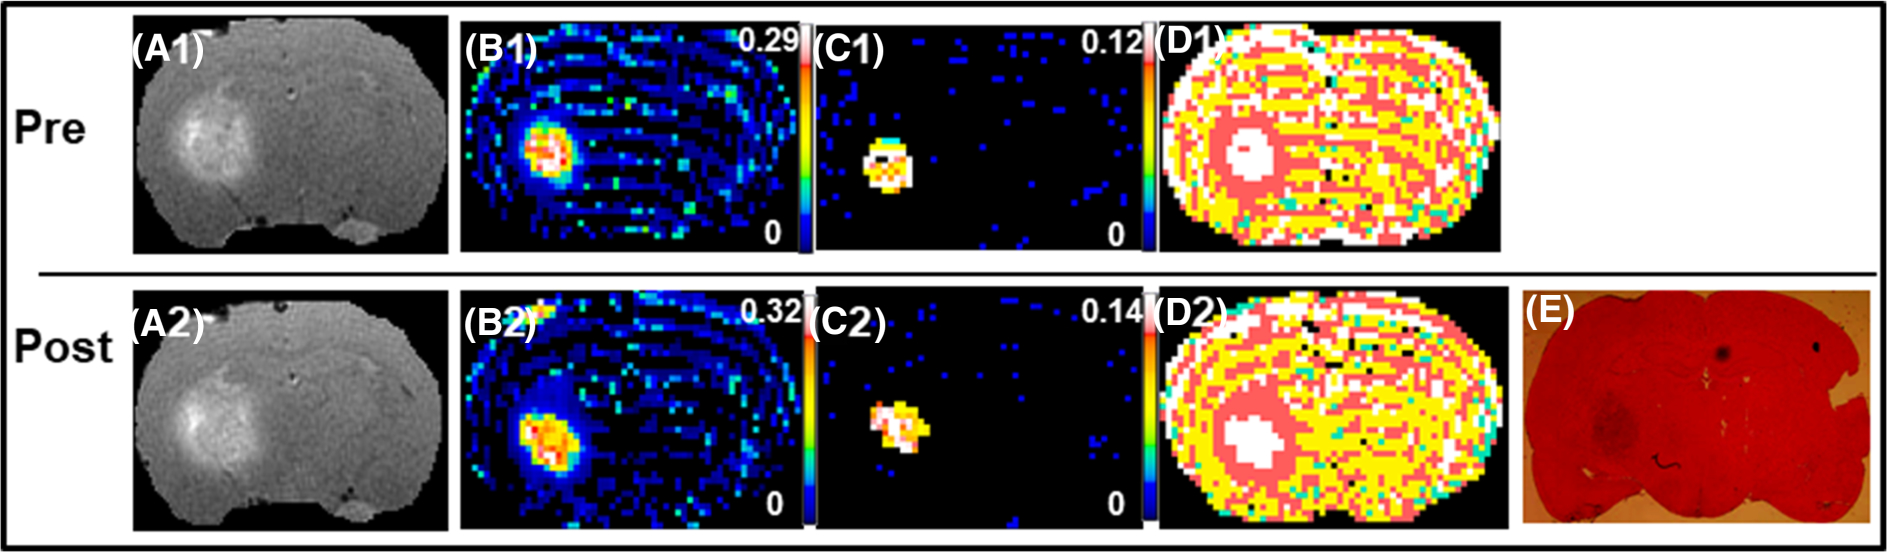
The effect of a human vascular endothelial growth factor antibody on the vasculature of human tumor grown in rat brain was studied. Using dynamic contrast-enhanced magnetic resonance imaging, the effects of intravenous bevacizumab (Avastin; 10 mg/kg) were examined before and at postadministration times of 1, 2, 4, 8, 12 and 24 h (N = 26; 4-5 per time point) in a rat model of orthotopic, U251 glioblastoma (GBM). The commonly estimated vascular parameters for an MR contrast agent were: (i) plasma distribution volume (vp ), (ii) forward volumetric transfer constant (Ktrans ) and (iii) reverse transfer constant (kep ). In addition, extracellular distribution volume (VD ) was estimated in the tumor (VD-tumor ), tumor edge (VD-edge ) and the mostly normal tumor periphery (VD-peri ), along with tumor blood flow (TBF), peri-tumoral hydraulic conductivity (K) and interstitial flow (Flux) and tumor interstitial fluid pressure (TIFP). Studied as % changes from baseline, the 2-h post-treatment time point began showing significant decreases in vp , VD-tumor, VD-edge and VD-peri , as well as K, with these changes persisting at 4 and 8 h in vp , K, VD-tumor, -edge and -peri (t-tests; p < 0.05-0.01). Decreases in Ktrans were observed at the 2- and 4-h time points (p < 0.05), while interstitial volume fraction (ve ; = Ktrans /kep ) showed a significant decrease only at the 2-h time point (p < 0.05). Sustained decreases in Flux were observed from 2 to 24 h (p < 0.01) while TBF and TIFP showed delayed responses, increases in the former at 12 and 24 h and a decrease in the latter only at 12 h. These imaging biomarkers of tumor vascular kinetics describe the short-term temporal changes in physical spaces and fluid flows in a model of GBM after Avastin administration.

Keywords: Avastin, DCE-MRI, distribution volume, GBM, Ktrans, Magnevist, peri-tumoral fluid flow, rat, tumor interstitial fluid pressure.


Figures

FIGURE 1
FIGURE 1
An example of spatial agreement between MRI parameters and histology in tumor location and distribution. A, T1 postcontrast; B, tumor blood flow; C, model selection; and D, hematoxylin and eosin (H&E) staining. The color scale bar for blood flow depicts values of 0–104 mL.min−1 (black to white). Tumor pixels showing model selection: white, Model 3; orange, Model 2
FIGURE 2
FIGURE 2
An example from a 1-h post-Avastin treatment study that showed no significant effects of therapy. The top panel is pretreatment (A1-D1) and the bottom panel, post-treatment (A2-E). The parameters maps shown from left to right are: postcontrast T1, Ktrans, ve, model selection and the corresponding hematoxylin and eosin (H&E) stained brain section. Note the relative stable distribution of all parameters between the two sessions, suggesting that Avastin did not exert significant effects on tumor vasculature and tumor microenvironment at 1 h after administration. The color scale bars represent the lowest to highest (black to white) values for the different parameters as shown on their respective maps. For the model map pixels, white is Model 3 acceptance, pink is Model 2 acceptance and yellow is Model 1 acceptance (green is not a number)
FIGURE 3
FIGURE 3
An example from a 4-h post-Avastin treatment study that showed significant effects of therapy. The top panel is pre-treatment (A1-D1) and the bottom panel, post-treatment (A2-E). The parameter maps shown from left to right are: postcontrast T1, Ktrans, ve, model selection and the corresponding hematoxylin and eosin (H&E) stained brain section. Note the decrease in the distribution of Model 3 voxels in tumor tissue (right hemisphere) from pretreatment to post-treatment maps indicative of effects of Avastin on tumor microenvironment at this time point. The color scale bars represent the lowest to highest (black to white) values for the different parameters as shown on their respective maps. For the model map pixels, white is Model 3 acceptance, orange is Model 2 acceptance and yellow is Model 1 acceptance (green is not a number)
FIGURE 4
FIGURE 4
Tumor fluid flows and fluxes. A graph of changes in cerebral blood flow (CBF), blood-to-brain forward volumetric transfer constant (Ktrans), tumor interstitial fluid pressure (TIFP) and peri-tumoral interstitial fluid flow (Flux) at times after Avastin (10 mg/kg; iv) treatment. The values are plotted as mean ± standard error of the mean % differences between the pre- and post-treatment values. Asterisks represent significant difference, p < 0.05
FIGURE 5
FIGURE 5
Tumor distribution spaces. A graph of changes in plasma distribution volume (vp), MRCA extracellular distribution volume (VD) and interstitial volume fraction (ve) at times after Avastin (10 mg/kg; iv) treatment. The values are plotted as mean ± standard error of the mean % differences between the pre- and post-treatment values. Asterisks represent significant difference, p < 0.05
FIGURE 6
FIGURE 6
Tumor peripheral spaces. A graph of changes in extracellular distribution volume in the tumor edge (VD-edge), in the immediately surrounding normal tissue, VD-peri and in K (hydraulic conductivity in the tumor periphery) as a function of time after Avastin (10 mg/kg; iv) treatment. These parameters reflect interactions at the boundary of the tumor and normal brain. The values are plotted as mean ± standard error of the mean from the % differences between the pre- and post-treatment values. Asterisks represent significant difference, p < 0.05

References

    1. Yu L, Wu X, Cheng Z, et al. Interaction between bevacizumab and murine VEGF-A: a reassessment. Invest Ophthalmol Vis Sci. 2008;49(2):522–527. - PubMed
    1. Field KM, Jordan JT, Wen PY, Rosenthal MA, Reardon DA. Bevacizumab and glioblastoma: scientific review, newly reported updates, and ongoing controversies. Cancer. 2015;121(7):997–1007. - PubMed
    1. Brandes AA, Mason W, Pichler J, et al. Can bevacizumab prolong survival for glioblastoma patients through multiple lines of therapy? Future Oncol. 2014;10(7):1137–1145. - PubMed
    1. Hacibekiroglu I, Kodaz H, Erdogan B, et al. Single-agent bevacizumab is an effective treatment in recurrent glioblastoma. Med Oncol (Northwood, London, England). 2015;32(2):460. 10.1007/s12032-014-0460-3 - DOI - PubMed
    1. Friedman HS, Prados MD, Wen PY, et al. Bevacizumab alone and in combination with irinotecan in recurrent glioblastoma. J Clin Oncol. 2009;27(28): 4733–4740. - PubMed

Publication types

LinkOut - more resources