. 2021 Oct;15(10):2766-2781.
doi: 10.1002/1878-0261.12960. Epub 2021 Jun 15.

KRAS mutant rectal cancer cells interact with surrounding fibroblasts to deplete the extracellular matrix

Affiliations

KRAS mutant rectal cancer cells interact with surrounding fibroblasts to deplete the extracellular matrix

Jin K Kim et al. Mol Oncol. 2021 Oct.

Abstract

Somatic mutations in the KRAS oncogene are associated with poor outcomes in locally advanced rectal cancer but the underlying biologic mechanisms are not fully understood. We profiled mRNA in 76 locally advanced rectal adenocarcinomas from patients that were enrolled in a prospective clinical trial and investigated differences in gene expression between KRAS mutant (KRAS-mt) and KRAS-wild-type (KRAS-wt) patients. We found that KRAS-mt tumors display lower expression of genes related to the tumor stroma and remodeling of the extracellular matrix. We validated our findings using samples from The Cancer Genome Atlas (TCGA) and also by performing immunohistochemistry (IHC) and immunofluorescence (IF) in orthogonal cohorts. Using in vitro and in vivo models, we show that oncogenic KRAS signaling within the epithelial cancer cells modulates the activity of the surrounding fibroblasts in the tumor microenvironment.

Keywords: KRAS; cancer-associated fibroblast; extracellular matrix; rectal cancer; tumor response; tumor stroma.


Conflict of interest statement

JGA has received honorarium for being a consultant with the following: Medtronics, Ethicon J&J, Da Vinci Intuitive Surgical. JJS has received travel support from Intuitive Surgical Inc. for fellow education (2015) and has served as a clinical advisor for Guardant Health, Inc (2019). The other co‐authors have no conflicts of interest to disclose.

Figures
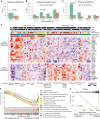
Fig. 1
Fig. 1
KRAS mutant LARC tumors have a distinct transcriptomic signature notable for dysregulated stromal genes and genes coding ECM‐related proteins. (A) KRAS mutations are associated with lower fractions of complete pathological response in 186 sequenced patients from the TIMING trial (P = 0.001). (B) KRAS‐mt patients have consistently lower fractions of pCR across all treatment groups. pCR rates were significantly different by KRAS status in the treatment subgroup with the greatest number of patients (n = 59, P = 0.020). All patients received chemoradiation (fluorouracil 225 mg·m−2 per day by continuous infusion throughout radiotherapy, and 45 Gy in 25 fractions, 5 days per week for 5 weeks, followed by a minimum boost of 5·4 Gy). Each cycle of mFOLFOX6 consisted of racemic leucovorin 200 or 400 mg·m−2, oxaliplatin 85 mg·m−2 in a 2‐h infusion, bolus fluorouracil 400 mg·m−2 on day 1, and a 46‐h infusion of fluorouracil 2400 mg·m−2. (C) Based on mRNA data for 76 patients, KRAS‐mt tumors also exhibited consistently lower fraction of pCR across all molecular subtypes. pCR rates by KRAS status were significantly different in CMS1 (P = 0.047). Only statistically significant changes based on Fisher’s test are marked in figures (A‐C). (D) Heatmap of differentially expressed genes (FDR<0.05, |log2FoldChange| > 1) in KRAS‐mt and KRAS‐wt LARC pretreatment tumors from the LARC‐TIMING cohort. (E) Gene set enrichment analysis (GSEA) enrichment plots for the 15 most significant pathways in our cohort, ranked by statistical significance (Table S5), reveal significant downregulation of ECM and matrisome‐related genes in KRAS‐mt tumors. (F) GSEA enrichment plot using the ESTIMATE stromal signature shows significant downregulation of stroma‐related genes in KRAS‐mt tumors.
Fig. 2
Fig. 2
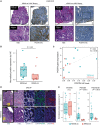
Expression of ECM proteins in the tumor stroma is reduced in KRAS‐mt CRC. (A) Representative images of POSTN IHC staining in KRAS‐mt (n = 11) vs KRAS‐wt (n = 12) LARC biopsies. Scale bar corresponds to 500 μm for the upper panels and 100 μm for the lower panels. (B) Quantification of POSTN IHC staining in KRAS‐mt (n = 11) vs KRAS‐wt (n = 12) LARC biopsies. KRAS‐mt tumors have lower POSTN levels than KRAS‐wt tumors (P = 0.03). Median value from 3 to 5 quantified tumor areas per sample (threshold intensity/mm2) is plotted. (C) RNA expression of POSTN via RNAseq correlates with protein expression (assessed with Spearman’s correlation, P = 0.02, rho=0.59); n = 9 KRAS‐wt, n = 6 KRAS‐mt. R2=0.22 for the linear model approximation. (D) IF of VIM, POSTN, FN1 in KRAS‐mt (n = 12) vs KRAS‐wt (n = 23) CRC specimens. Scale bar corresponds to 1000 μm on the left most panels and 100 μm on the other panels. (E) Levels of VIM, POSTN, and FN1 expression on IF. Median value from 6 quantified tumor areas per sample (intensity/mm2) is plotted. POSTN and FN1 expression is lower in KRAS‐mt versus KRAS‐wt tumors (P < 0.001 and P = 0.001, respectively). Whiskers in B, E box plots represent 1.5× the interquartile range. P‐values in B, E were computed using one‐sided Wilcoxon rank‐sum tests.
Fig. 3
Fig. 3
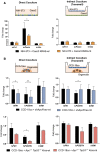
Expression of ECM‐related proteins by cancer‐associated fibroblasts is reduced in KRAS‐mt tumors. (A) Transgenic mice with reverse tet‐transactivator (rtTA3) in a LSL cassette were crossed with TRE‐regulated, GFP‐linked short‐hairpin Apc (TG‐shApc) and then crossed with Lgr5‐hydroxytamoxifen (4‐OHT) inducible Cre (Lgr5‐CreER). These mice were then treated with doxycycline (Dox) and 4‐OHT to generate shApc/Kras‐wt mice. The shApc/Kras‐mt line was created by crossing in an additional LSL‐KrasG12D allele. (B) Representative IF staining for VIM, POSTN, and FN1 in shApc/Kraswt (n = 3) and shApc/KrasG12D (n = 3) GEMMs. Scale bar corresponds to 100 μm for the left most panels and 50 μm on the others. (C) Levels of VIM, POSTN, and FN1 expression on IF (n = 3 shApc/Kraswt and n = 3 shApc/KrasG12D ). Median value of 3–5 quantified tumor areas per sample (density/mm2) is plotted. Error bars denote the standard error of mean. P‐values were computed using one‐sided Wilcoxon rank‐sum tests. (D) ECM‐related genes are consistently downregulated in KRAS‐mt across the LARC‐TIMING cohort (n = 42 KRAS‐wt, n = 34 KRAS‐mt), LARC‐TCGA cohort (n = 45 KRAS‐wt, n = 26 KRAS‐mt), and our GEMMs (n = 3 KRAS‐wt, n = 3 KRAS‐mt), while exhibiting opposing trends in KRAS‐mt (KRASG12V ) Caco2 cells (n = 3 KRAS‐wt, n = 3 KRAS‐mt) cultured in isolation. Bar plots show log2 fold changes in expression in KRAS‐mt vs KRAS‐wt tumors, with positive values corresponding to upregulation in KRAS‐mt tumors. HOXB6 and HOXB8 genes were included as reference genes based on their known upregulation in KRAS‐mt specimens. (E) GSEA enrichment plots show significant downregulation of genes in the ESTIMATE stromal gene signature for the shApc/KrasG12D mouse model. (F) No significant differences for the ESTIMATE stromal signature were observed in KRAS‐mt vs KRAS‐wt Caco2 cells.
Fig. 4
Fig. 4
Induction of KRAS mutation in CRC downregulates the expression of ECM genes of the surrounding fibroblasts in vitro. (A) Levels of Fn1, Postn, and Vim mRNA from mouse fibroblasts (NIH‐3T3) in direct or indirect co‐culture with Caco2‐KRASwt or Caco2‐KRASG12V were assessed by RT‐PCR. (B) Levels of FN1 and POSTN from human fibroblasts (CCD‐18co) grown in direct or indirect co‐culture with shApc/Kraswt or shApc/KrasG12D organoids were assessed by RT‐PCR. Additional co‐culture experiments with Apc −/− Trp53 −/− Kraswt and Apc −/− Trp53 −/− KrasG12D organoids were also performed. Error bars denote the standard error of mean. All experiments were done in biological and technical triplicates. One‐sided t‐test was performed. *, P < 0.05; ** P < 0.01.

References

    1. Siegel RL, Miller KD, Fuchs HE & Jemal A (2021) Cancer Statistics, 2021. CA Cancer J Clin 71, 7–33. - PubMed
    1. Cancer Genome Atlas Network (2012) Comprehensive molecular characterization of human colon and rectal cancer. Nature 487, 330–337. - PMC - PubMed
    1. Serebriiskii IG, Connelly C, Frampton G, Newberg J, Cooke M, Miller V, Ali S, Ross JS, Handorf E, Arora Set al. (2019) Comprehensive characterization of RAS mutations in colon and rectal cancers in old and young patients. Nat Commun 10, 3722. - PMC - PubMed
    1. Yaeger R, Chatila WK, Lipsyc MD, Hechtman JF, Cercek A, Sanchez‐Vega F, Jayakumaran G, Middha S, Zehir A, Donoghue MTAet al. (2018) Clinical sequencing defines the genomic landscape of metastatic colorectal cancer. Cancer Cell 33, 125–136.e3. - PMC - PubMed
    1. Andreyev HJ, Norman AR, Clarke PA, Cunningham D & Oates JR (1998) Kirsten ras mutations in patients with colorectal cancer: the multicenter “RASCAL” study. J Natl Cancer Inst 90, 675–684. - PubMed

Publication types

Substances