

Normal tissue adjacent to tumor expression profile analysis developed and validated a prognostic model based on Hippo-related genes in hepatocellular carcinoma
- PMID: 33818013
- PMCID: PMC8085948
- DOI: 10.1002/cam4.3890
Normal tissue adjacent to tumor expression profile analysis developed and validated a prognostic model based on Hippo-related genes in hepatocellular carcinoma
Abstract
Background: Hepatocellular carcinoma (HCC) is the most common malignant disease worldwide. Although the diagnosis and treatment of HCC have greatly improved in the recent years, there is still a lack of accurate methods to predict the prognosis of patients. Evidence has shown that Hippo signaling in tissues adjacent to HCC plays a significant role in HCC development. In the present study, we aimed to construct a model based on the expression of Hippo-related genes (HRGs) in tissues adjacent to HCC to predict the prognosis of HCC patients.
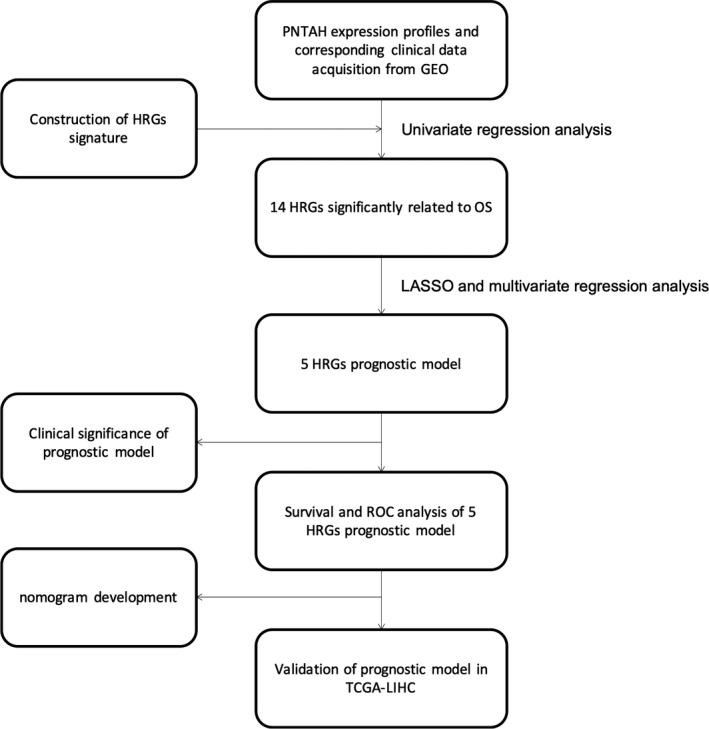
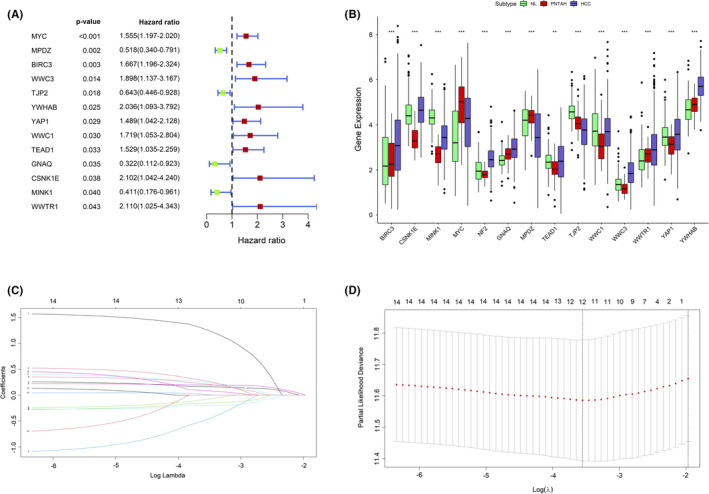
Methods: Gene expression data of paired normal tissues adjacent to HCC (PNTAH) and clinical information were obtained from Gene Expression Omnibus (GEO) and The Cancer Genome Atlas (TCGA) databases. The HRG signature was constructed using four canonical Hippo-related pathways. Univariate Cox regression analysis was used to screen survival-related HRGs. LASSO and multivariate Cox regression analyses were used to construct the prognostic model. The true and false positive rates of the model were confirmed using receiver operating characteristic (ROC) analysis.
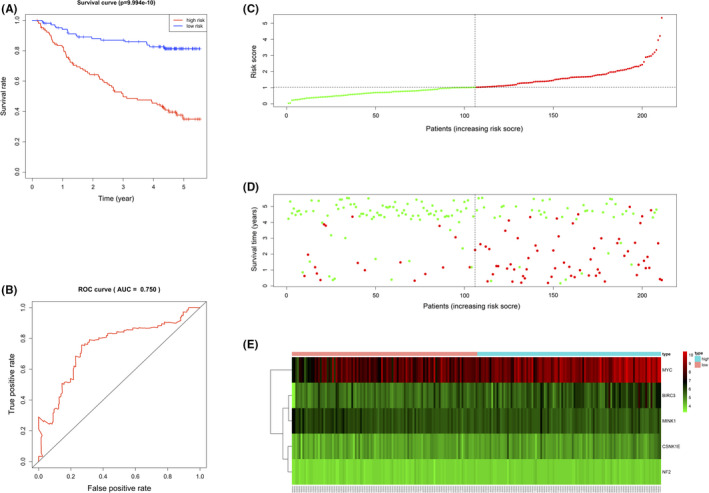
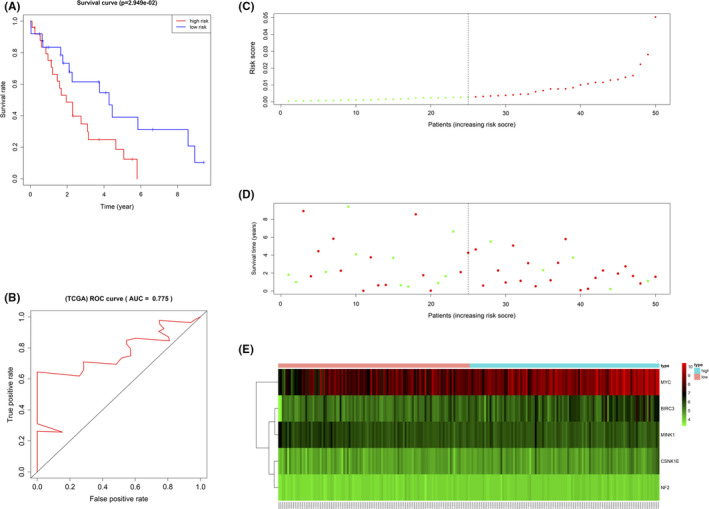
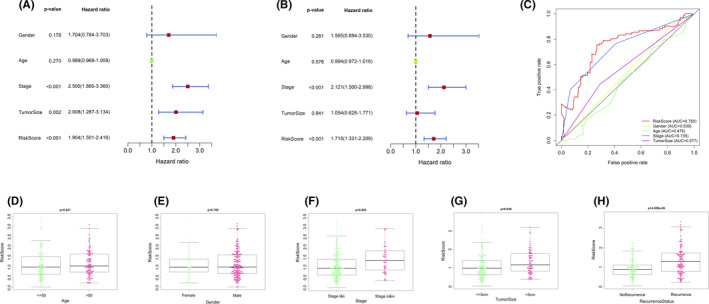
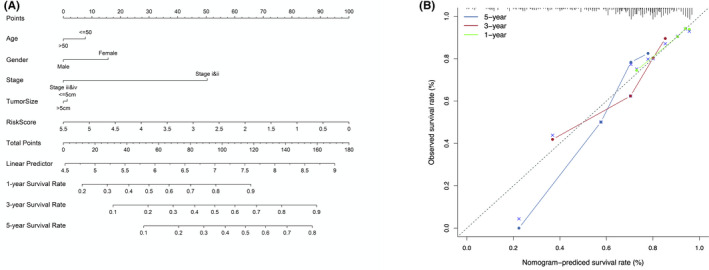
Results: The prognostic model was constructed based on the expression levels of five HRGs (NF2, MYC, BIRC3, CSNK1E, and MINK1) in PNTAH. The mortality rate of HCC patients increased as the risk score determined by the model increased. Furthermore, the risk score was found to be an independent risk factor for the survival of patients. ROC analysis showed that the prognostic model had a better predictive value than the other conventional clinical parameters. Moreover, the reliability of the prognostic model was confirmed in TCGA-LIHC cohort. A nomogram was generated to predict patient survival. An exploration of the predictive value of the model in HCC tissues indicated that the model is PNTAH-specific.
Conclusions: We developed and validated a prognostic model based on the expression levels of five HRGs in PNTAH, and this model should be helpful in predicting the prognosis of patients with HCC.
Keywords: Hippo-related genes; hepatocellular carcinoma; paired normal tissues adjacent to HCC; prognosis.
© 2021 The Authors. Cancer Medicine published by John Wiley & Sons Ltd.
Conflict of interest statement
The authors have no conflicts of interest to declare.
Figures
Similar articles
-
A novel five-gene signature predicts overall survival of patients with hepatocellular carcinoma.Cancer Med. 2021 Jun;10(11):3808-3821. doi: 10.1002/cam4.3900. Epub 2021 May 2. Cancer Med. 2021. PMID: 33934539 Free PMC article.
-
Identification of a Liver Progenitor Cell-Related Genes Signature Predicting Overall Survival for Hepatocellular Carcinoma.Technol Cancer Res Treat. 2021 Jan-Dec;20:15330338211041425. doi: 10.1177/15330338211041425. Technol Cancer Res Treat. 2021. PMID: 34866477 Free PMC article.
-
Construction and Validation of a Prognostic Gene-Based Model for Overall Survival Prediction in Hepatocellular Carcinoma Using an Integrated Statistical and Bioinformatic Approach.Int J Mol Sci. 2021 Feb 5;22(4):1632. doi: 10.3390/ijms22041632. Int J Mol Sci. 2021. PMID: 33562824 Free PMC article.
-
Identification of molecular subtypes and prognostic signatures based on transient receptor potential channel-related genes to predict the prognostic risk of hepatocellular carcinoma: A review.Medicine (Baltimore). 2023 Mar 10;102(10):e33228. doi: 10.1097/MD.0000000000033228. Medicine (Baltimore). 2023. PMID: 36897679 Free PMC article. Review.
-
Establishment and Clinical Application of the Nomogram Related to Risk or Prognosis of Hepatocellular Carcinoma: A Review.J Hepatocell Carcinoma. 2023 Aug 22;10:1389-1398. doi: 10.2147/JHC.S417123. eCollection 2023. J Hepatocell Carcinoma. 2023. PMID: 37637500 Free PMC article. Review.
Cited by
-
Upregulation of ABLIM1 Differentiates Intrahepatic Cholangiocarcinoma from Hepatocellular Carcinoma and Both Colorectal and Pancreatic Adenocarcinoma Liver Metastases.Genes (Basel). 2024 Nov 28;15(12):1545. doi: 10.3390/genes15121545. Genes (Basel). 2024. PMID: 39766812 Free PMC article.
-
Heterogeneity of hepatocellular carcinoma that responds differently to combination therapy with TACE and Sorafenib as determined by digital spatial gene expression profiling.Genes Genomics. 2024 Sep;46(9):1045-1058. doi: 10.1007/s13258-024-01548-0. Epub 2024 Jul 29. Genes Genomics. 2024. PMID: 39078588
-
Multi-region sequencing with spatial information enables accurate heterogeneity estimation and risk stratification in liver cancer.Genome Med. 2022 Dec 16;14(1):142. doi: 10.1186/s13073-022-01143-6. Genome Med. 2022. PMID: 36527145 Free PMC article.
-
Integrated clinical and prognostic analyses of mTOR/Hippo pathway core genes in hepatocellular carcinoma.J Physiol Biochem. 2024 May;80(2):439-449. doi: 10.1007/s13105-024-01015-0. Epub 2024 Mar 12. J Physiol Biochem. 2024. PMID: 38468074 Free PMC article.
-
Clinical Potential of Misshapen/NIKs-Related Kinase (MINK) 1-A Many-Sided Element of Cell Physiology and Pathology.Curr Issues Mol Biol. 2024 Dec 5;46(12):13811-13845. doi: 10.3390/cimb46120826. Curr Issues Mol Biol. 2024. PMID: 39727954 Free PMC article. Review.
References
-
- Villanueva A. Hepatocellular carcinoma. N Engl J Med. 2019;380(15):1450‐1462. - PubMed
-
- Bray F, Ferlay J, Soerjomataram I, Siegel RL, Torre LA, Jemal A. Global cancer statistics 2018: GLOBOCAN estimates of incidence and mortality worldwide for 36 cancers in 185 countries. CA Cancer J Clin. 2018;68(6):394‐424. - PubMed
-
- Chen CJ, Yang HI, Iloeje UH; Group R‐HS . Hepatitis B virus DNA levels and outcomes in chronic hepatitis B. Hepatology. 2009;49(5 Suppl):S72‐84. - PubMed
-
- Rafiq N, Bai C, Fang Y, et al. Long‐term follow‐up of patients with nonalcoholic fatty liver. Clin Gastroenterol Hepatol. 2009;7(2):234‐238. - PubMed
Publication types
MeSH terms
Substances
LinkOut - more resources
Full Text Sources
Other Literature Sources
Medical
Miscellaneous
