

Hepatic transcriptional profile reveals the role of diet and genetic backgrounds on metabolic traits in female progenitor strains of the Collaborative Cross
- PMID: 33818129
- PMCID: PMC8424536
- DOI: 10.1152/physiolgenomics.00140.2020
Hepatic transcriptional profile reveals the role of diet and genetic backgrounds on metabolic traits in female progenitor strains of the Collaborative Cross
Abstract
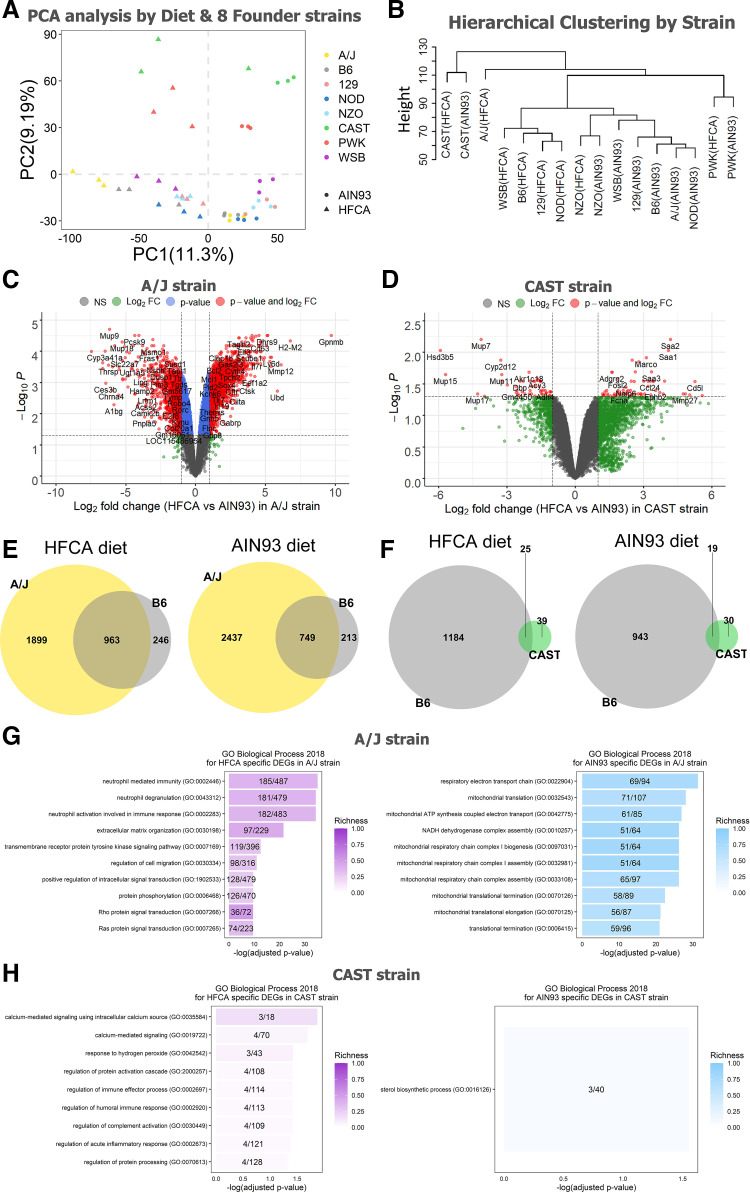
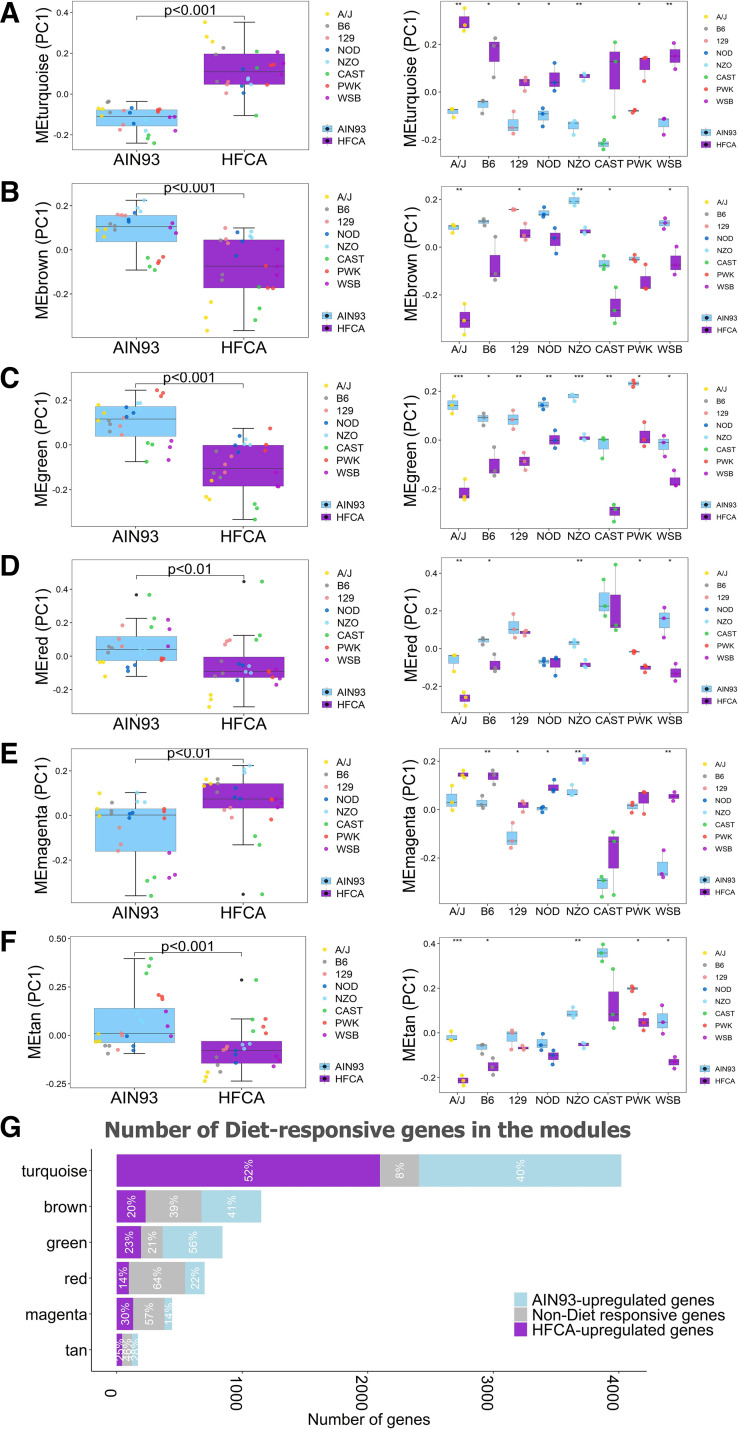
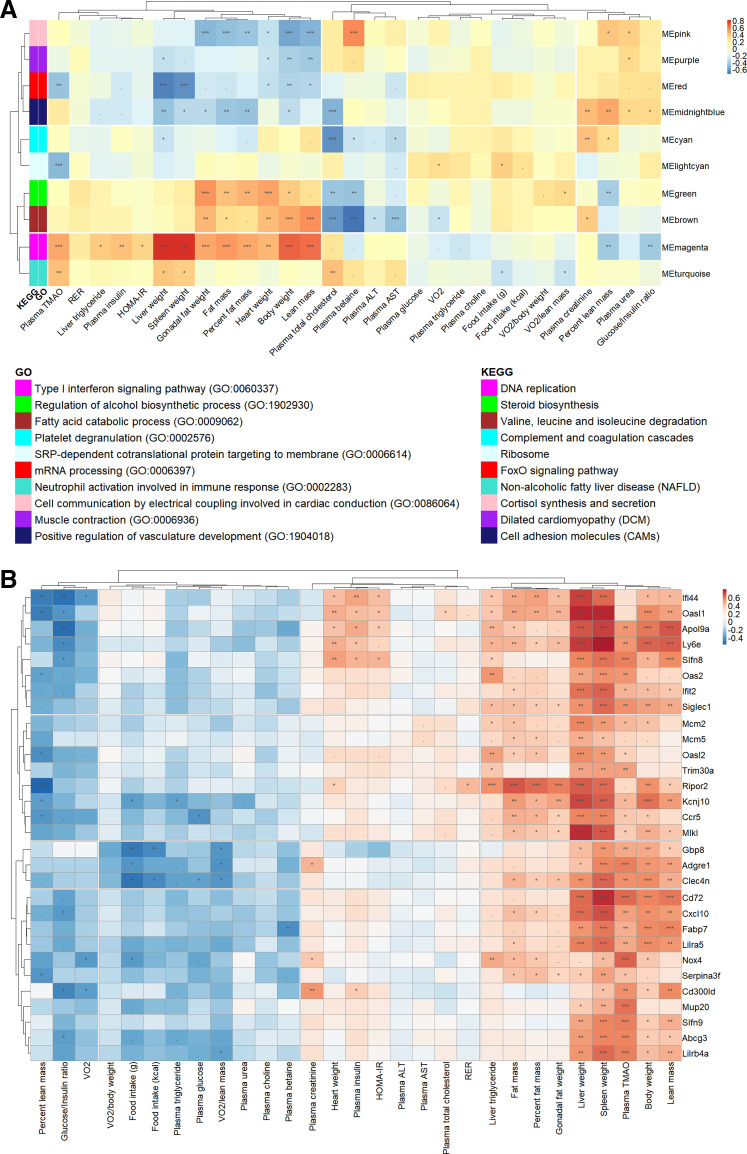
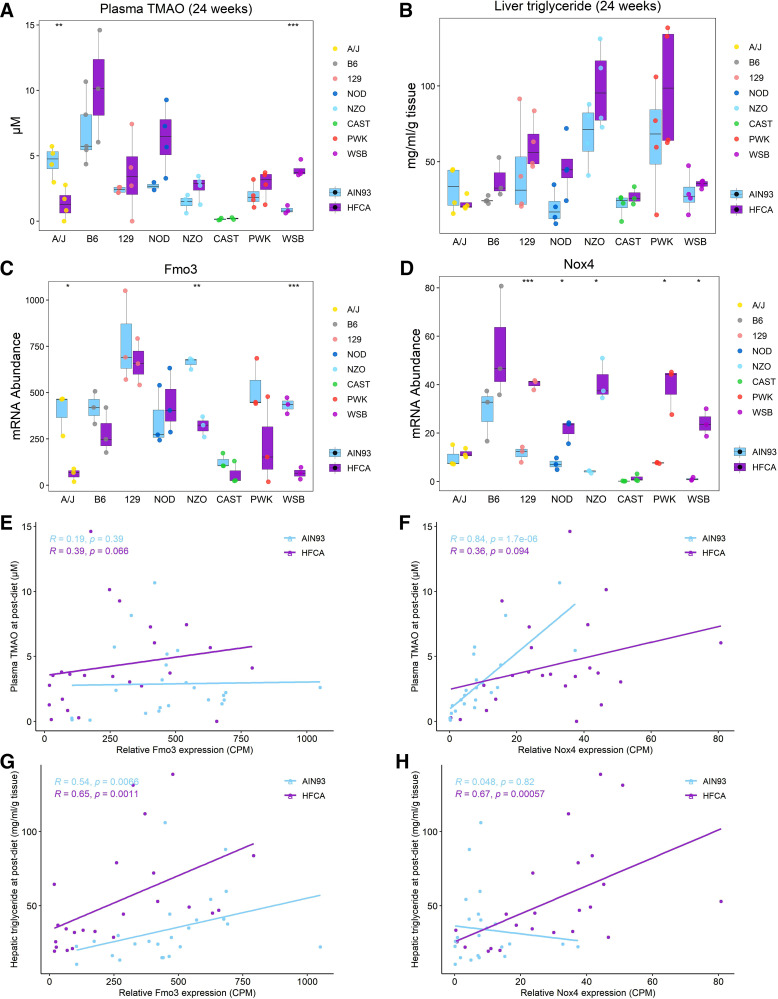
Mice have provided critical mechanistic understandings of clinical traits underlying metabolic syndrome (MetSyn) and susceptibility to MetSyn in mice is known to vary among inbred strains. We investigated the diet- and strain-dependent effects on metabolic traits in the eight Collaborative Cross (CC) founder strains (A/J, C57BL/6J, 129S1/SvImJ, NOD/ShiLtJ, NZO/HILtJ, CAST/EiJ, PWK/PhJ, and WSB/EiJ). Liver transcriptomics analysis showed that both atherogenic diet and host genetics have profound effects on the liver transcriptome, which may be related to differences in metabolic traits observed between strains. We found strain differences in circulating trimethylamine N-oxide (TMAO) concentration and liver triglyceride content, both of which are traits associated with metabolic diseases. Using a network approach, we identified a module of transcripts associated with TMAO and liver triglyceride content, which was enriched in functional pathways. Interrogation of the module related to metabolic traits identified NADPH oxidase 4 (Nox4), a gene for a key enzyme in the production of reactive oxygen species, which showed a strong association with plasma TMAO and liver triglyceride. Interestingly, Nox4 was identified as the highest expressed in the C57BL/6J and NZO/HILtJ strains and the lowest expressed in the CAST/EiJ strain. Based on these results, we suggest that there may be genetic variation in the contribution of Nox4 to the regulation of plasma TMAO and liver triglyceride content. In summary, we show that liver transcriptomic analysis identified diet- or strain-specific pathways for metabolic traits in the Collaborative Cross (CC) founder strains.
Keywords: Collaborative Cross; diet; genetic backgrounds; metabolic syndrome; transcriptomics.
Conflict of interest statement
No conflicts of interest, financial or otherwise, are declared by the authors.
Figures


Similar articles
-
A comprehensive and comparative phenotypic analysis of the collaborative founder strains identifies new and known phenotypes.Mamm Genome. 2020 Feb;31(1-2):30-48. doi: 10.1007/s00335-020-09827-3. Epub 2020 Feb 14. Mamm Genome. 2020. PMID: 32060626 Free PMC article.
-
Influenza H3N2 infection of the collaborative cross founder strains reveals highly divergent host responses and identifies a unique phenotype in CAST/EiJ mice.BMC Genomics. 2016 Feb 27;17:143. doi: 10.1186/s12864-016-2483-y. BMC Genomics. 2016. PMID: 26921172 Free PMC article.
-
Diet-induced obesity in genetically diverse collaborative cross mouse founder strains reveals diverse phenotype response and amelioration by quercetin treatment in 129S1/SvImJ, PWK/EiJ, CAST/PhJ, and WSB/EiJ mice.J Nutr Biochem. 2021 Jan;87:108521. doi: 10.1016/j.jnutbio.2020.108521. Epub 2020 Oct 8. J Nutr Biochem. 2021. PMID: 33039581
-
The Collaborative Cross mouse model for dissecting genetic susceptibility to infectious diseases.Mamm Genome. 2018 Aug;29(7-8):471-487. doi: 10.1007/s00335-018-9768-1. Epub 2018 Aug 24. Mamm Genome. 2018. PMID: 30143822 Review.
-
The Accumulation and Molecular Effects of Trimethylamine N-Oxide on Metabolic Tissues: It's Not All Bad.Nutrients. 2021 Aug 21;13(8):2873. doi: 10.3390/nu13082873. Nutrients. 2021. PMID: 34445033 Free PMC article. Review.
Cited by
-
Perspective: Leveraging the Gut Microbiota to Predict Personalized Responses to Dietary, Prebiotic, and Probiotic Interventions.Adv Nutr. 2022 Oct 2;13(5):1450-1461. doi: 10.1093/advances/nmac075. Adv Nutr. 2022. PMID: 35776947 Free PMC article.
-
Dexamethasone-induced muscle atrophy and bone loss in six genetically diverse collaborative cross founder strains demonstrates phenotypic variability by Rg3 treatment.J Ginseng Res. 2024 May;48(3):310-322. doi: 10.1016/j.jgr.2023.12.004. Epub 2023 Dec 30. J Ginseng Res. 2024. PMID: 38707648 Free PMC article.
-
Nutraceuticals for Gut-Brain Axis Health: A Novel Approach to Combat Malnutrition and Future Personalised Nutraceutical Interventions.Nutrients. 2025 Apr 30;17(9):1551. doi: 10.3390/nu17091551. Nutrients. 2025. PMID: 40362863 Free PMC article. Review.
-
Precision pharmacological reversal of strain-specific diet-induced metabolic syndrome in mice informed by epigenetic and transcriptional regulation.PLoS Genet. 2023 Oct 23;19(10):e1010997. doi: 10.1371/journal.pgen.1010997. eCollection 2023 Oct. PLoS Genet. 2023. PMID: 37871105 Free PMC article.
References
-
- Hamaguchi M, Kojima T, Takeda N, Nakagawa T, Taniguchi H, Fujii K, Omatsu T, Nakajima T, Sarui H, Shimazaki M, Kato T, Okuda J, Ida K. The metabolic syndrome as a predictor of nonalcoholic fatty liver disease. Ann Intern Med 143: 722–728, 2005. doi:10.7326/0003-4819-143-10-200511150-00009. - DOI - PubMed
-
- Chen YM, Liu Y, Zhou RF, Chen XL, Wang C, Tan XY, Wang LJ, Zheng RD, Zhang HW, Ling WH, Zhu HL. Associations of gut-flora-dependent metabolite trimethylamine-N-oxide, betaine and choline with non-alcoholic fatty liver disease in adults. Sci Rep 6: 19076, 2016. doi:10.1038/srep19076. - DOI - PMC - PubMed
Publication types
MeSH terms
Substances
Grants and funding
LinkOut - more resources
Full Text Sources
Other Literature Sources
Molecular Biology Databases
Miscellaneous