

A translational study of somatosensory evoked potential time-frequency components in rats, goats, and humans
- PMID: 33818512
- PMCID: PMC8354111
- DOI: 10.4103/1673-5374.310693
A translational study of somatosensory evoked potential time-frequency components in rats, goats, and humans
Abstract
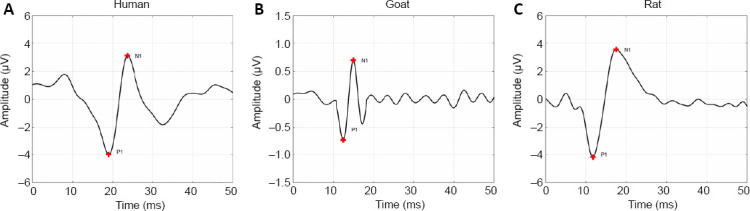
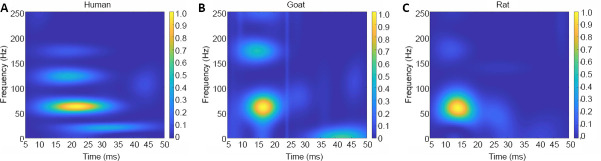
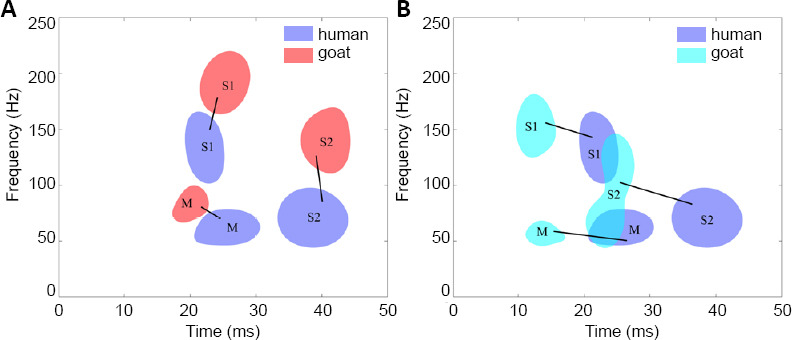
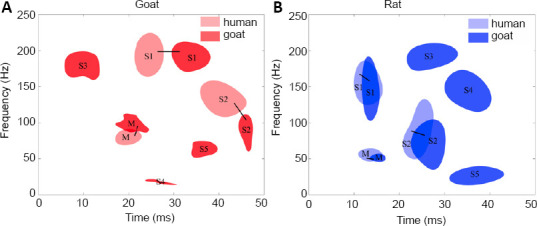
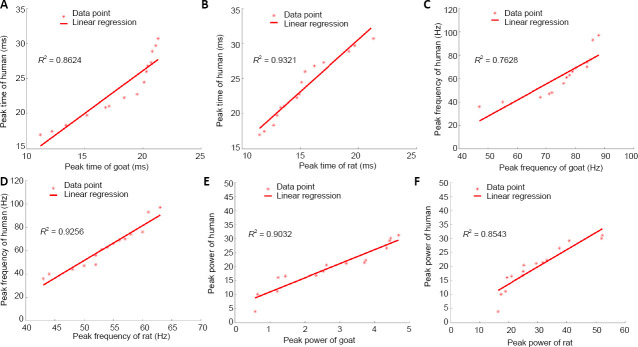
Somatosensory evoked potentials (SEPs) have been widely used to assess neurological function in clinical practice. A good understanding of the association between SEP signals and neurological function is helpful for precise diagnosis of impairment location. Previous studies on SEPs have been reported in animal models. However, few studies have reported the relationships between SEP waveforms in animals and those in humans. In this study, we collected normal SEP waveforms and decomposed them into specific time-frequency components (TFCs). Our results showed three stable TFC distribution regions in intact goats and rats and in humans. After we induced spinal cord injury in the animal models, a greater number of small TFC distribution regions were observed in the injured goat and rat groups than in the normal group. Moreover, there were significant correlations (P < 0.05) and linear relationships between the main SEP TFCs of the human group and those of the goat and rat groups. A stable TFC distribution of SEP components was observed in the human, goat and rat groups, and the TFC distribution modes were similar between the three groups. Results in various animal models in this study could be translated to future clinical studies based on SEP TFC analysis. Human studies were approved by the Institutional Review Board of the University of Hong Kong/Hospital Authority Hong Kong West Cluster (approval No. UM 05-312 T/975) on December 5, 2005. Rat experiments were approved by the Committee on the Use of Live Animals in Teaching and Research of Li Ka Shing Faculty of Medicine of the University of Hong Kong (approval No. CULART 2912-12) on January 28, 2013. Goat experiments were approved by the Animal Ethics Committee of Affiliated Hospital of Guangdong Medical University (approval No. GDY2002132) on March 5, 2018.
Keywords: animal models; chronic compression; latency; somatosensory evoked potentials; spinal cord injury; time– frequency analysis; time–frequency components; translational study.
Conflict of interest statement
None
Figures
Similar articles
-
Different Time-Frequency Distribution Patterns of Somatosensory Evoked Potentials in Dual- and Single-Level Spinal Cord Compression.IEEE Trans Neural Syst Rehabil Eng. 2022;30:1052-1059. doi: 10.1109/TNSRE.2022.3167260. Epub 2022 Apr 25. IEEE Trans Neural Syst Rehabil Eng. 2022. PMID: 35417350
-
Component analysis of somatosensory evoked potentials for identifying spinal cord injury location.Sci Rep. 2017 May 24;7(1):2351. doi: 10.1038/s41598-017-02555-w. Sci Rep. 2017. PMID: 28539587 Free PMC article.
-
Time-frequency patterns of somatosensory evoked potentials in predicting the location of spinal cord injury.Neurosci Lett. 2015 Aug 31;603:37-41. doi: 10.1016/j.neulet.2015.07.002. Epub 2015 Jul 11. Neurosci Lett. 2015. PMID: 26170248
-
Usefulness of Time-Frequency Patterns of Somatosensory Evoked Potentials in Identification of the Location of Spinal Cord Injury.J Clin Neurophysiol. 2015 Aug;32(4):341-5. doi: 10.1097/WNP.0000000000000167. J Clin Neurophysiol. 2015. PMID: 25626775
-
Effects of acupuncture on somatosensory evoked potentials: a review.J Clin Neurophysiol. 1993 Jul;10(3):370-7. doi: 10.1097/00004691-199307000-00011. J Clin Neurophysiol. 1993. PMID: 8408602 Review.
Cited by
-
Identifying Intraoperative Spinal Cord Injury Location from Somatosensory Evoked Potentials' Time-Frequency Components.Bioengineering (Basel). 2023 Jun 11;10(6):707. doi: 10.3390/bioengineering10060707. Bioengineering (Basel). 2023. PMID: 37370638 Free PMC article.
-
NF-κB-Dependent Snail Expression Promotes Epithelial-Mesenchymal Transition in Mastitis.Animals (Basel). 2021 Dec 1;11(12):3422. doi: 10.3390/ani11123422. Animals (Basel). 2021. PMID: 34944199 Free PMC article.
-
Time varying characteristic in somatosensory evoked potentials as a biomarker of spinal cord ischemic-reperfusion injury in rat.Front Neurosci. 2024 Sep 9;18:1411016. doi: 10.3389/fnins.2024.1411016. eCollection 2024. Front Neurosci. 2024. PMID: 39315075 Free PMC article.
-
Chronic spinal cord compression associated with intervertebral disc degeneration in SPARC-null mice.Neural Regen Res. 2023 Mar;18(3):634-642. doi: 10.4103/1673-5374.350210. Neural Regen Res. 2023. PMID: 36018188 Free PMC article.
-
Positive effect of microvascular proliferation on functional recovery in experimental cervical spondylotic myelopathy.Front Neurosci. 2024 Mar 6;18:1254600. doi: 10.3389/fnins.2024.1254600. eCollection 2024. Front Neurosci. 2024. PMID: 38510463 Free PMC article.
References
-
- Allen AR. Surgery of experimental lesion of spinal cord equivalent to crush injury of fracture dislocation of spinal column: a preliminary report. J Am Med Assoc. 1911;LVII:878–880.
-
- Allison T, Hume AL. A comparative analysis of short-latency somatosensory evoked potentials in man, monkey, cat, and rat. Exp Neurol. 1981;72:592–611. - PubMed
-
- Arezzo J, Legatt AD, Vaughan HG., Jr Topography and intracranial sources of somatosensory evoked potentials in the monkey. I Early components. Electroencephalogr Clin Neurophysiol. 1979;46:155–172. - PubMed
-
- Arezzo JC, Vaughan HG, Jr, Legatt AD. Topography and intracranial sources of somatosensory evoked potentials in the monkey. II Cortical components. Electroencephalogr Clin Neurophysiol. 1981;51:1–18. - PubMed
-
- Basso DM, Beattie MS, Bresnahan JC. A sensitive and reliable locomotor rating scale for open field testing in rats. J Neurotrauma. 1995;12:1–21. - PubMed
LinkOut - more resources
Full Text Sources
Other Literature Sources
