

Cell-type specific analysis of physiological action of estrogen in mouse oviducts
- PMID: 33818810
- PMCID: PMC8189321
- DOI: 10.1096/fj.202002747R
Cell-type specific analysis of physiological action of estrogen in mouse oviducts
Abstract
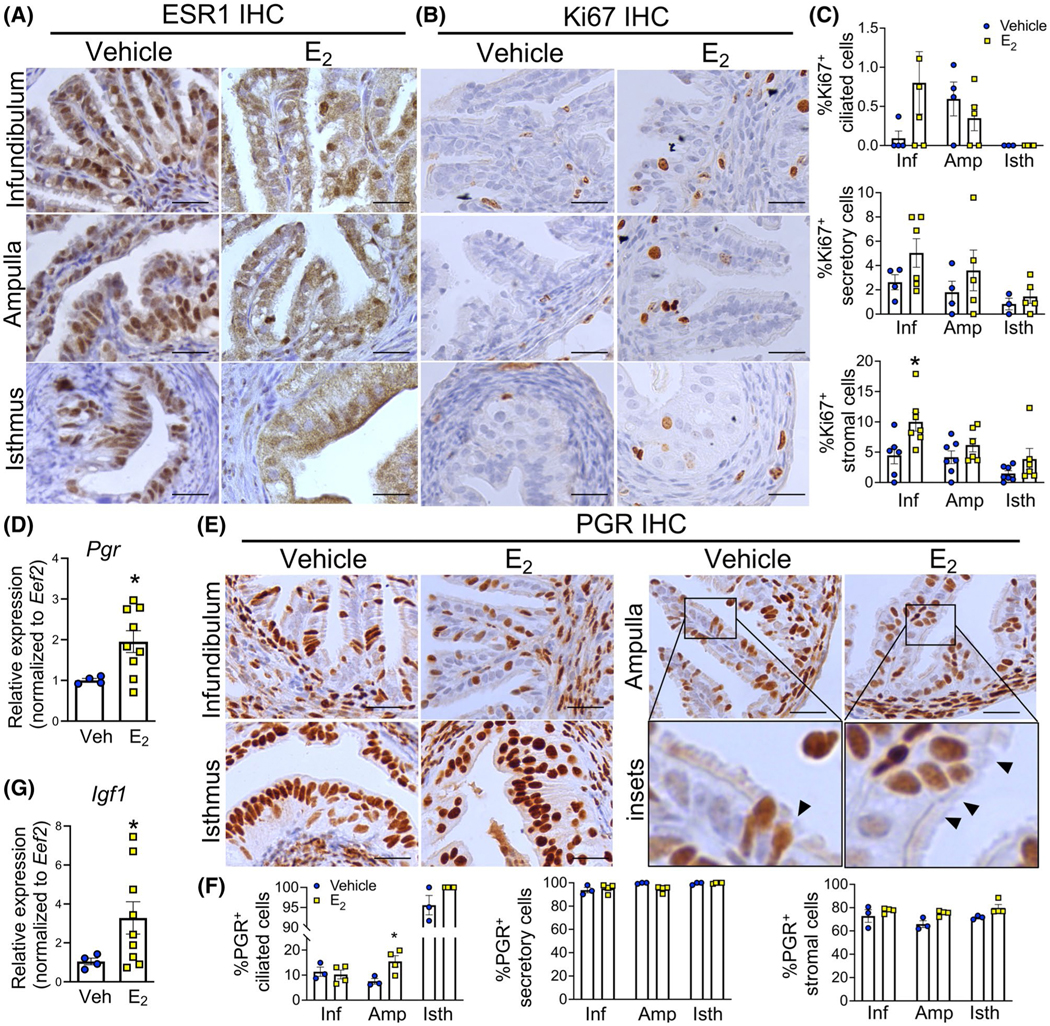
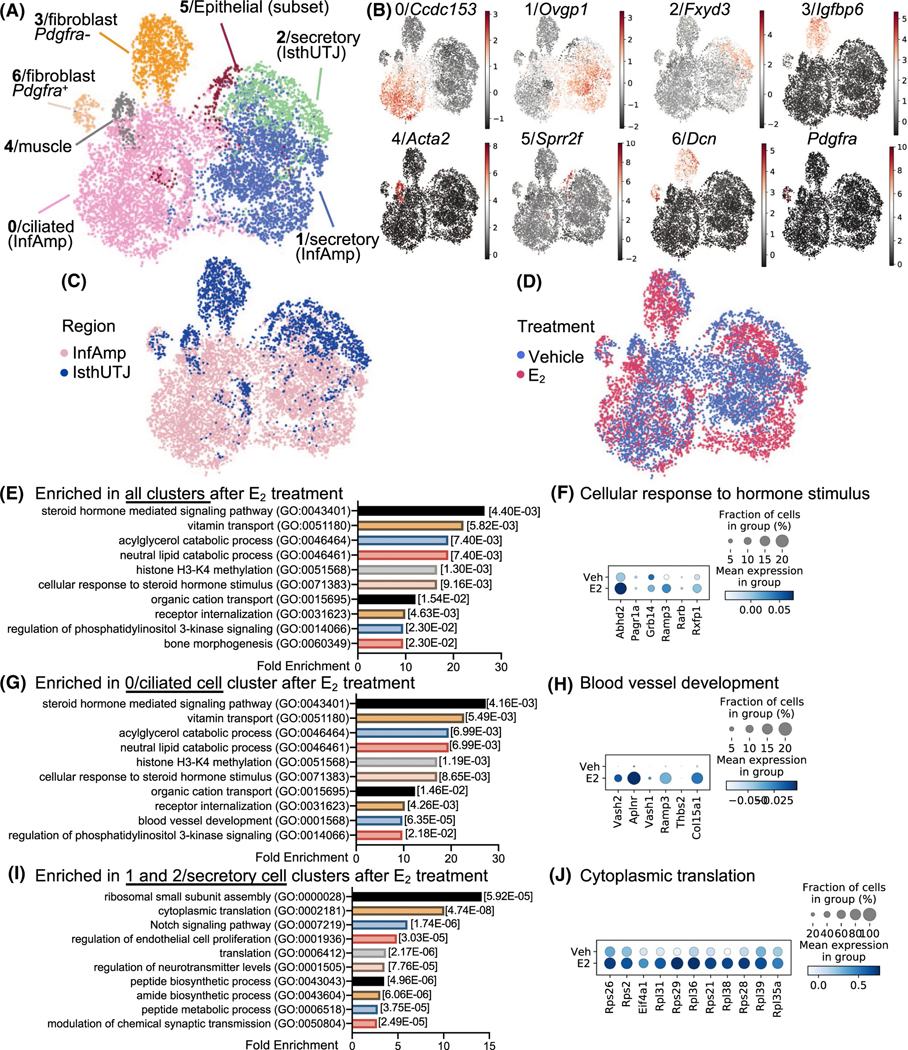
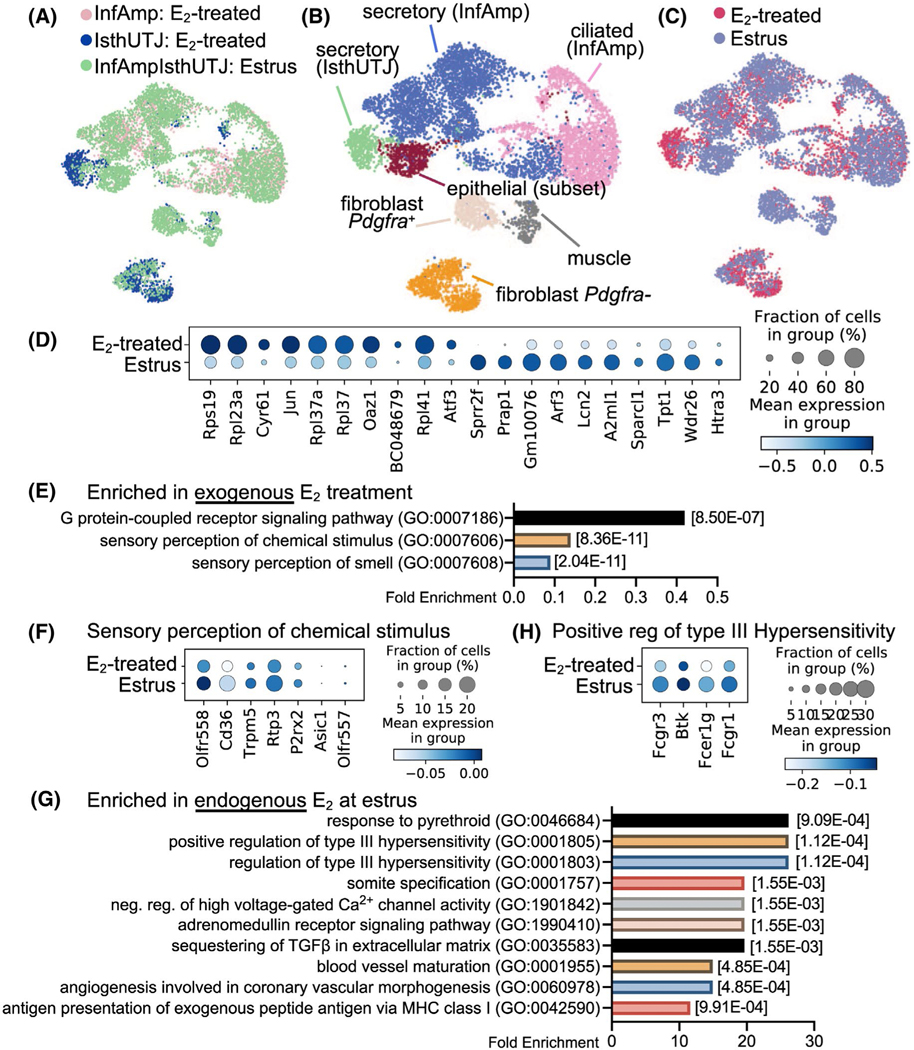
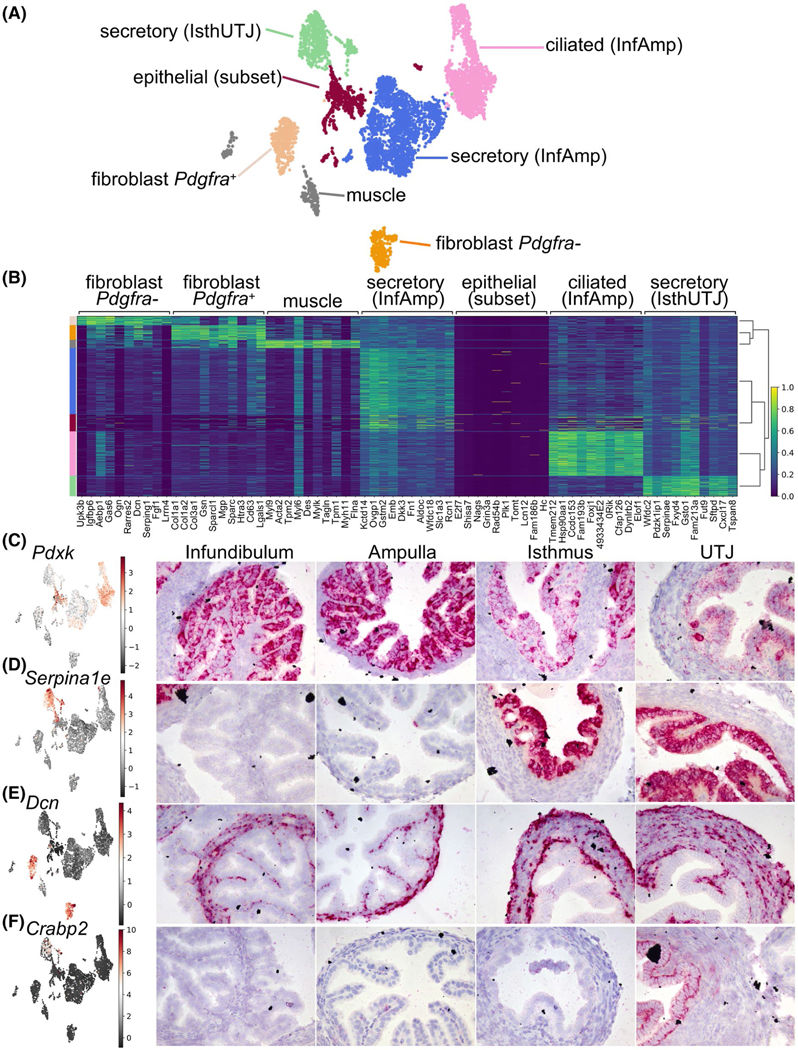
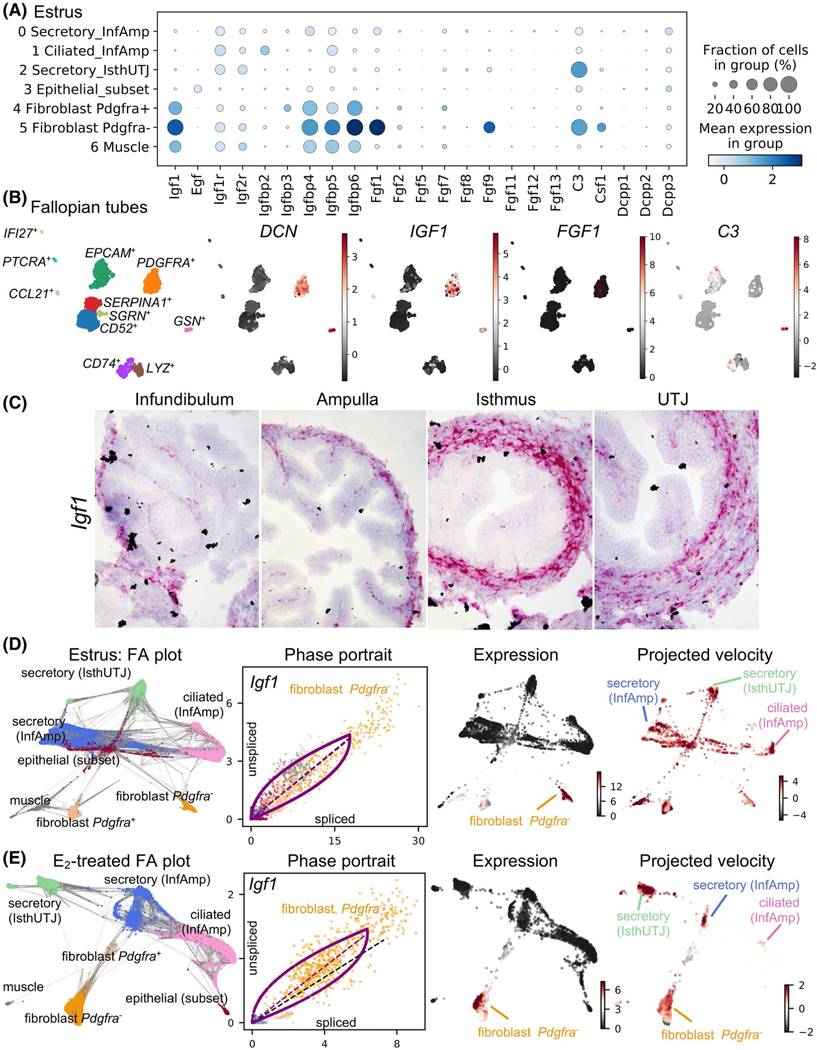
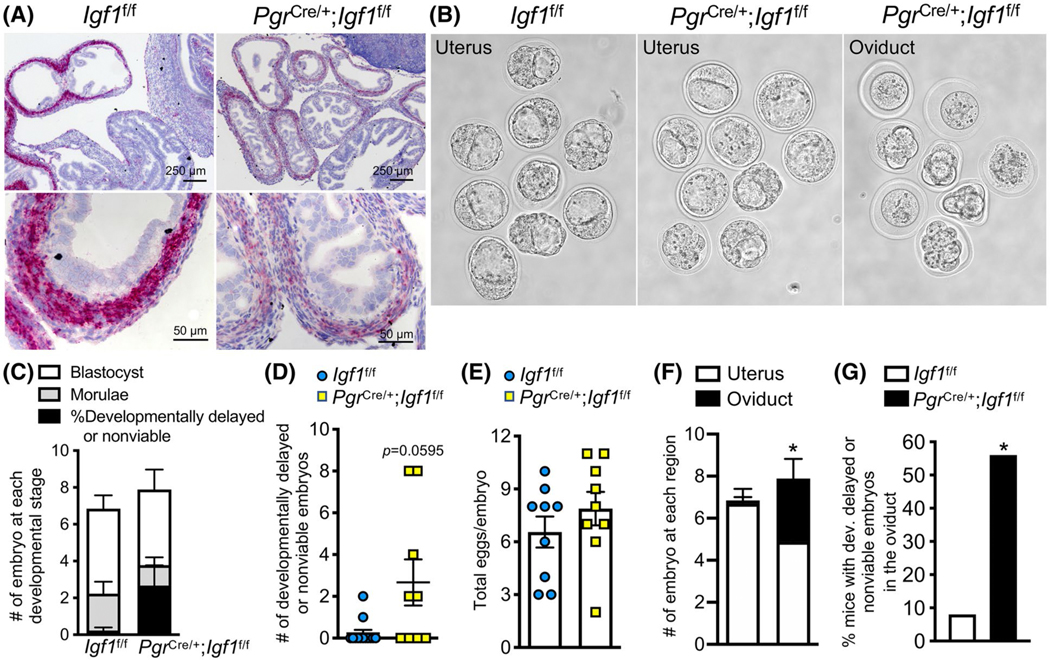
One of the endogenous estrogens, 17β-estradiol (E2 ) is a female steroid hormone secreted from the ovary. It is well established that E2 causes biochemical and histological changes in the uterus. However, it is not completely understood how E2 regulates the oviductal environment in vivo. In this study, we assessed the effect of E2 on each oviductal cell type, using an ovariectomized-hormone-replacement mouse model, single-cell RNA-sequencing (scRNA-seq), in situ hybridization, and cell-type-specific deletion in mice. We found that each cell type in the oviduct responded to E2 distinctively, especially ciliated and secretory epithelial cells. The treatment of exogenous E2 did not drastically alter the transcriptomic profile from that of endogenous E2 produced during estrus. Moreover, we have identified and validated genes of interest in our datasets that may be used as cell- and region-specific markers in the oviduct. Insulin-like growth factor 1 (Igf1) was characterized as an E2 -target gene in the mouse oviduct and was also expressed in human fallopian tubes. Deletion of Igf1 in progesterone receptor (Pgr)-expressing cells resulted in female subfertility, partially due to an embryo developmental defect and embryo retention within the oviduct. In summary, we have shown that oviductal cell types, including epithelial, stromal, and muscle cells, are differentially regulated by E2 and support gene expression changes, such as growth factors that are required for normal embryo development and transport in mouse models. Furthermore, we have identified cell-specific and region-specific gene markers for targeted studies and functional analysis in vivo.
Keywords: embryo development; embryo transport; estrogen; insulin-like growth factor 1; oviduct; scRNA-seq.
© 2021 Federation of American Societies for Experimental Biology.
Conflict of interest statement
CONFLICT OF INTEREST
The authors have stated explicitly that there are no conflicts of interest in connection with this article.
Figures
Similar articles
-
Local sex steroid hormone milieu in the bovine oviduct ipsilateral and contralateral to preovulatory follicle or corpus luteum during the periovulatory phase.Domest Anim Endocrinol. 2021 Jan;74:106515. doi: 10.1016/j.domaniend.2020.106515. Epub 2020 Jun 26. Domest Anim Endocrinol. 2021. PMID: 32711284
-
Classical Estrogen Signaling in Ciliated Epithelial Cells of the Oviduct Is Nonessential for Fertility in Female Mice.Endocrinology. 2023 Nov 20;165(1):bqad163. doi: 10.1210/endocr/bqad163. Endocrinology. 2023. PMID: 37942801 Free PMC article.
-
RU 486 action after estrogen priming in the endometrium and oviducts of rhesus monkeys (Macaca mulatta).J Clin Endocrinol Metab. 1994 Feb;78(2):440-8. doi: 10.1210/jcem.78.2.8106633. J Clin Endocrinol Metab. 1994. PMID: 8106633
-
Oviduct: roles in fertilization and early embryo development.J Endocrinol. 2017 Jan;232(1):R1-R26. doi: 10.1530/JOE-16-0302. J Endocrinol. 2017. PMID: 27875265 Review.
-
Physiological Action of Progesterone in the Nonhuman Primate Oviduct.Cells. 2022 May 3;11(9):1534. doi: 10.3390/cells11091534. Cells. 2022. PMID: 35563839 Free PMC article. Review.
Cited by
-
Decoding Müllerian Duct Epithelial Regionalization.Mol Reprod Dev. 2025 Feb;92(2):e70018. doi: 10.1002/mrd.70018. Mol Reprod Dev. 2025. PMID: 39994938 Free PMC article. Review.
-
Spatial transcriptomic profiles of mouse uterine microenvironments at pregnancy day 7.5†.Biol Reprod. 2022 Aug 9;107(2):529-545. doi: 10.1093/biolre/ioac061. Biol Reprod. 2022. PMID: 35357464 Free PMC article.
-
Multi-omics analyses and machine learning prediction of oviductal responses in the presence of gametes and embryos.bioRxiv [Preprint]. 2024 Nov 25:2024.06.13.598905. doi: 10.1101/2024.06.13.598905. bioRxiv. 2024. Update in: Elife. 2025 Feb 26;13:RP100705. doi: 10.7554/eLife.100705. PMID: 38915688 Free PMC article. Updated. Preprint.
-
FOXA1 expression and its association with mucin expression and KRAS mutation in ovarian mucinous tumors: implications for tumor progression and differentiation.Virchows Arch. 2025 Jan 17. doi: 10.1007/s00428-025-04025-5. Online ahead of print. Virchows Arch. 2025. PMID: 39992437
-
Loss of progesterone receptor in smooth muscle cells has no impact on oviductal contractions and preimplantation embryo development†.Biol Reprod. 2025 May 13;112(5):786-788. doi: 10.1093/biolre/ioaf042. Biol Reprod. 2025. PMID: 40057972 No abstract available.
References
-
- Li S, Winuthayanon W. Oviduct: roles in fertilization and early embryo development. J Endocrinol. 2017;232(1):R1–R26. - PubMed
-
- Stewart CA, Behringer RR. Mouse oviduct development. Results Probl Cell Differ. 2012;55:247–262. - PubMed
-
- Niwa S, Nakajima K, Miki H, Minato Y, Wang D, Hirokawa N. KIF19A is a microtubule-depolymerizing kinesin for ciliary length control. Dev Cell. 2012;23(6):1167–1175. - PubMed
-
- Ozmen B, Diedrich K, Al-Hasani S. Hydrosalpinx and IVF: assessment of treatments implemented prior to IVF. Reprod BioMed Online. 2007;14(2):235–241. - PubMed
MeSH terms
Substances
Grants and funding
LinkOut - more resources
Full Text Sources
Other Literature Sources
Molecular Biology Databases
Research Materials
Miscellaneous
