

Mass-tag barcoding for multiplexed analysis of human synaptosomes and other anuclear events
- PMID: 33818911
- PMCID: PMC8590852
- DOI: 10.1002/cyto.a.24340
Mass-tag barcoding for multiplexed analysis of human synaptosomes and other anuclear events
Abstract
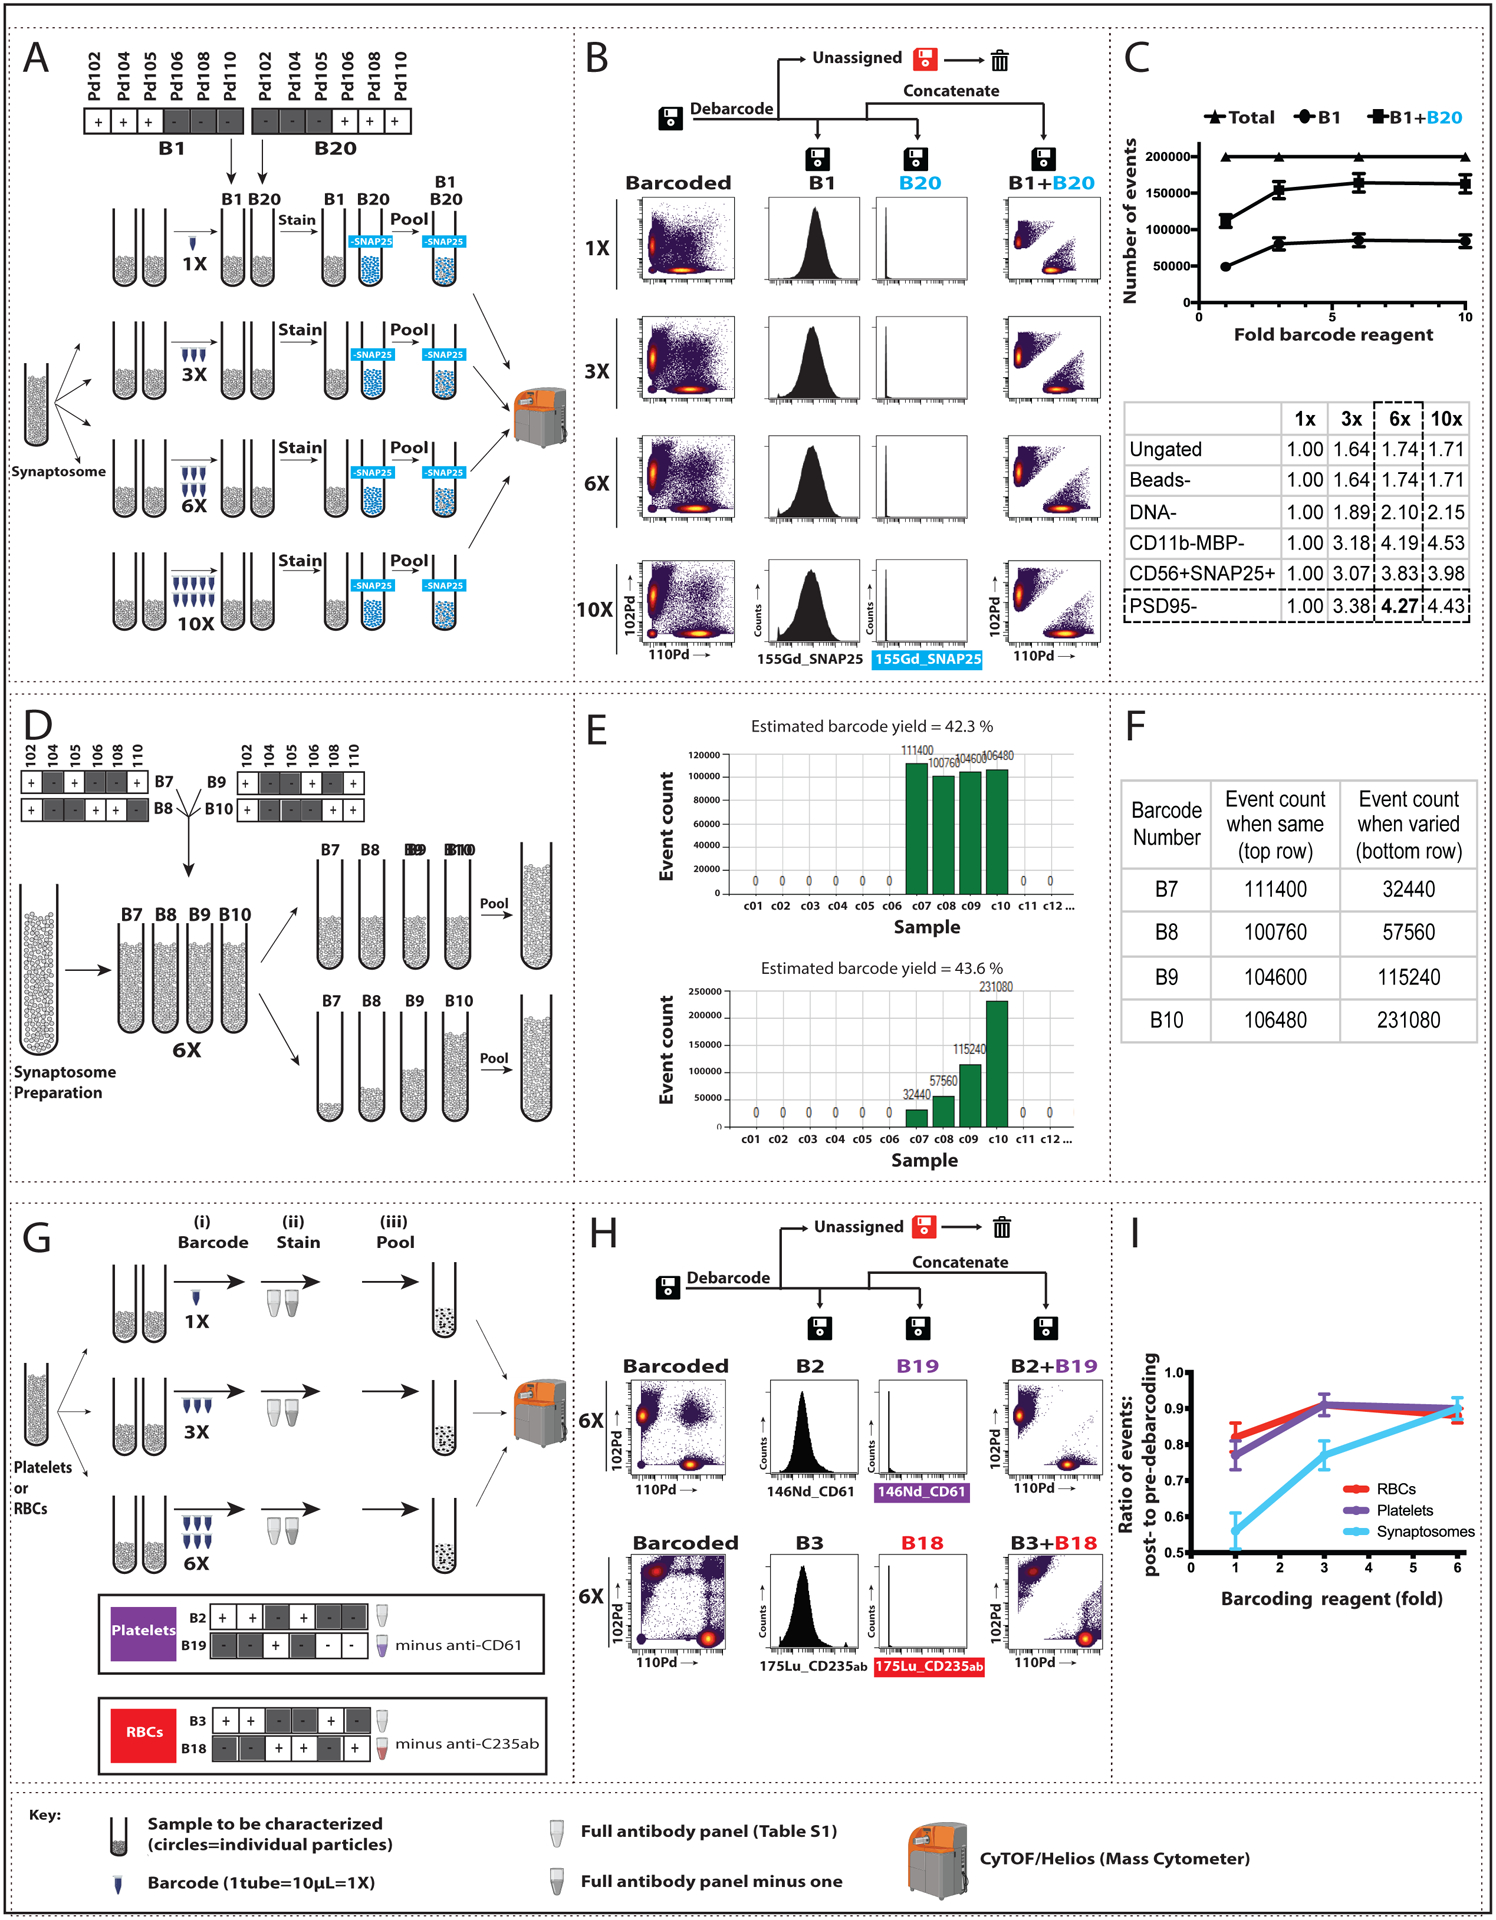
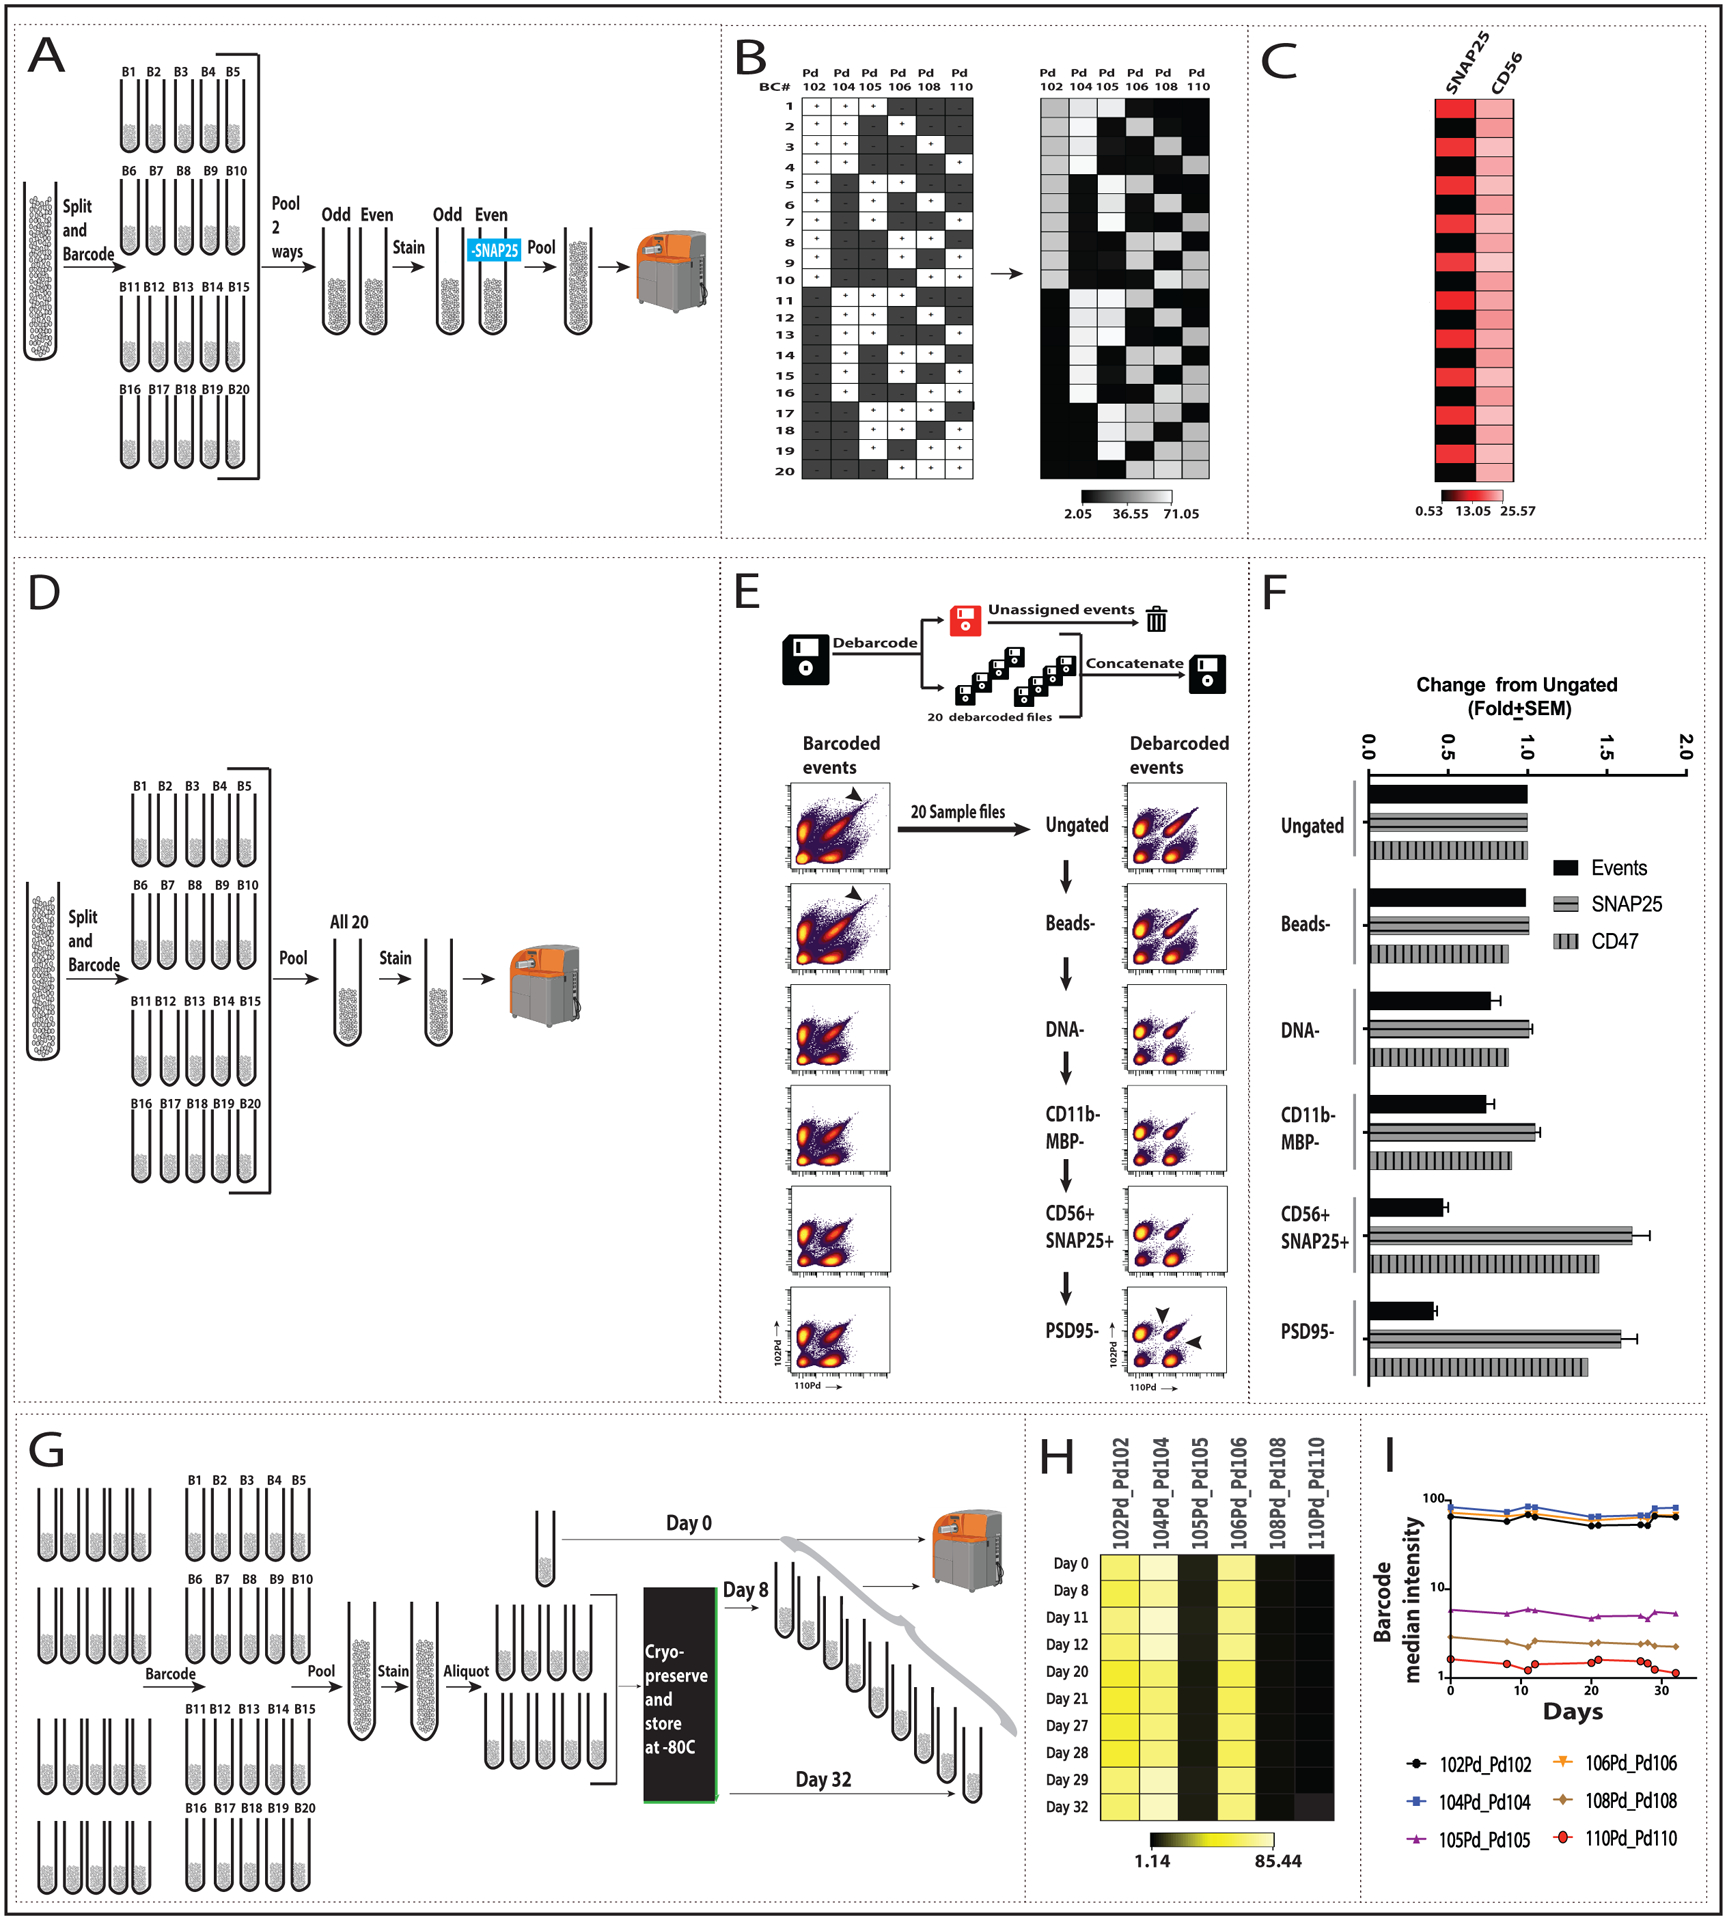
Mass-tag cell barcoding has increased the throughput, multiplexing, and robustness of multiple cytometry approaches. Previously, we adapted mass cytometry for cells to analyze synaptosome preparations (mass synaptometry or SynTOF), extending mass cytometry to these smaller, anuclear particles. To improve throughput and individual event resolution, we report here the application of palladium-based barcoding in human synaptosomes. Up to 20 individual samples, each with a unique combinatorial barcode, were pooled for labeling with an antibody cocktail. Our synaptosome protocol used six palladium-based barcoding reagents, and in combination with sequential gating increased the identification of presynaptic events approximately fourfold. These same parameters also efficiently resolved two other anuclear particles: human red blood cells and platelets. The addition of palladium-based mass-tag barcoding to our approach improves mass cytometry of synaptic particles.
Keywords: CyTOF; SynTOF; barcoding; mass cytometry; platelet; red blood cell; synaptosome.
© 2021 International Society for Advancement of Cytometry.
Figures
Similar articles
-
Mass Synaptometry: Applying Mass Cytometry to Single Synapse Analysis.Methods Mol Biol. 2022;2417:69-88. doi: 10.1007/978-1-0716-1916-2_6. Methods Mol Biol. 2022. PMID: 35099792 Free PMC article.
-
Mass synaptometry: High-dimensional multi parametric assay for single synapses.J Neurosci Methods. 2019 Jan 15;312:73-83. doi: 10.1016/j.jneumeth.2018.11.008. Epub 2018 Nov 20. J Neurosci Methods. 2019. PMID: 30465796 Free PMC article.
-
Surface Barcoding of Live PBMC for Multiplexed Mass Cytometry.Methods Mol Biol. 2019;1989:93-108. doi: 10.1007/978-1-4939-9454-0_7. Methods Mol Biol. 2019. PMID: 31077101
-
Mass cytometry: a highly multiplexed single-cell technology for advancing drug development.Drug Metab Dispos. 2015 Feb;43(2):227-33. doi: 10.1124/dmd.114.060798. Epub 2014 Oct 27. Drug Metab Dispos. 2015. PMID: 25349123 Review.
-
Minimizing Batch Effects in Mass Cytometry Data.Front Immunol. 2019 Oct 15;10:2367. doi: 10.3389/fimmu.2019.02367. eCollection 2019. Front Immunol. 2019. PMID: 31681275 Free PMC article. Review.
Cited by
-
Influenza A Virus (H1N1) Infection Induces Microglial Activation and Temporal Dysbalance in Glutamatergic Synaptic Transmission.mBio. 2021 Oct 26;12(5):e0177621. doi: 10.1128/mBio.01776-21. Epub 2021 Oct 26. mBio. 2021. PMID: 34700379 Free PMC article.
-
Single-synapse analyses of Alzheimer's disease implicate pathologic tau, DJ1, CD47, and ApoE.Sci Adv. 2021 Dec 17;7(51):eabk0473. doi: 10.1126/sciadv.abk0473. Epub 2021 Dec 15. Sci Adv. 2021. PMID: 34910503 Free PMC article.
-
Biophysical Modeling of Dopaminergic Denervation Landscapes in the Striatum Reveals New Therapeutic Strategy.eNeuro. 2022 Mar 3;9(2):ENEURO.0458-21.2022. doi: 10.1523/ENEURO.0458-21.2022. Print 2022 Mar-Apr. eNeuro. 2022. PMID: 35165198 Free PMC article.
-
Cognitive Performance is Associated with Altered Cerebral Hemodynamics Assessed by Transcranial Ultrasound in Parkinson's Disease.Neuropsychiatr Dis Treat. 2022 Jul 12;18:1421-1431. doi: 10.2147/NDT.S358150. eCollection 2022. Neuropsychiatr Dis Treat. 2022. PMID: 35855751 Free PMC article.
-
Mediterranean vs. Western diet effects on the primate cerebral cortical pre-synaptic proteome: Relationships with the transcriptome and multi-system phenotypes.Alzheimers Dement. 2025 Mar;21(3):e70041. doi: 10.1002/alz.70041. Alzheimers Dement. 2025. PMID: 40109017 Free PMC article.
References
-
- Arold Stephen, Sullivan Patrick, Bilousova Tina, Teng Edmond, Miller Carol A., Poon Wayne W., Vinters Harry V., et al. 2012. “Apolipoprotein E Level and Cholesterol Are Associated with Reduced Synaptic Amyloid Beta in Alzheimer’s Disease and apoE TR Mouse Cortex.” Acta Neuropathologica 123 (1): 39–52. - PMC - PubMed
-
- Blair Thomas A., and Frelinger Andrew L. 3rd. 2020. “Platelet Surface Marker Analysis by Mass Cytometry.” Platelets 31 (5): 633–40. - PubMed
-
- Burgstaler Edwin A. 2006. “Blood Component Collection by Apheresis.” Journal of Clinical Apheresis 21 (2):142–51. - PubMed
-
- Gajera Chandresh R., Fernandez Rosemary, Postupna Nadia, Montine Kathleen S., Fox Edward J., Tebaykin Dmitry, Angelo Michael, Bendall Sean C., Keene C. Dirk, and Montine Thomas J.. 2019. “Mass Synaptometry: High-Dimensional Multi Parametric Assay for Single Synapses.” Journal of Neuroscience Methods 312 (January): 73–83. - PMC - PubMed
Publication types
MeSH terms
Substances
Grants and funding
LinkOut - more resources
Full Text Sources
Other Literature Sources
