

Enhanced IL-6 and IL-12B Gene Expression After SARS-CoV-2 Infection in Leprosy Patients May Increase the Risk of Neural Damage
- PMID: 33819170
- PMCID: PMC8176471
- DOI: 10.4269/ajtmh.21-0034
Enhanced IL-6 and IL-12B Gene Expression After SARS-CoV-2 Infection in Leprosy Patients May Increase the Risk of Neural Damage
Abstract
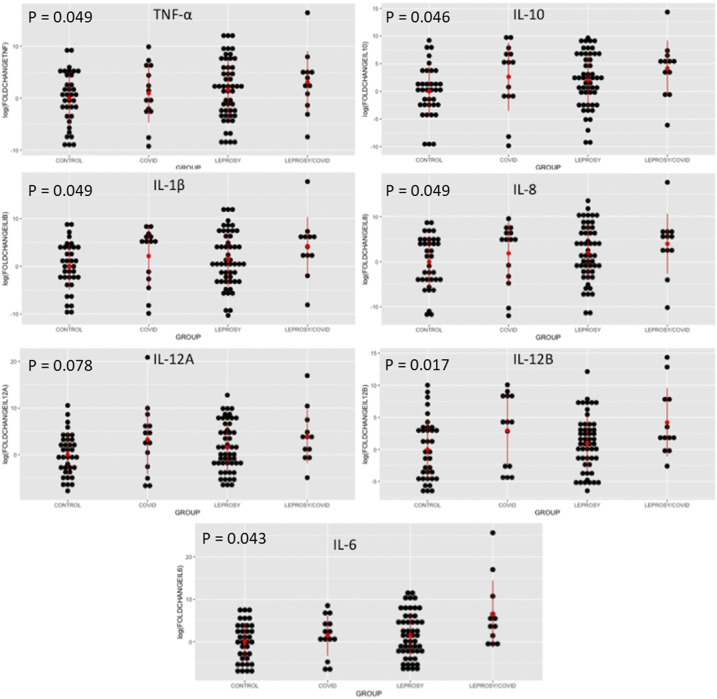
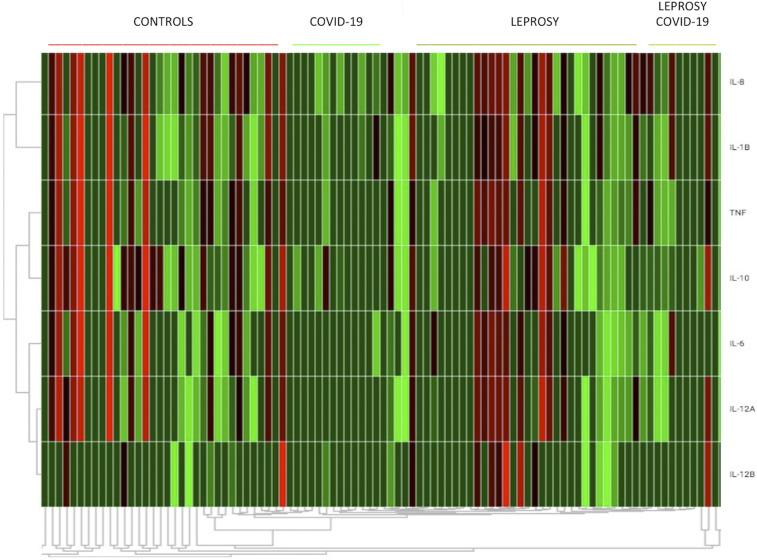
Experts have called attention to the possible negative impact of the coronavirus disease 2019 (COVID-19)-related cytokine storm syndrome on the progression of leprosy-related disabilities. We assessed the frequency of reactional states in patients co-infected with Mycobacterium leprae and severe acute respiratory syndrome (SARS) coronavirus (CoV) 2 (SARS-CoV-2). We consecutively included patients during the first peak of the COVID-19 epidemic in Brazil and analyzed the expressions of genes encoding interleukin (IL)-1β, IL-6, IL-8, IL-10, IL-12A, IL-12B, and tumor necrosis factor-α in peripheral blood mononuclear cells. We included 64 leprosy patients and 50 controls. Twelve of the leprosy patients and 14 of the controls had been diagnosed with COVID-19. Co-infection was associated with increased IL-6 (P = 0.043) and IL-12B (P = 0.017) expression. The median disability grades were higher for leprosy/COVID-19 patients; however, the difference was not significant (P = 0.194). Patients co-infected with M. leprae and SARS-CoV-2 may experience a higher-grade proinflammatory state.
Figures
Similar articles
-
Kynurenines in the Pathogenesis of Peripheral Neuropathy During Leprosy and COVID-19.Front Cell Infect Microbiol. 2022 Feb 24;12:815738. doi: 10.3389/fcimb.2022.815738. eCollection 2022. Front Cell Infect Microbiol. 2022. PMID: 35281455 Free PMC article. Review.
-
Implication of IL-12A, IL-12B, IL-6, and TNF single-nucleotide polymorphisms in severity and susceptibility to COVID-19.Int J Immunopathol Pharmacol. 2024 Jan-Dec;38:3946320241279893. doi: 10.1177/03946320241279893. Int J Immunopathol Pharmacol. 2024. PMID: 39239824 Free PMC article.
-
COVID-19, leprosy, and neutrophils.PLoS Negl Trop Dis. 2021 Jan 7;15(1):e0009019. doi: 10.1371/journal.pntd.0009019. eCollection 2021 Jan. PLoS Negl Trop Dis. 2021. PMID: 33411735 Free PMC article.
-
Expression of interleukin-1β and interleukin-6 in leprosy reactions in patients with human immunodeficiency virus coinfection.Acta Trop. 2017 Aug;172:213-216. doi: 10.1016/j.actatropica.2017.05.010. Epub 2017 May 13. Acta Trop. 2017. PMID: 28511777
-
Tocilizumab in SARS-CoV-2 Patients with the Syndrome of Cytokine Storm: A Narrative Review.Rev Recent Clin Trials. 2021;16(2):138-145. doi: 10.2174/1574887115666200917110954. Rev Recent Clin Trials. 2021. PMID: 32940187 Review.
Cited by
-
Identification of host genomic biomarkers from multiple transcriptomics datasets for diagnosis and therapies of SARS-CoV-2 infections.PLoS One. 2023 Mar 13;18(3):e0281981. doi: 10.1371/journal.pone.0281981. eCollection 2023. PLoS One. 2023. PMID: 36913345 Free PMC article.
-
The influence of leprosy-related clinical and epidemiological variables in the occurrence and severity of COVID-19: A prospective real-world cohort study.PLoS Negl Trop Dis. 2021 Jul 28;15(7):e0009635. doi: 10.1371/journal.pntd.0009635. eCollection 2021 Jul. PLoS Negl Trop Dis. 2021. PMID: 34319982 Free PMC article.
-
Kynurenines in the Pathogenesis of Peripheral Neuropathy During Leprosy and COVID-19.Front Cell Infect Microbiol. 2022 Feb 24;12:815738. doi: 10.3389/fcimb.2022.815738. eCollection 2022. Front Cell Infect Microbiol. 2022. PMID: 35281455 Free PMC article. Review.
-
Case Report: A Case Series of Immunobiological Therapy (Anti-TNF-α) for Patients With Erythema Nodosum Leprosum.Front Med (Lausanne). 2022 Jun 24;9:879527. doi: 10.3389/fmed.2022.879527. eCollection 2022. Front Med (Lausanne). 2022. PMID: 35814767 Free PMC article.
-
Network Pharmacology and Bioinformatics Analysis Identifies Potential Therapeutic Targets of Paxlovid Against LUAD/COVID-19.Front Endocrinol (Lausanne). 2022 Sep 8;13:935906. doi: 10.3389/fendo.2022.935906. eCollection 2022. Front Endocrinol (Lausanne). 2022. PMID: 36157452 Free PMC article.
References
-
- de Souza WM. et al., 2020. Epidemiological and clinical characteristics of the COVID-19 epidemic in Brazil. Nat Hum Behav 4: 856–865. - PubMed
-
- Gurung P, Gomes CM, Vernal S, Leeflang MMG, 2019. Diagnostic accuracy of tests for leprosy: a systematic review and meta-analysis. Clin Microbiol Infect 25: 1315–1327. - PubMed
-
- Shu Kurizky P, dos Santos Neto LL, Barbosa Aires R, Henrique da Mota LM, Martins Gomes C, 2020. Opportunistic tropical infections in immunosuppressed patients. Best Pract Res Clin Rheumatol 34: 101509. - PubMed
-
- World Health Organization , 2018. Guidelines for the diagnosis, treatment and prevention of leprosy. World Health Organization Guidelines 1: 1–87.
Publication types
MeSH terms
Substances
LinkOut - more resources
Full Text Sources
Other Literature Sources
Medical
Miscellaneous
