. 2021 Jul;161(1):301-317.e16.
doi: 10.1053/j.gastro.2021.03.049. Epub 2021 Apr 2.

Epithelia-Sensory Neuron Cross Talk Underlies Cholestatic Itch Induced by Lysophosphatidylcholine

Affiliations

Epithelia-Sensory Neuron Cross Talk Underlies Cholestatic Itch Induced by Lysophosphatidylcholine

Yong Chen et al. Gastroenterology. 2021 Jul.

Abstract

Background & aims: Limited understanding of pruritus mechanisms in cholestatic liver diseases hinders development of antipruritic treatments. Previous studies implicated lysophosphatidic acid (LPA) as a potential mediator of cholestatic pruritus.

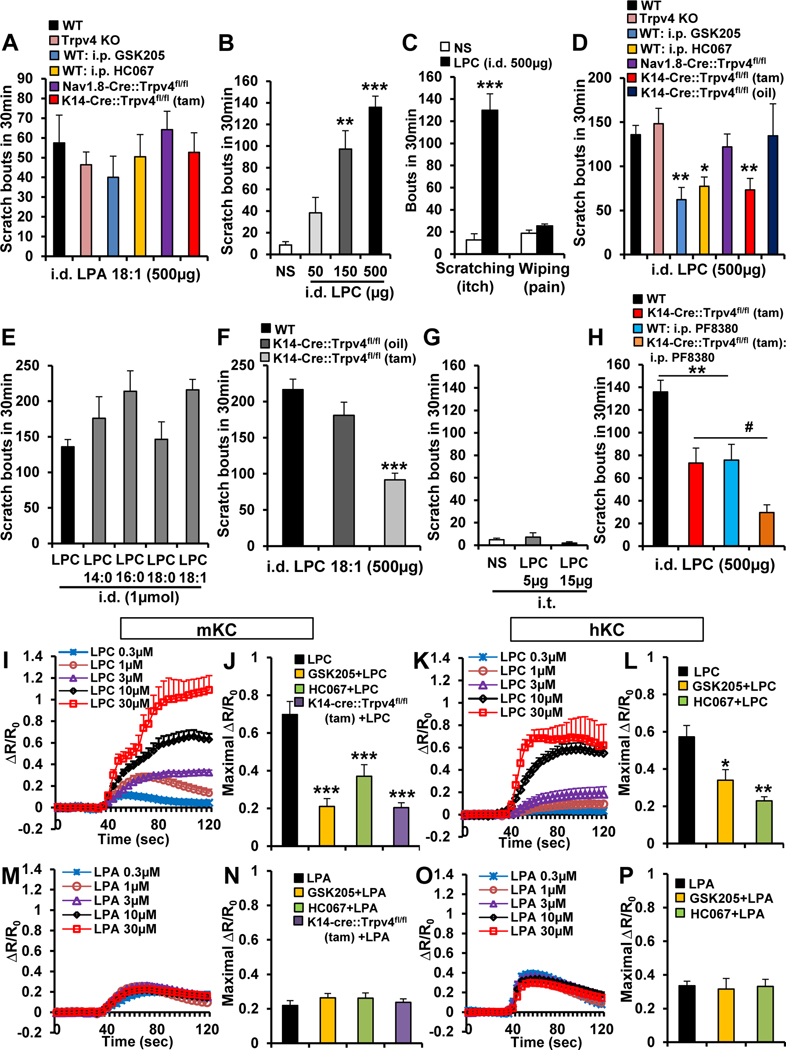
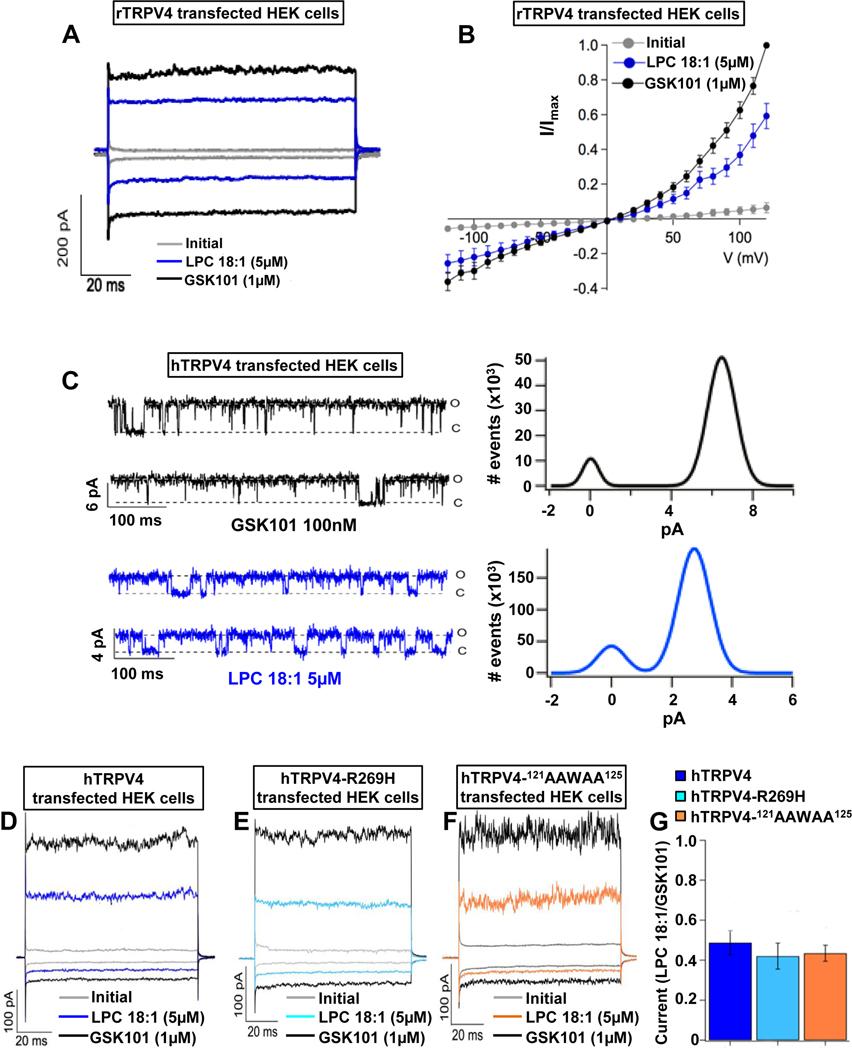
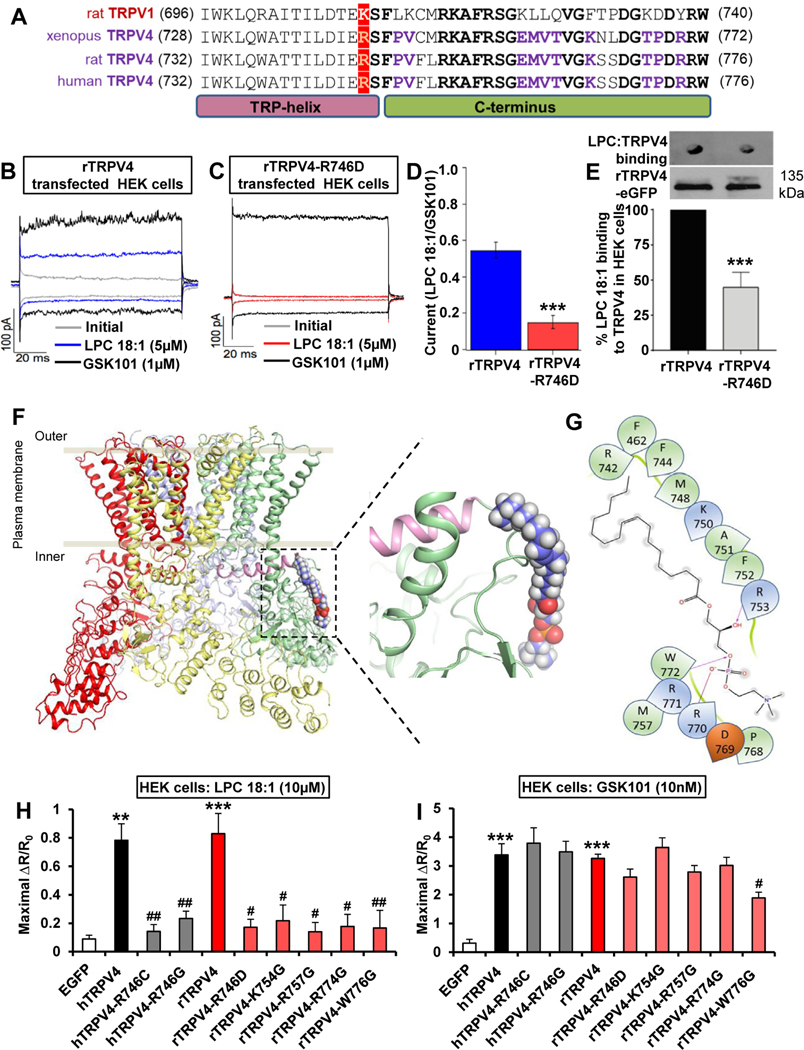
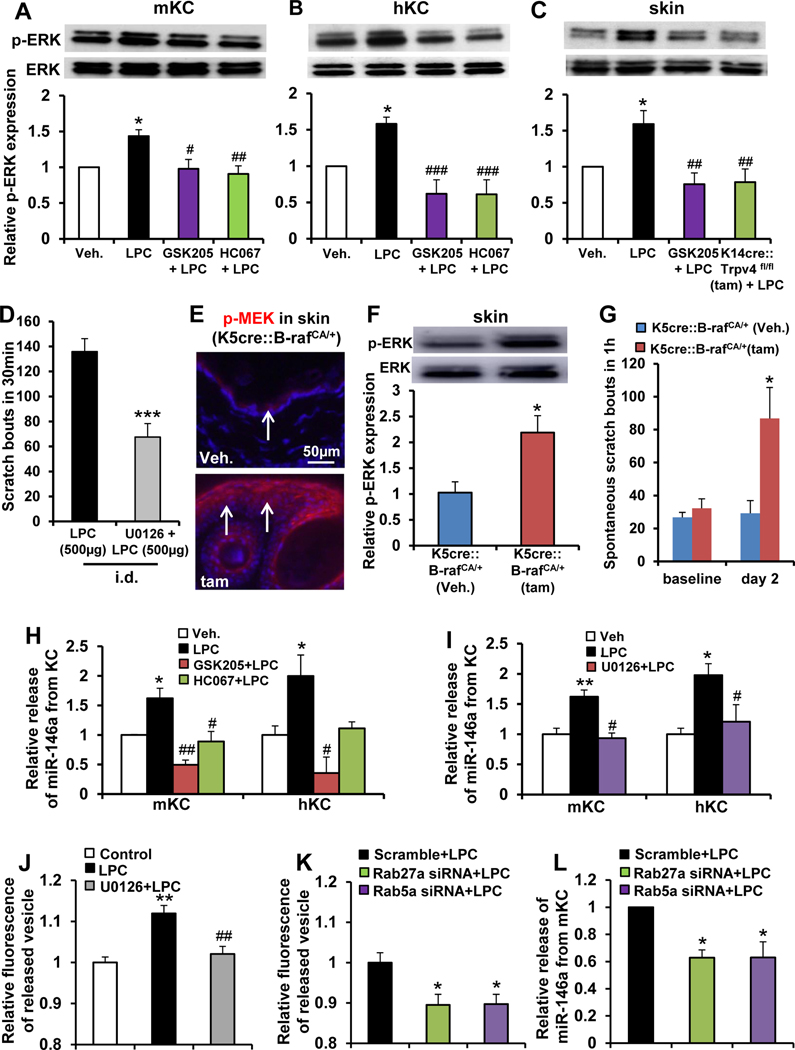
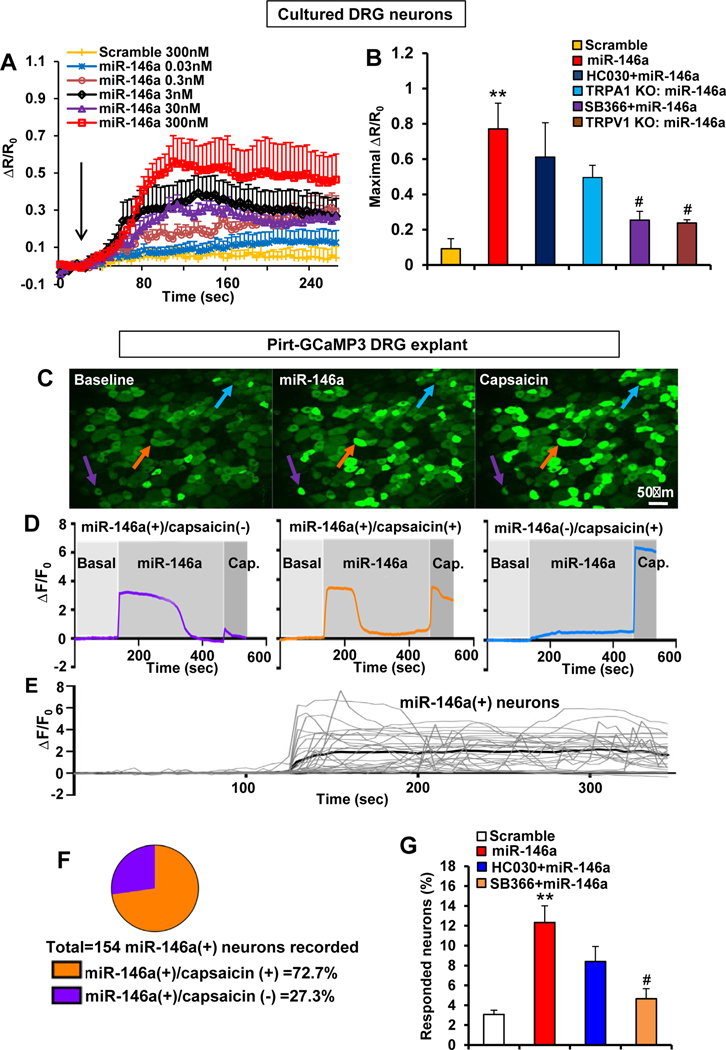
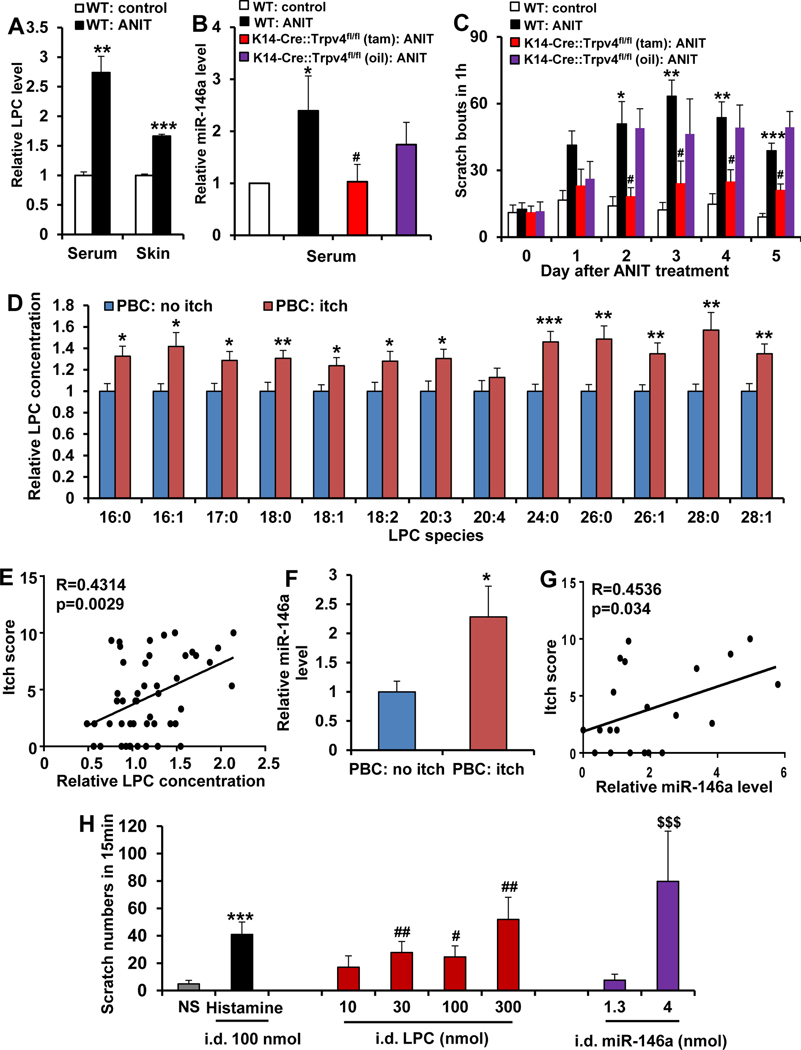
Methods: Pruritogenicity of lysophosphatidylcholine (LPC), LPA's precursor, was examined in naïve mice, cholestatic mice, and nonhuman primates. LPC's pruritogenicity involving keratinocyte TRPV4 was studied using genetic and pharmacologic approaches, cultured keratinocytes, ion channel physiology, and structural computational modeling. Activation of pruriceptor sensory neurons by microRNA-146a (miR-146a), secreted from keratinocytes, was identified by in vitro and ex vivo Ca2+ imaging assays. Sera from patients with primary biliary cholangitis were used for measuring the levels of LPC and miR-146a.

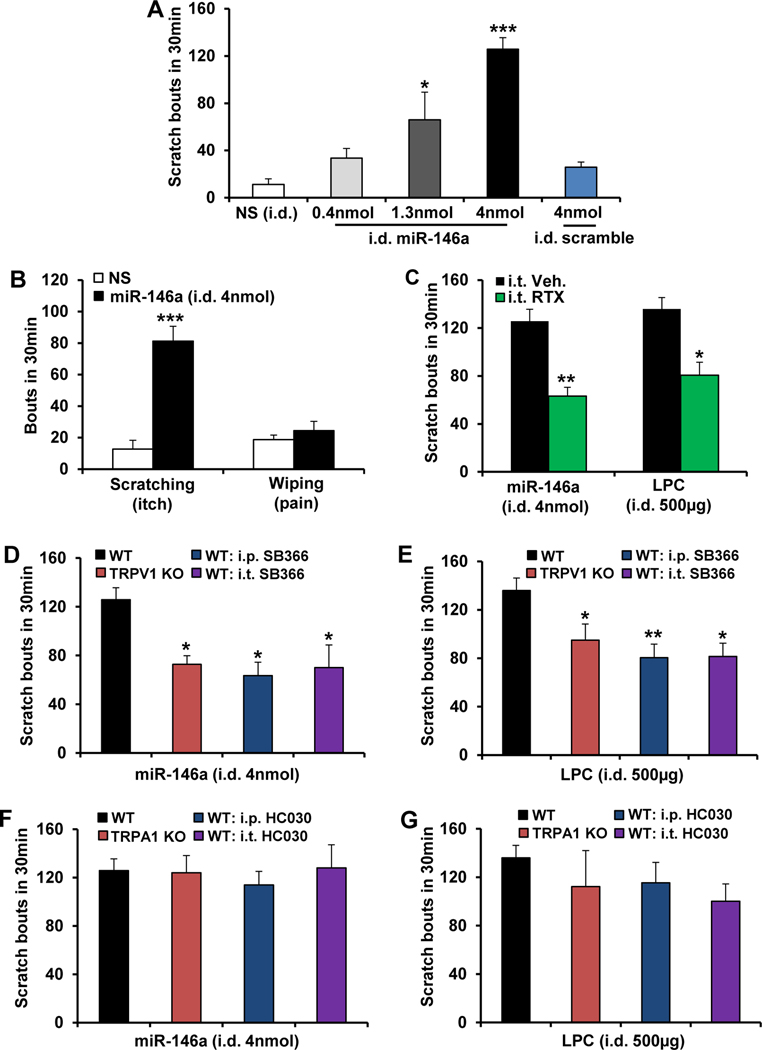
Results: LPC was robustly pruritic in mice. TRPV4 in skin keratinocytes was essential for LPC-induced itch and itch in mice with cholestasis. Three-dimensional structural modeling, site-directed mutagenesis, and channel function analysis suggested a TRPV4 C-terminal motif for LPC binding and channel activation. In keratinocytes, TRPV4 activation by LPC induced extracellular release of miR-146a, which activated TRPV1+ sensory neurons to cause itch. LPC and miR-146a levels were both elevated in sera of patients with primary biliary cholangitis with itch and correlated with itch intensity. Moreover, LPC and miR-146a were also increased in sera of cholestatic mice and elicited itch in nonhuman primates.

Conclusions: We identified LPC as a novel cholestatic pruritogen that induces itch through epithelia-sensory neuron cross talk, whereby it directly activates skin keratinocyte TRPV4, which rapidly releases miR-146a to activate skin-innervating TRPV1+ pruriceptor sensory neurons. Our findings support the new concept of the skin, as a sensory organ, playing a critical role in cholestatic itch, beyond liver, peripheral sensory neurons, and central neural pathways supporting pruriception.

Keywords: Cholestatic Itch; Keratinocyte TRPV4; Lysophosphatidylcholine; TRPV1 Pruriceptor; miR-146a.


Conflict of interest statement

Conflicts of interest

The authors disclose no conflicts.

Figures

Figure 1.
Figure 1.
Scratching behavior induced by LPC, but not LPA, requires Trpv4 in skin keratinocytes. (A) LPA(18:1)-induced itch was not significantly altered in mice: Trpv4 KO, WT intraperitoneally (i.p.) pretreated with TRPV4 inhibitors GSK205 (20 mg/kg) or HC067047 (20 mg/kg), sensory neuron-Trpv4 cKO (Nav1.8-Cre::Trpv4fl/fl), or keratinocyte-Trpv4 cKO (K14-Cre::Trpv4fl/fl, tam-inducible (n = 4–7 mice/group). i.d., intradermal. (B) LPC (egg-LPC) elicited dose-dependent scratching. **P < .01 and ***P < .001 vs normal saline (NS) (n = 5 mice for NS and 50 μg, 6 for 150 μg, and 11 for 500 μg). (C) Note LPC induced robust scratching (itch), not wiping (pain) response in the mouse cheek model. ***P < .001 vs NS (n = 4–5 mice/group). (D) LPC induced itch that was not significantly attenuated in Trpv4 KO mice or in sensory neuron-Trpv4 cKO mice but was significantly reduced in WT mice i.p. pretreated with GSK205 (20 mg/kg) or HC067 (20 mg/kg) and in keratinocyte-Trpv4 cKOs. *P < .05 and **P < .01 vs WT LPC (n = 7–11 mice/group). (E) Different species of LPC also evoked robust scratching, with LPC(18:1) most potent (n = 5 mice/species except n = 11 for LPC). (F) LPC(18:1)-evoked scratching was also significantly reduced in keratinocyte-Trpv4 cKO mice. ***P < .001 vs WT (n = 4–5 mice/group). (G) Intrathecal (i.t.) injection of LPC did not elicit scratching (n = 5 mice/group). (H) LPC-induced itch was attenuated in WT mice by i.p. pretreatment with autotaxin inhibitor PF8380 (10 mg/kg), and this attenuation was further augmented in keratinocyte-Trpv4 cKO mice. **P < .01 and #P < .05 (n = 8–11 mice/group). (I–L) LPC-induced Ca2+ influx in a dose-dependent manner in (I) mouse keratinocytes (mKCs) and (K) human keratinocytes (hKCs). R/R0 indicates the fraction of the increase of the ratio over the baseline ratio divided by baseline ratio. (J and L) LPC-induced Ca2+ influx was significantly reduced by GSK205 or HC067047 (10 μmol/L) and in (J) KC from KCTrpv4 cKO mice. *P < .05, **P < .01 and ***P < .001 vs LPC (n ≥ 180 cells recorded/treatment). (M–P) LPA(18:1)-induced Ca2+ influx was not dose-dependent and was less robust than that of LPC in (M) mouse and (O) human KCs. In addition, LPA (10 μmol/L)-induced Ca2+ signal remained unchanged with (N and P) GSK205 or HC067047 pretreatment (10 μmol/L) or in (N) keratinocytes from keratinocyte-Trpv4 cKO mice (n ≥ 200 cells recorded/treatment). Two-tailed t test for C and 1-way analysis of variance with Tukey’s post hoc test for the rest. The error bars show the standard error of the mean.
Figure 2.
Figure 2.
LPC directly activates TRPV4 channels. (A and B) Representative current-time plots from excised inside-out membrane-patches in rTRPV4-transfected HEK cells. These were obtained initially without agonist (gray), in the presence of LPC(18:1) (blue) or TRPV4 agonist GSK1016790A (GSK101; black). (A) Traces shown were recorded at −60 and +60 mV. (B) Current-voltage relationships from −120 to +120 mV (n = 5 cells/condition). (C) Single-channel recordings (left) of hTRPV4 activated with GSK101 or LPC(18:1) at +60 mV (o, open; c, closed state of TRPV4); all-point histograms were obtained from the traces (right). The average for the open level amplitudes was 6.45 ± 0.55 pA with an open probability of 0.85 ± 0.08 for GSK101 and 3.27 ± 0.41 pA and 0.75 ± 0.08 for LPC(18:1) (n = cells/condition). (D–G) Activation of hTRPV4 by LPC(18:1) remained unchanged with phosphatidylinositol 4,5-bisphosphate interaction mutations. Representative currents for (D) hTRPV4(WT), (E) hTRPV4(R269H), and (F) hTRPV4(121AAWAA125) channels. Currents were obtained initially without agonist (gray), in the presence of LPC(18:1) (blue, sky blue, and orange, respectively) or GSK101 (black) at −60 and +60 mV. (G) There were no significant differences in currents among hTRPV4(WT), hTRPV4(R269H), and hTRPV4(121AAWAA125) in response to LPC(18:1). Data were normalized to activation with GSK101 (n = 5–6 cells/condition) and analyzed by 1-way analysis of variance with Tukey’s post hoc test. The error bars indicate the standard error the mean.
Figure 3.
Figure 3.
LPC activates TRPV4 directly via a C-terminal binding pocket. (A) Sequence alignment of the C-terminus comprising the TRP helix of rTRPV1, Xenopus TRPV4, rTRPV4, and hTRPV4. Note conservation of positive charge at position K710 for TRPV1, R742 for Xenopus TRPV4, and R746 for rTRPV4 and hTRPV4 (in red). Identical residues, shared between TRPV1 and TRPV4, C-terminal of this key residue are bolded in black. Identical residues, conserved only in vertebrate TRPV4, C-terminal to R742/R746 are bolded in purple. (B–E) Representative currents from excised inside-out membrane patches in (B) rTRPV4-transfected HEK cells or (C) rTRPV4(R746D) were obtained without agonist stimulation (gray), in the presence of LPC(18:1) (blue, red) or TRPV4 agonist GSK1016790A (GSK101, black). Traces shown were obtained at −60 and +60 mV. (D) There was a significant current reduction in rTRPV4(R746D)-transfected HEK cells when activated with LPC(18:1). Data were normalized to activation with GSK101. ***P < .001 vs rTRPV4 (n = 5 cells/group). (E) In vitro interaction assays show significantly reduced binding of LPC(18:1) to rTRPV4(R746D). eGFP, enhanced green fluorescent protein. ***P < .001 vs rTRPV4 (n = 3 assays/ group). (F and G) Based on alignment and established TRPV4 structure (crystal, cryo-electron microscopy), derived from Xenopus tropicalis TRPV4, note our structural model that explains binding of LPC(18:1) to a series of positively charged AA750–772; with R742 as a postulated structural determinant of this binding. The left rendering shows the TRPV4 tetramer (each subunit is in a different color) as it integrates into the plasma membrane, with the green subunit binding of LPC(18:1). The right schematic shows binding of LPC(18:1) to the TRPV4 C-terminus at higher resolution. (H and I) The Ca2+ signal induced by LPC(18:1) was drastically reduced in TRPV4-transfected HEK cells (TRPV4 mutations R746C, R746G, R746D, K754G, R757G, R774G, and W776G). In contrast, the GSK101-induced Ca2+ signal was not significantly disrupted, except a moderate reduction with mutation W776G. R/R0, fraction of the increase of the ratio over the baseline ratio divided by baseline ratio. **P < .01 and ***P < .001 vs EGFP, #P < .05 and ##P < .01 vs hTRPV4 or rTRPV4 (n 120 cells recorded/condition). Two-tailed t test for D and E, 1-way analysis of variance with Tukey’s post hoc test for H and I. The error bars indicate the standard error of the mean.
Figure 4.
Figure 4.
LPC elicits extracellular release of miR-146a from skin keratinocytes (KCs) depending on TRPV4→p-ERK→Rab5a/Rab27a signaling. Note LPC-induced increase of p-ERK in (A) cultured mouse KCs (mKCs) and (B) human KCs (hKCs) and its elimination by pretreatment with TRPV4 inhibitors GSK205 and HC067047 (10 μmol/L) *P < .05 vs vehicle (Veh; 0.2% dimethyl sulfoxide); #P < .05 and ##P < .01 vs LPC (n = 4–6 cultures/group; 5–7 pups/culture for mice, 2 patients/culture for humans). (C) Intradermal (i.d.) LPC injection (500 μg/50 μL) increased p-ERK in dissected dorsal neck skin that was reversed by intraperitoneal (IP) pretreatment with GSK205 (20 mg/kg) and in keratinocyte-Trpv4 cKO mice. *P < .05 vs vehicle (Veh., normal saline), ##P < .01 vs LPC (n = 7 mice/group). (D) LPC-induced scratching was significantly attenuated by i.d. pretreatment with MEK-selective inhibitor U0126 (20 μg/50 μL). ***P < .001 vs LPC (n = 11 mice for LPC, n = 6 for U0126 + LPC). (E) Note increased p-MEK expression in dorsal neck skin 2 days after induction of the B-raf transgene by 4-hydroxy tamoxifen treatment (arrows: epidermis; blue: 4′,6-diamidino-2-phenylindole). (F) Western blot revealed increased p-ERK in dorsal neck skin 2 days after induction of the B-raf transgene. **P < .01 vs vehicle (n = 4 mice for vehicle and n = 7 for tamoxifen). (G) Induction of B-raf transgene in skin KC elicited robust scratching on day 2. *P < .05 vs vehicle (n = 5 mice for vehicle and n = 8 for tamoxifen). (H) LPC-induced extracellular release of miR-146a from cultured mouse and human KCs was eliminated by pretreatment with GSK205 or HC067047 (10 μmol/L). *P < .05 vs vehicle, #P < .05 and ##P < .01 vs LPC (n = 3–4 cultures/ treatment; 5–7 pups/culture for mice, 2 patients/culture for humans). (I) LPC-induced extracellular release of miR-146a from cultured mouse and human KCs was eliminated by pretreatment with U0126 (10 μmol/L). *P < .05 vs vehicle, #P < .05 and ##P < .01 vs LPC (n = 3–4 cultures/treatment; 5–7 pups/culture for mice, 2 patients/culture for human). (J) LPC-induced extracellular vesicular release from cultured mouse KC was eliminated by U0126 (10 μmol/L). **P < .01 vs control, ##P < .01 U0126 +LPC vs LPC (n = 4–6 cultures, 5–7 pups/culture). (K) Experimental setup as in J, we detected a significant decrease of LPC-induced vesicular release from mouse KCs treated with Rab27a- small interfering (si)RNA or Rab5a-siRNA (scrambled siRNA control set ‘1’ for relative comparison). *P < .05 vs scramble +LPC (n = 4–6 cultures, 57 pups/culture). (L) Real-time quantitative polymerase chain reaction assay detected a significant decrease of LPC-induced release of miR-146a from mouse KCs by siRNA-mediated knockdown of Rab27a or Rab5a. *P < .05 vs scramble +LPC (n = 4–5 cultures, 5–7 pups/ culture). One-way analysis of variance with Tukey’s post hoc test was used for A–C, G, H–L, and 2-tailed t test for D and F. The error bars show the standard error of the mean.
Figure 5.
Figure 5.
miR-146a elicits scratching behavior, which requires TRPV1, but not TRPA1, in sensory neurons. (A) miR-146a induced dose-dependent scratching behavior, but scramble control did not cause significant scratching behavior. i.d., intradermal. *P < .05 and ***P < .001 vs normal saline (NS) (n = 4–5 mice/group). (B) The mouse cheek model demonstrated that miR-146a elicited robust scratching (itch) but not wiping response (pain). ***P < .001 vs NS (n = 4–5 mice/group). (C) Elimination of TRPV1-expressing spinal nerve terminals using intrathecal (i.t.) injection of resiniferatoxin (RTX, 200 ng/5 μL) significantly reduced miR-146a– or LPC-induced itch. *P < .05 and **P < .01 vs vehicle (Veh, 2% ethanol + 2% Tween 80) (n = 4–5 mice/group except n = 11 for vehicle + LPC). (D and E) miR-146a– and LPC-induced itch were significantly attenuated by intraperitoneal (i.p.) (2 mg/kg) or i.t. (30 μg) injection of the TRPV1 inhibitor SB366791, or in Trpv1 KO. *P < .05 and **P < .01 vs WT (n = 4–5 mice/group for D and n = 6–11 mice/group for E). Itch induced by (F) miR-146a (n = 4–5 mice/group) and (G) LPC (n = 5–11 mice/group) were not significantly altered by i.p. (30 mg/kg) or i.t. (30 μg) injection of the TRPA1-inhibitor HC030031, or in Trpa1 KO. One-way analysis of variance with Tukey’s post hoc test was used for A and D–G, 2-tailed t test for B and C. The error bars show the standard error of the mean.
Figure 6.
Figure 6.
miR-146a activates primary sensory neurons in a TRPV1- but not TRPA1-dependent manner. (A) miR-146a induced Ca2+ influx in cultured DRG neurons (n ≥ 190 neurons recorded/concentration) in a dose-dependent manner (arrow: miR-146a or scramble stimulation). R/R0 is the fraction of the increase of a given ratio over baseline ratio divided by baseline ratio. (B) miR-46a (300 nmol/L) induced Ca2+ influx that was significantly reduced by pretreatment with TRPV1 inhibitor SB366791 (10 μmol/L) and in neurons (n ≥ 190 neurons recorded/concentration) from Trpv1 KO mice but was not significantly altered by TRPA1 inhibitor HC030031 (10 μmol/L) or in neurons from Trpa1 KO mice. R/R0 is the fraction of the increase of the ratio over the baseline ratio divided by baseline ratio **P < .01 vs scramble (300 nmol/L) and #P < .05 vs miR-146a. (C) Representative Ca2+ imaging of GCaMP3-expressing DRG neurons in an ex vivo preparation illustrates the increased Ca2+ signal (arrows; colors matching the Ca2+ transients in D) after stimulation with miR-146a (300 nmol/L) and capsaicin (1 μmol/L). (D) Representative Ca2+ traces of miR-146a(+)/capsaicin(−), miR-146a(+)/capsaicin(−), or miR-146a(−)/capsaicin(+) DRG neurons. F/ F0 is the ratio of fluorescence difference to baseline. (E) Representative Ca2+ traces of a population of DRG neurons responsive to miR-146a. (F) Of 1250 neurons recorded, 154 were responsive to miR-146a, and 72.7% of miR-146a–responsive neurons were also capsaicin responsive. (G) Increased percentage of total DRG neurons responding to miR-146a (300 nmol/L) was significantly reduced by SB366791 (10 mmol/L) but not by HC030031 (10 mmol/L). **P < .01 vs scramble-control (300 nmol/L) and #P < .05 vs miR-146a (n = 4–9 DRG explants/group (1 explant /mouse). One-way analysis of variance with Tukey’s post hoc test was used for B and G. The error bars indicate the standard error of the mean.
Figure 7.
Figure 7.
LPC and miR-146a are elevated in mice or patients with PBC with cholestatic itch and induced itch in nonhuman primates. (A) ANIT treatment increased LPC levels in serum and skin. **P < .01 and ***P < .001 vs WT-control, 2-tailed t test (n = 5–8 mice/group). (B) ANIT treatment increased miR-146a in serum, which was attenuated in keratinocyte-Trpv4 cKO mice. *P < .05 vs WT control, and #P < .05 vs keratinocyte-Trpv4 cKO mice, 1-way analysis of variance with Tukey’s post hoc test (n = 8–11 mice/group). (C) ANIT-induced cholestatic itch was significantly attenuated in keratinocyte-Trpv4 cKO mice. *P < .05, **P < .01, ***P < .001 vs WT control; #P < .05 vs #P < .05 vs keratinocyte-Trpv4 cKO mice, 2-way analysis of variance with Tukey’s post hoc test (n = 6 mice/group). (D) All detected LPC species, except for LPC(20:4), were significantly elevated in sera of patients with PBC with itch (n = 27) vs without itch (n = 21), *P < .05 and **P < .01, 2-tailed t test. (E) When all detected LPC species from individual patients were aggregated, there was a significant correlation of total LPC concentration with the itch intensity. Pearson’s correlation coefficient, R = 0.4314; P =.0029. (F) A significant increase in abundance of miR-146a was detected in sera of patients with PBC with itch (n = 10) vs without itch (n = 12), **P < .01, 2-tailed t test. (G) Note a significant correlation of miR-146a level with the itch intensity. Pearson’s correlation coefficient, R = 0.4536; P = .034. (H) LPC or miR146a induced scratching behavior in rhesus monkeys in a dose-dependent manner. Histamine was used as positive control. i.d., intradermal. ***P < .001, #P < .05, ##P < .01, and $ $ $P < .001 vs normal saline (NS), repeated measures using a linear mixed model (n = 9 monkeys/group). The error bars indicate the standard error of the mean.

References

    1. Dull MM, Kremer AE. Treatment of pruritus secondary to liver disease. Curr Gastroenterol Rep 2019;21:48. - PubMed
    1. Kremer AE, Martens JJ, Kulik W, et al. Lysophosphatidic acid is a potential mediator of cholestatic pruritus. Gastroenterology 2010;139:1008–1018. - PubMed
    1. Lieu T, Jayaweera G, Zhao P, et al. The bile acid receptor TGR5 activates the TRPA1 channel to induce itch in mice. Gastroenterology 2014;147:1417–1428. - PMC - PubMed
    1. Abu-Hayyeh S, Ovadia C, Lieu T, et al. Prognostic and mechanistic potential of progesterone sulfates in intrahepatic cholestasis of pregnancy and pruritus gravidarum. Hepatology 2016;63:1287–1298. - PMC - PubMed
    1. Meixiong J, Vasavda C, Snyder SH, et al. MRGPRX4 is a G protein-coupled receptor activated by bile acids that may contribute to cholestatic pruritus. Proc Natl Acad Sci U S A 2019;116:10525–10530. - PMC - PubMed

Publication types

MeSH terms