. 2021 Jul;161(1):239-254.e9.
doi: 10.1053/j.gastro.2021.03.052. Epub 2021 Apr 2.

Bone Morphogenetic Protein Pathway Antagonism by Grem1 Regulates Epithelial Cell Fate in Intestinal Regeneration

Affiliations

Bone Morphogenetic Protein Pathway Antagonism by Grem1 Regulates Epithelial Cell Fate in Intestinal Regeneration

Martijn A J Koppens et al. Gastroenterology. 2021 Jul.

Abstract

Background & aims: In homeostasis, intestinal cell fate is controlled by balanced gradients of morphogen signaling. The bone morphogenetic protein (BMP) pathway has a physiological, prodifferentiation role, predominantly inferred through previous experimental pathway inactivation. Intestinal regeneration is underpinned by dedifferentiation and cell plasticity, but the signaling pathways that regulate this adaptive reprogramming are not well understood. We assessed the BMP signaling landscape and investigated the impact and therapeutic potential of pathway manipulation in homeostasis and regeneration.

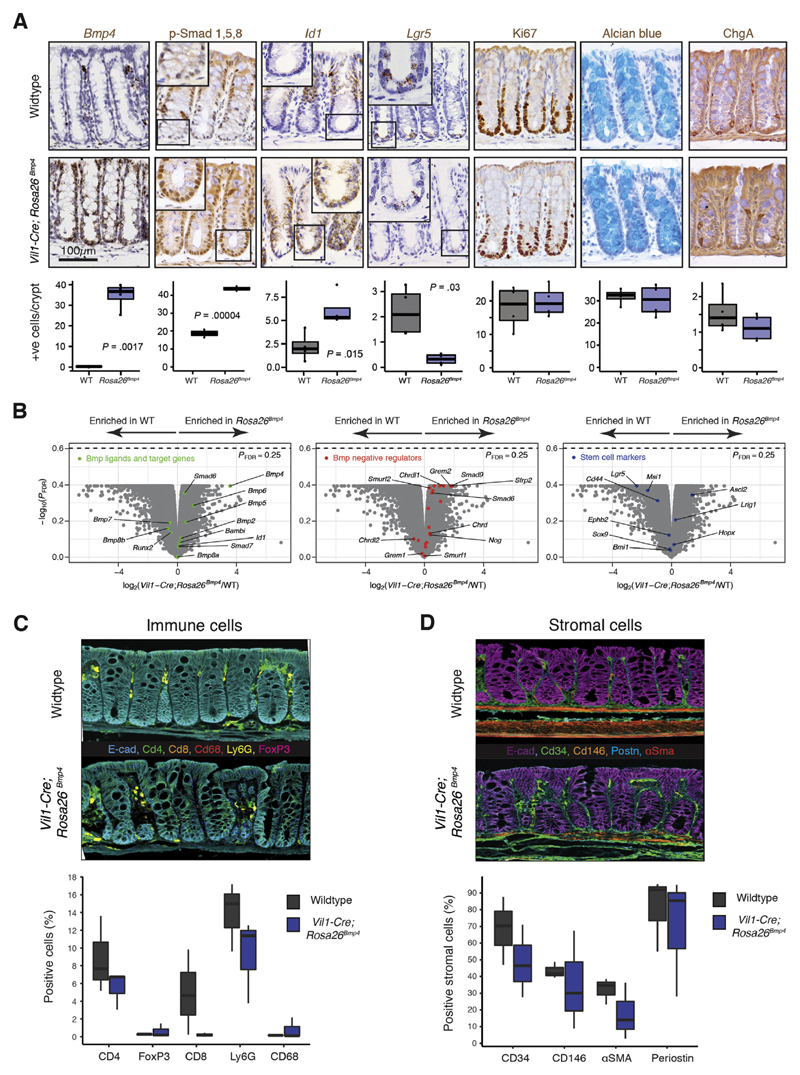
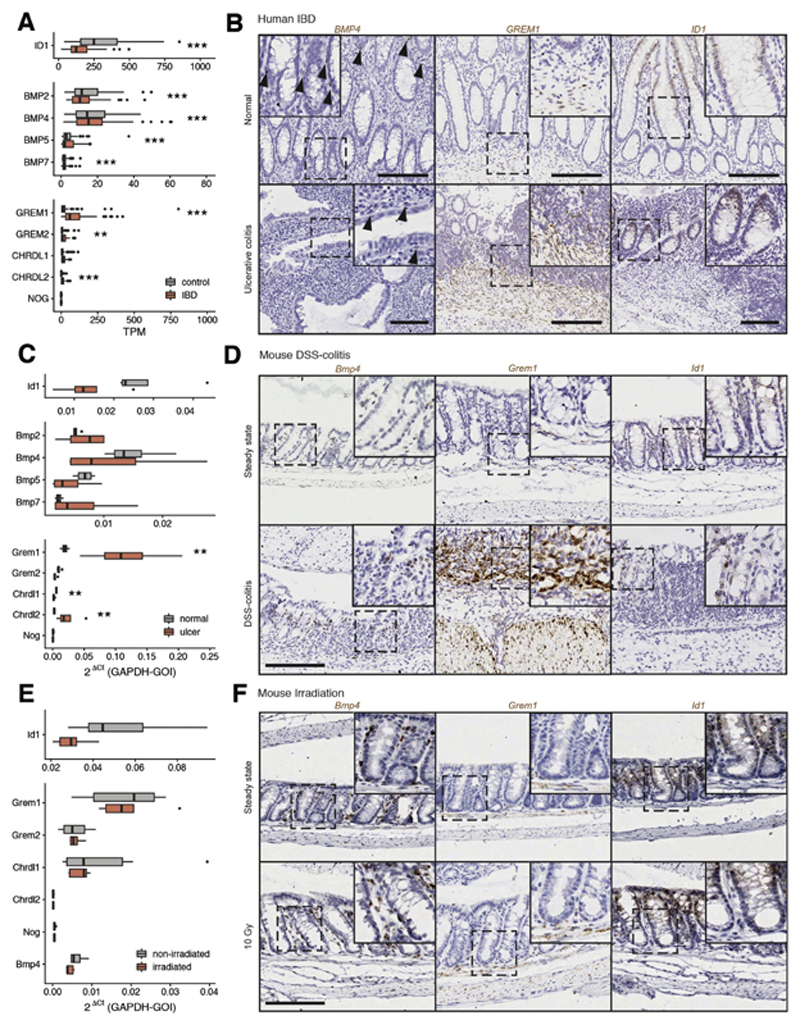
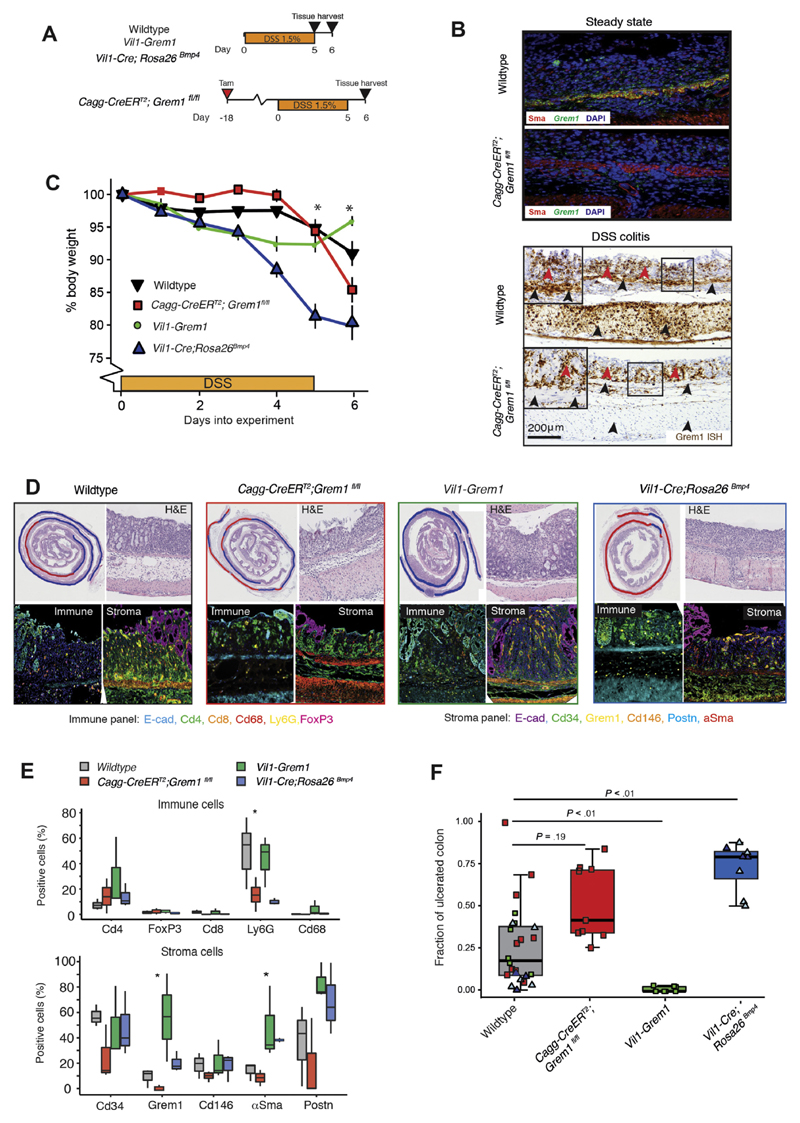
Methods: A novel mouse model was generated to assess the effect of the autocrine Bmp4 ligand on individual secretory cell fate. We spatiotemporally mapped BMP signaling in mouse and human regenerating intestine. Transgenic models were used to explore the functional impact of pathway manipulation on stem cell fate and intestinal regeneration.

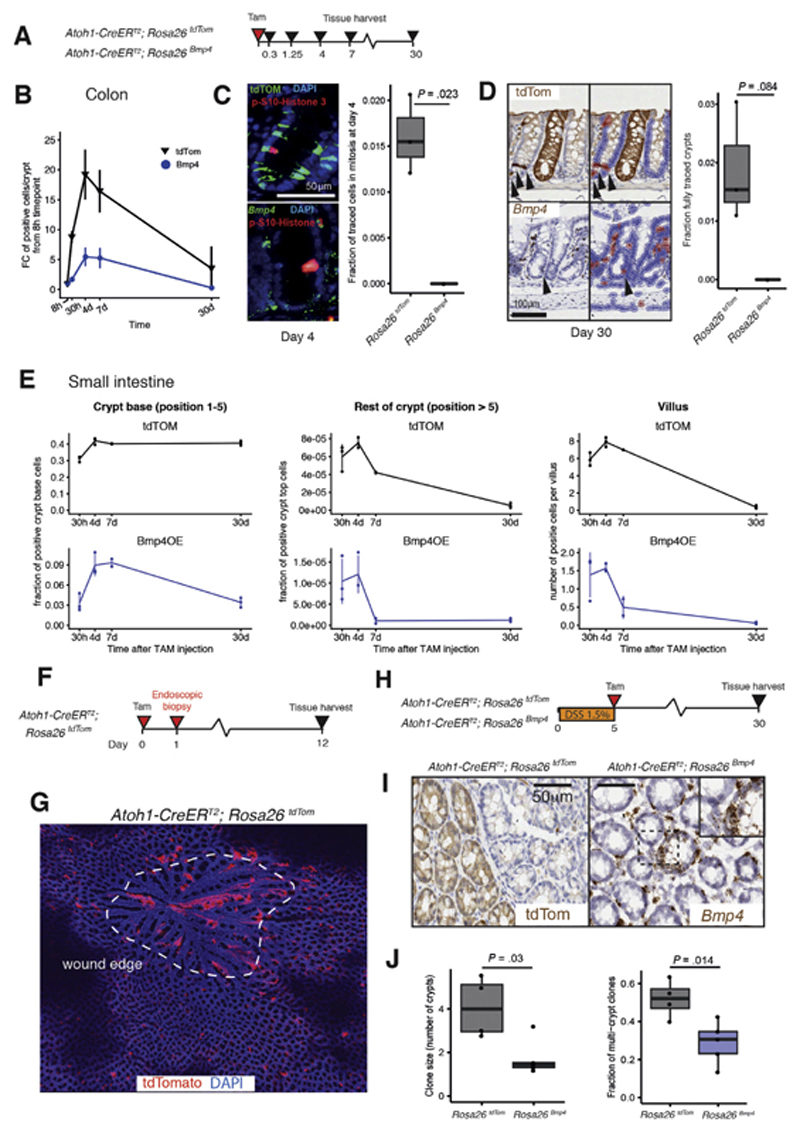
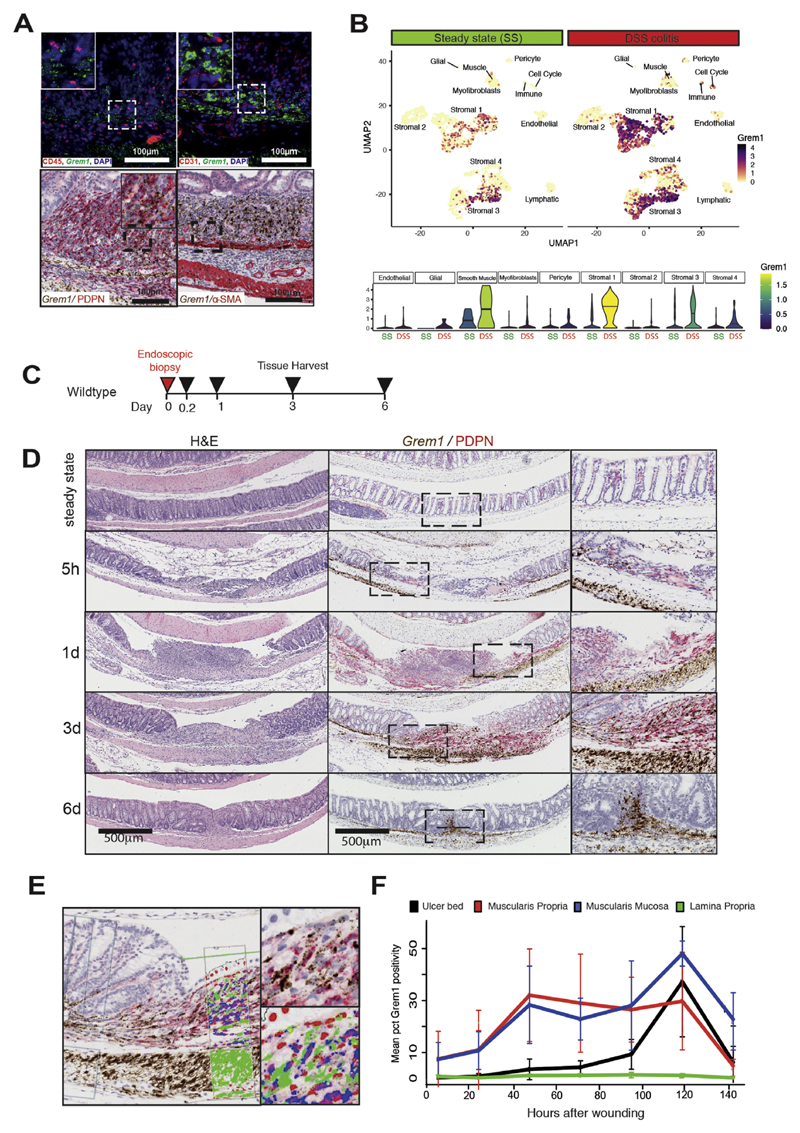
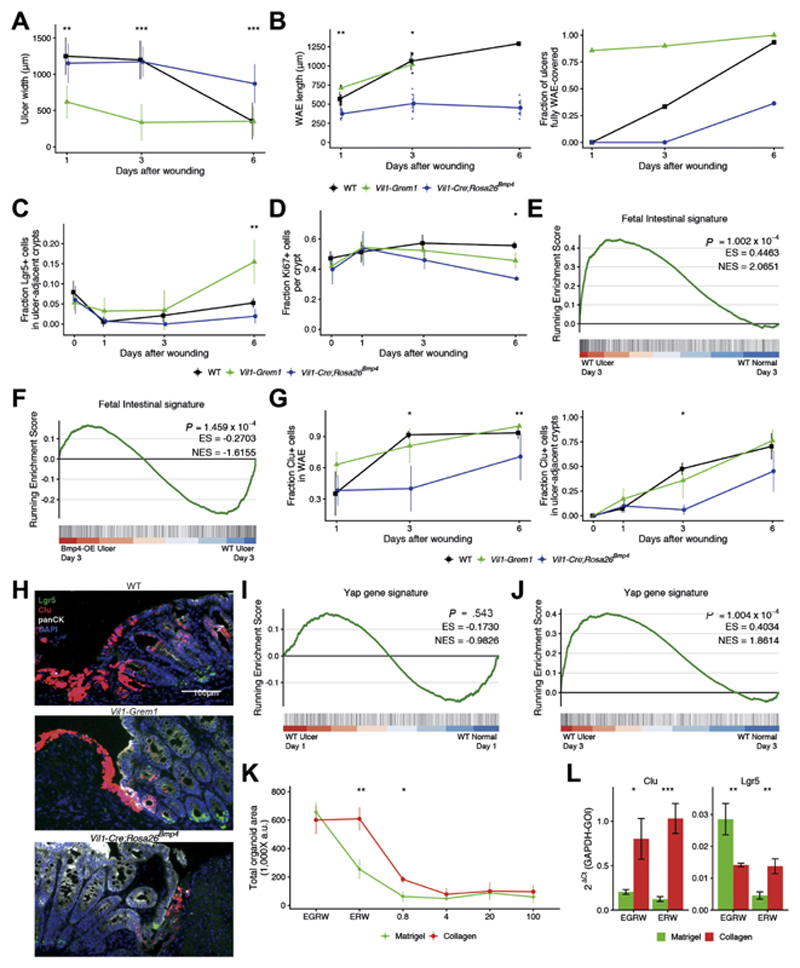
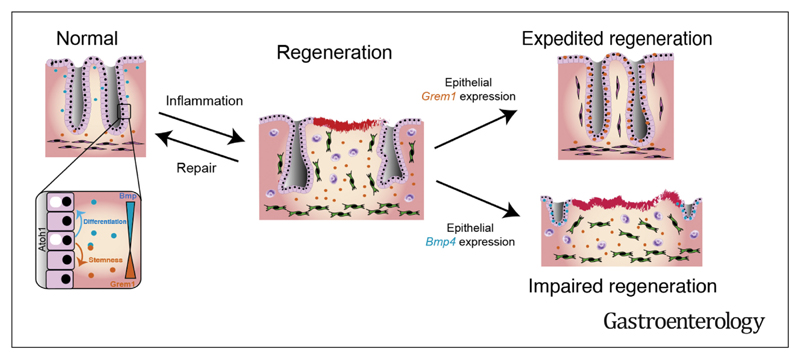
Results: In homeostasis, ligand exposure reduced proliferation, expedited terminal differentiation, abrogated secretory cell survival, and prevented dedifferentiation. After ulceration, physiological attenuation of BMP signaling arose through upregulation of the secreted antagonist Grem1 from topographically distinct populations of fibroblasts. Concomitant expression supported functional compensation after Grem1 deletion from tissue-resident cells. BMP pathway manipulation showed that antagonist-mediated BMP attenuation was obligatory but functionally submaximal, because regeneration was impaired or enhanced by epithelial overexpression of Bmp4 or Grem1, respectively. Mechanistically, Bmp4 abrogated regenerative stem cell reprogramming despite a convergent impact of YAP/TAZ on cell fate in remodeled wounds.

Conclusions: BMP signaling prevents epithelial dedifferentiation, and pathway attenuation through stromal Grem1 upregulation was required for adaptive reprogramming in intestinal regeneration. This intercompartmental antagonism was functionally submaximal, raising the possibility of therapeutic pathway manipulation in inflammatory bowel disease.

Keywords: Bone Morphogenetic Protein; Dedifferentiation; Grem1; Intestinal Regeneration.


Conflict of interest statement

Conflicts of interest

These authors disclose the following: S.J.L. has received grant income from UCB Pharma. V.H.K. has served as an invited speaker on behalf of Indica Labs. The remaining authors disclose no conflicts.

Figures

Figure 1
Figure 1. Steady-state Vil1-Cre;Rosa26Bmp4 mouse colonic phenotyping.
(A) ISH/IHC phenotyping and cell quantification of colon in steady-state Vil1-Cre;Rosa26Bmp4 and wild-type (WT) control mice (t test; n = 4 mice per genotype). Inset magnification 400×. p-, phosphorylated. +ve, positive. (B) Volcano plots show differential gene expression between WT and Vil1-Cre;Rosa26Bmp4 animals (n = 3 mice per genotype). Multiplex IHC and cell quantification show (C) colonic immune and (D) stromal cell landscapes in WT and Vil1-Cre;Rosa26Bmp4 animals (n = 3 per genotype). Box-and-whisker plots: The horizontal line in the middle of each box indicates the median; the top and bottom borders of the box mark the 75th and 25th percentiles, respectively, the whiskers mark minimum and maximum of all the data, and the circles indicate outliers. E-cad, E-cadherin; FDR, false discovery rate.
Figure 2
Figure 2. BMP ligand exposure impacts secretory progenitor cell fate.
(A) Schematic shows recombination and harvesting of homeostatic secretory cell mouse models. (B) Number of colonic epithelial cells stained with tdTomato IHC (black lines) or Bmp4 ISH (blue lines) over time after recombination. P < .001 for genotype, time point, and genotype: time point interaction effects from a 2-way analysis of variance. *Statistical significance of comparisons between tdTomato and Bmp4 at each time point from Tukey’s Honest Significant Difference post hoc tests (n = 3 mice per group, 7 days: n = 2 mice per genotype). (C) Costain of phosphorylated (p)-histone3 (red) with tdTomato IHC (top panel, green) or Bmp4 ISH (bottom panel, green). Quantification of fraction of tdTomato- or Bmp4-expressing colonic cells undergoing cell proliferation at day 4 after recombination (t test; n = 3 mice per genotype). (D) Long-lived secretory cells and lineage-traced crypts 30 days after recombination, stained with tdTomato IHC or Bmp4 ISH and automated detection of positive cells with a digital pathology platform used to exclude noncontributory stromal cell staining (QuPath). Quantification of fraction of fully traced crypts in different genotypes at day 30 (t test, n = 3 mice per genotype). P = .084 with no fully Bmp4-traced crypts detected. Arrowheads: epithelial cells marked as positive. (E) Fraction or number of tdTomato IHC- or Bmp4 ISH-stained cells in the small intestinal crypt base, rest of crypt, and on the villus over time after recombination (n = 3 mice per group, 7 days: n = 2 mice per genotype, 30 crypts and villi analyzed per mouse) (F) Schematic shows recombination and harvesting of endoscopy biopsy-wounded secretory cell mouse model. (G) En face section of healing endoscopic biopsy wound at day 12 (dashed white line) in Atoh1-CreERT2;Rosa26tdTom animals shows streaming of recombined cells into the wound bed. (H) Schematic shows recombination and harvesting of DSS-treated secretory cell mouse models. (I) Representative en face sections of colon from secretory cell models 30 days after initiation of DSS treatment show epithelial cell expression of tdTomato or Bmp4. (J) Clonal patch quantification shows an increase in multicrypt patch size and number in Atoh1-CreERT2;Rosa26tdTom animals after DSS treatment (t test, n = 5 Rosa26Bmp4 mice, 4 Rosa26tdTom mice). The error bars represent the standard deviation. Box-and-whisker plots: The horizontal line in the middle of each box indicates the median; the top and bottom borders of the box mark the 75th and 25th percentiles, respectively, the whiskers mark minimum and maximum of all the data, and the circles indicate outliers. DAPI, 4′,6-diamidino-2-phenylindole. FC, fold change; TAM, tamoxifen; *P < 0.05, ** P < 0.01.
Figure 3
Figure 3. BMP signaling activity in human IBD and mouse models of intestinal regeneration.
(A) Gene expression analysis of publicly available RNAseq data from human healthy and IBD tissue (GSE83687; n = 74 IBD, n = 60 control) shows downregulation of direct BMP target gene expression (ID1), variable impact on BMP ligand expression, and corresponding strong upregulation of GREM1 as the key intestinal BMP antagonist. TPM, transcripts per million. (B) ISH of BMP4, GREM1, and ID1 in healthy human colon and severe ulcerative colitis. (C) Colonic gene expression measured by quantitative reverse-transcription polymerase chain reaction (qRT-PCR) in mouse steady-state and DSS colitis shows downregulation of direct BMP target gene expression (Id1) with corresponding strong upregulation of Grem1 (n = 4 mice; P = .029 by Mann-Whitney U test). (D) ISH hybridization of Bmp4, Grem1, and Id1 in mouse steady-state and DSS colitis colon. (E) Colonic gene expression measured by qRT-PCR in mouse steady-state colon and 24 hours after 10-Gy whole-body irradiation shows minimal impact of radiation damage on BMP pathway constituent expression (n = 5 irradiated, 6 nonirradiated mice; no compared groups were significantly different). (F) ISH of Bmp4, Grem1, and Id1 in mouse steady-state colon and after 10-Gy irradiation. Scale bars: 200 μm, magnification applies to all images, except insets. Box-and-whisker plot: The horizontal line in the middle of each box indicates the median; the top and bottom borders of the box mark the 75th and 25th percentiles, respectively, the whiskers mark the standard deviation, and the circles indicate outliers. GAPDH-GOI, ratio of glyceraldehyde 3-phosphate dehydrogenase gene to the gene of interest. Statistical differences were tested using empirical Bayes moderated 2-tailed t tests with false discovery rate correction (A) or Mann-Whitney tests with false discovery rate correction (C and E). **P < .01,*** P < .001.
Figure 4
Figure 4. Two stromal cell populations upregulate Grem1 in response to colonic injury.
(A) ISH for Grem1 expression with concomitant IHC costaining for stromal cell identification. There was no overlap of fluorescent expression of Grem1 mRNA (green) with leucocytes marked by CD45 (red) or endothelial cells marked by CD31 (red). Overlapping chromogenic ISH for Grem1 (brown) was seen with both ulcer bed stromal cells marked with podoplanin (PDPN) IHC (red), and muscularis mucosae/propria cells marked by αSMA IHC stain (red). DAPI, 4′,6-diamidino-2-phenylindole. (B) Small conditional RNA uniform manifold approximation and projection plots show upregulation and diversification of Grem1 -expressing stromal cell populations in mouse steady-state (SS) and DSS colitis. Violin plots show Grem1 expression in SS and DSS colitis in the mesenchymal cell subsets identified by Kinchen et al.10 Crossbars in Kinchen18 is median expression. (C) Schematic of biopsy schedule and tissue harvesting for endoscopic biopsy-wounded mice. (D) H&E and Grem1 chromogenic ISH (brown) cos-tained with PDPN IHC (red) of biopsy-wounded wild-type mice at 5 hours, 1 day, 3 days, and 6 days after wounding. Scale bar: 500 μm. (E) Digital pathology false color markup of a Grem1/PDPN costaining image at 3 days after wounding. (F) Spatio-temporal quantification of Grem1 -positivity in different colon tissue layers in and within 0.5 mm of the wound. The error bars represent the standard deviation. pct, percentage
Figure 5
Figure 5. Functional impact of BMP manipulation on tissue regeneration.
(A) Schematic of recombination (where applicable), DSS administration, and tissue harvesting schedule for constitutive and inducible mouse models. (B) In steady state, Grem1 ISH (green) and αSMA IHC (red) show clear colocalization of expression in the muscularis mucosa of wild-type animals and efficient knockout of Grem1 expression in Cagg-CreERT2;Grem1fl/fl animals. In DSS colitis, successful knockout of Grem1 expression is seen from the tissue-resident muscularis mucosa and propria (black arrowheads), but continued Grem1 expression (brown stain) from the wound-associated stromal cells persists (red arrowheads). DAPI, 4′,6-diamidino-2-phenylindole. (C) Body weight of wild-type, Cagg-CreERT2;Grem1fl/fl, Vil1-Grem1, and Vil1-Cre;Rosa26Bmp4 mice over time as the percentage of body weight at the start of DSS treatment (n = 6-8 mice per genotype; 5 of 8 Rosa26Bmp4 mice were killed at day 5 along with 5 of 8 wild-type littermates. *P < .05, indicating statistical significance from t tests comparing WT and Vil1-Cre;Rosa26Bmp4 at each time point. The error bars represent the SEMD. (D) Representative H&E images of DSS-induced ulceration with blue and red curves demarcating the extent of normal and denuded colon, respectively. Multiplex IHC stain shows immune and stromal cell landscapes of DSS-induced ulcers in wild-type (grey box), Cagg-CreERT2;Grem1fl/fl (red box), Vil1-Grem1 (green box), and Vil1-Cre;Rosa26Bmp4 mice (blue box). (E) Cell quantification of multiplex IHC immune and stromal cell stain in DSS ulcers between genotypes (n = 3 per genotype). *P < .05 by analysis of variance. (F) Fraction of ulcerated colon in different animal genotypes. Control colored dots represent control littermates for the individual genotype experiments. The light blue triangles are 5 of 8 Vil1-Cre;Rosa26Bmp4 animals that exceeded weight loss limits and had to be killed at 5 days; an equal number of wild-type littermates were killed as time point controls. The dark blue triangles are wild-type or Vil1-Cre;Rosa26Bmp4 animals that reached the 6-day experimental end point (3 of 8) (n = 6-9 mice per genotype). The horizontal line in the middle of each box indicates the median; the top and bottom borders of the box mark the 75th and 25th percentiles, respectively, and the whiskers mark minimum and maximum of all the data. *P < 0.05, ** P < 0.01 by t test.
Figure 6
Figure 6. BMP manipulation affects epithelial adaptive response in wound healing.
Microscopic appearance of ulcers in different genotypes over time after endoscopic wounding. (A) Ulcer width. (B) WAE length and the fraction of ulcer covered by WAE (n = 6-15 ulcers). Wounds completely covered with WAE were excluded from WAE length measurements. WT, wild-type. (C) Fraction of Lgr5-positive cells (n = 3–6 mice per group). (D) Ki67-positive proliferating cells in ulcer-adjacent crypts in different genotypes over time (n = 3–5 mice per group). (E) Gene set enrichment analysis showing enrichment of fetal intestinal signature in the endoscopy biopsy wound milieu at day 3. ES, enrichment score; NES, normalized enrichment score. (F) Negative enrichment of fetal intestinal signature in the biopsy wounds of Vil1-Cre;Rosa26Bmp4 mice compared with wounded WT animals at day 3. (G) Regenerative stem cells, marked by clusterin (Clu) staining in (left) WAE and (right) ulcer-adjacent crypts in different genotypes, over time (n = 3-6 mice per group). In all line plots, line colors represent Wt (black), Vil1-grem1 (green), and Vil1-Cre; Rosa26Bmp4 (blue). (H) Representative images of ISH for Lgr5 (green), clusterin (Clu; red) with costain IHC for pan-cytokeratin (panCK, white) and 4′,6-diamidino-2-phenylindole (DAPI, blue) in 3-day-old endoscopy wounds in different genotype animals. Scale bar: 100 μm. (I) Gene set enrichment analysis shows no enrichment of YAP signature in acute biopsy wounds in WT animals at day 1, but (J) significant enrichment of YAP signature in biopsy wound ulcers by day 3 as the wound bed remodels. (K) Organoid survival when grown in Matrigel (green line) or collagen (red line) with media containing variable recombinant proteins and increasing doses of recombinant BMP4 (n = 3 experiments, n = 2 for 20 ng/mL). (L) Quantitative reverse-transcription polymerase chain reaction of crypt base columnar (Lgr5) and regenerative stem cell gene expression (Clu) in organoids grown in Matrigel or collagen (n = 3 experiments) and with variable media constituents (E, epidermal growth factor; G, GREM1; R, RSPO1; W, WNT3A). GAPDH-GOI, ratio of glyceraldehyde 3-phosphate dehydrogenase gene to the gene of interest. The error bars represent the standard deviation. Statistical differences were tested using a Kruskal-Wallis test (A–D, F, H) or a Student t test (I). *P < .05, **P < .01, ***P < .001.
None

References

    1. Scoville D, Sato T, He X, et al. Current view: intestinal stem cells and signaling. Gastroenterology. 2008;134:849–864. - PubMed
    1. van den Brink G, Offerhaus G. The morphogenetic code and colon cancer development. Cancer Cell. 2007;11:109–117. - PubMed
    1. Kosinski C, Li V, Chan A, et al. Gene expression patterns of human colon tops and basal crypts and BMP antag-onists as intestinal stem cell niche factors. Proc Natl Acad Sci U S A. 2007;104:15418–15423. - PMC - PubMed
    1. McCarthy N, Manieri E, Storm EE, et al. Distinct mesenchymal cell populations generate the essential intestinal BMP signaling gradient. Cell Stem Cell. 2020;26:391–402.:e5. - PMC - PubMed
    1. He XC, Zhang J, Tong WG, et al. BMP signaling inhibits intestinal stem cell self-renewal through suppression of Wnt-beta-catenin signaling. Nat Genet. 2004;36:1117–1121. - PubMed

Publication types

MeSH terms

Substances

LinkOut - more resources