

To denoise or to cluster, that is not the question: optimizing pipelines for COI metabarcoding and metaphylogeography
- PMID: 33820526
- PMCID: PMC8020537
- DOI: 10.1186/s12859-021-04115-6
To denoise or to cluster, that is not the question: optimizing pipelines for COI metabarcoding and metaphylogeography
Abstract
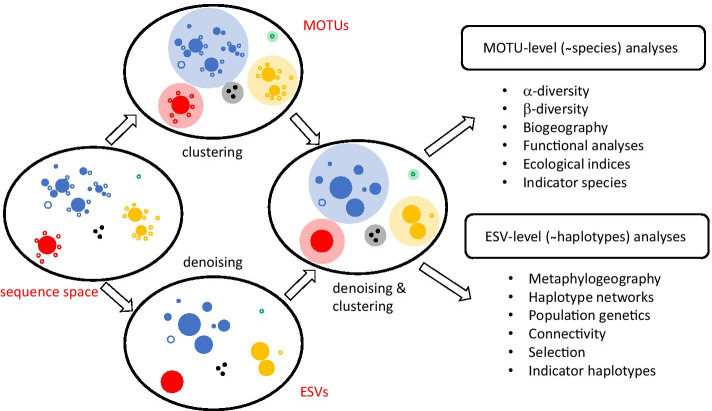
Background: The recent blooming of metabarcoding applications to biodiversity studies comes with some relevant methodological debates. One such issue concerns the treatment of reads by denoising or by clustering methods, which have been wrongly presented as alternatives. It has also been suggested that denoised sequence variants should replace clusters as the basic unit of metabarcoding analyses, missing the fact that sequence clusters are a proxy for species-level entities, the basic unit in biodiversity studies. We argue here that methods developed and tested for ribosomal markers have been uncritically applied to highly variable markers such as cytochrome oxidase I (COI) without conceptual or operational (e.g., parameter setting) adjustment. COI has a naturally high intraspecies variability that should be assessed and reported, as it is a source of highly valuable information. We contend that denoising and clustering are not alternatives. Rather, they are complementary and both should be used together in COI metabarcoding pipelines.
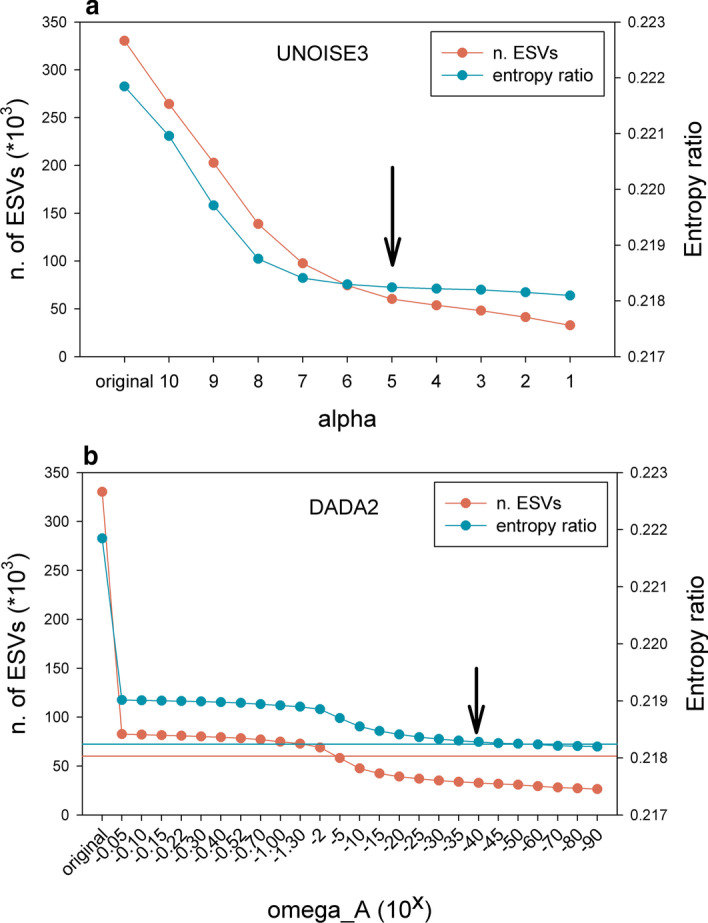
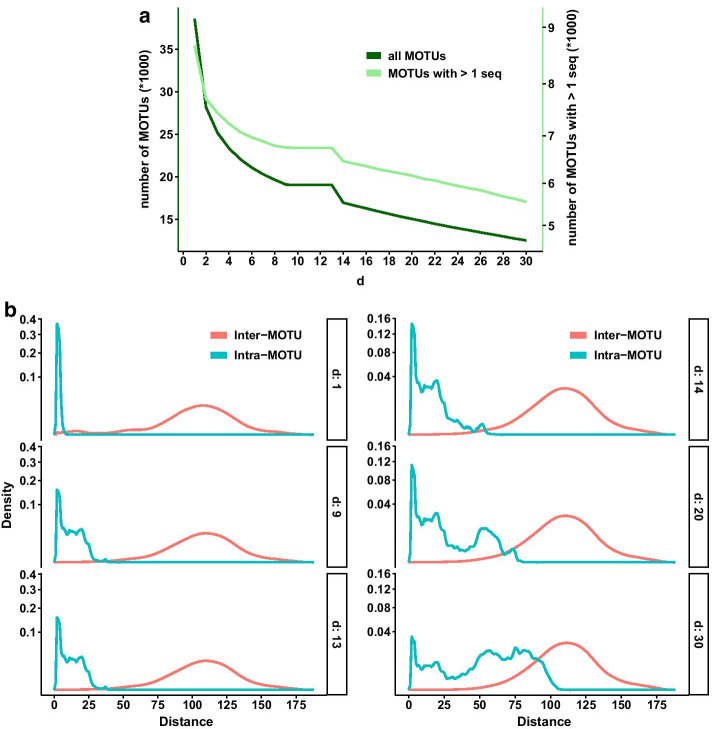
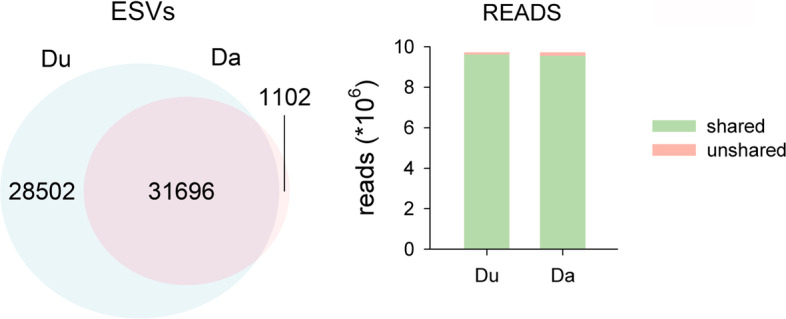
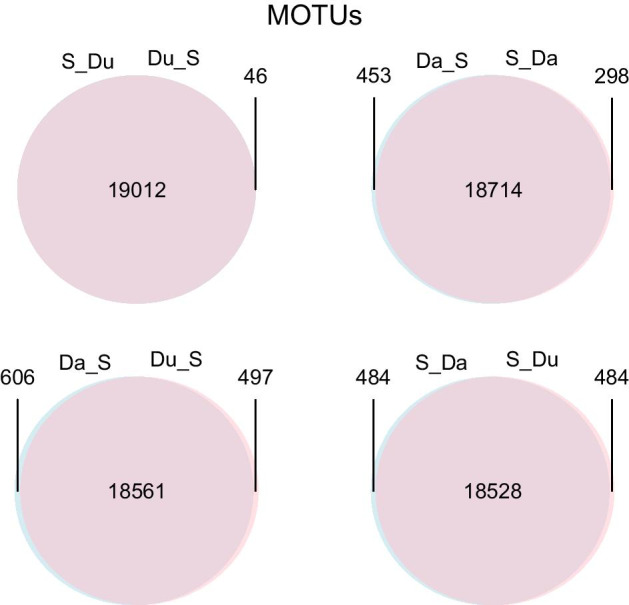
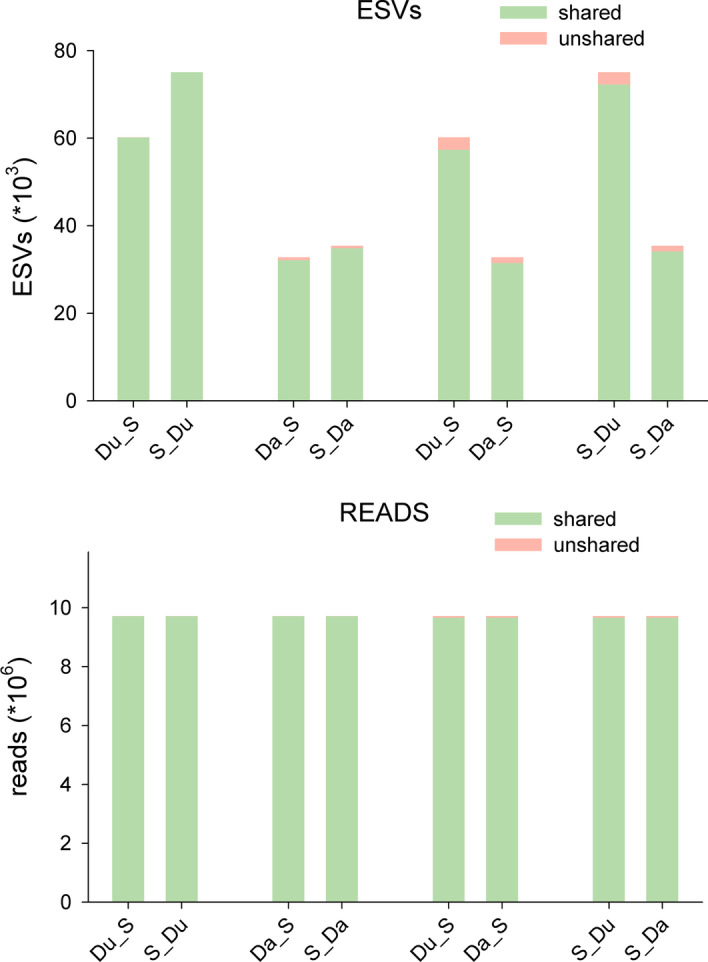
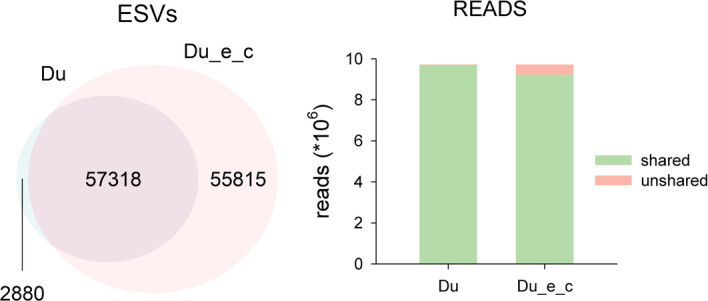
Results: Using a COI dataset from benthic marine communities, we compared two denoising procedures (based on the UNOISE3 and the DADA2 algorithms), set suitable parameters for denoising and clustering, and applied these steps in different orders. Our results indicated that the UNOISE3 algorithm preserved a higher intra-cluster variability. We introduce the program DnoisE to implement the UNOISE3 algorithm taking into account the natural variability (measured as entropy) of each codon position in protein-coding genes. This correction increased the number of sequences retained by 88%. The order of the steps (denoising and clustering) had little influence on the final outcome.
Conclusions: We highlight the need for combining denoising and clustering, with adequate choice of stringency parameters, in COI metabarcoding. We present a program that uses the coding properties of this marker to improve the denoising step. We recommend researchers to report their results in terms of both denoised sequences (a proxy for haplotypes) and clusters formed (a proxy for species), and to avoid collapsing the sequences of the latter into a single representative. This will allow studies at the cluster (ideally equating species-level diversity) and at the intra-cluster level, and will ease additivity and comparability between studies.
Keywords: COI; Clustering; Denoising; Metabarcoding; Metaphylogeography; Operational taxonomic units.
Conflict of interest statement
The authors declare that they have no competing interests.
Figures
References
-
- Aylagas E, Borja A, Muxika I, Rodríguez-Ezpeleta N. Adapting metabarcoding-based benthic biomonitoring into routine ecological status assessment networks. Ecol Ind. 2018;95:194–202. doi: 10.1016/j.ecolind.2018.07.044. - DOI
-
- Bani A, De Brauwer M, Creer S, Dumbrell AJ, Limmon G, Jompa J, von der Heyden S, Beger M. Informing marine spatial planning decisions with environmental DNA. Adv Ecol Res. 2020;62:375–407. doi: 10.1016/bs.aecr.2020.01.011. - DOI
-
- Compson ZG, McClenaghan B, Singer GAC, Fahner N, Hajibabaei M. Metabarcoding from microbes to mammals: comprehensive bioassessmenton a global scale. Front Ecol Evol. 2020;8:581835. doi: 10.3389/fevo.2020.581835. - DOI
-
- Mathieu C, Hermans SM, Lear G, Buckley TR, Lee KC, Buckley HL. A systematic review of sources of variability and uncertainty in eDNA data for environmental monitoring. Front Ecol Evol. 2020;8:135. doi: 10.3389/fevo.2020.00135. - DOI
MeSH terms
LinkOut - more resources
Full Text Sources
Other Literature Sources
