Case Reports
. 2022 Apr;59(4):358-365.
doi: 10.1136/jmedgenet-2020-107237. Epub 2021 Apr 5.

Mutations in phospholipase C eta-1 (PLCH1) are associated with holoprosencephaly

Affiliations
Case Reports

Mutations in phospholipase C eta-1 (PLCH1) are associated with holoprosencephaly

Ichrak Drissi et al. J Med Genet. 2022 Apr.

Abstract

Background: Holoprosencephaly is a spectrum of developmental disorder of the embryonic forebrain in which there is failed or incomplete separation of the prosencephalon into two cerebral hemispheres. To date, dominant mutations in sonic hedgehog (SHH) pathway genes are the predominant Mendelian causes, and have marked interfamilial and intrafamilial phenotypical variabilities.

Methods: We describe two families in which offspring had holoprosencephaly spectrum and homozygous predicted-deleterious variants in phospholipase C eta-1 (PLCH1). Immunocytochemistry was used to examine the expression pattern of PLCH1 in human embryos. We used SHH as a marker of developmental stage and of early embryonic anatomy.

Results: In the first family, two siblings had congenital hydrocephalus, significant developmental delay and a monoventricle or fused thalami with a homozygous PLCH1 c.2065C>T, p.(Arg689*) variant. In the second family, two siblings had alobar holoprosencephaly and cyclopia with a homozygous PLCH1 c.4235delA, p.(Cys1079ValfsTer16) variant. All parents were healthy carriers, with no holoprosencephaly spectrum features. We found that the subcellular localisation of PLCH1 is cytoplasmic, but the p.(Cys1079ValfsTer16) variant was predominantly nuclear. Human embryo immunohistochemistry showed PLCH1 to be expressed in the notorcord, developing spinal cord (in a ventral to dorsal gradient), dorsal root ganglia, cerebellum and dermatomyosome, all tissues producing or responding to SHH. Furthermore, the embryonic subcellular localisation of PLCH1 was exclusively cytoplasmic, supporting protein mislocalisation contributing to the pathogenicity of the p.(Cys1079ValfsTer16) variant.

Conclusion: Our data support the contention that PLCH1 has a role in prenatal mammalian neurodevelopment, and deleterious variants cause a clinically variable holoprosencephaly spectrum phenotype.

Keywords: and neonatal diseases and abnormalities; cerebellar diseases; congenital; genetics; hereditary; mutation.


Conflict of interest statement

Competing interests: None declared.

Figures
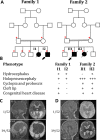
Figure 1
Figure 1
Family pedigrees, summary phenotype table and brain scans of affected individuals. (A) Pedigrees of the two families described in the paper. Arrows show probands; filled-in squares or circles denote affected individuals; and red asterisks denotes people from whom we had a DNA sample. (B) Key phenotypical features of the affected four children aligned; all other family members have no disease features. A minus sign designates the feature was absent; a plus sign indicates it was present; and a triple plus sign indicates that the features were severe. (C, D) MRI brain scans of the two affected children from family 1, detailed in the text. For each, the top pair of scans shows results for 1 week of age, and the lower pairs for 39 weeks of age. (C) Gross hydrocephalus and the later findings were suggestive of holoprosencephaly. In both right-hand axial T2 views, the star shows the fused thalami, and two ventricular heteropias are best seen in the upper axial T2 view shown by arrow heads. (D) Lesser hydrocephalus with partial thalamic fusion, again a feature of the holoprosencephaly spectrum.
Figure 2
Figure 2
PLCH1 gene and protein, with position of mutations, and subcellular localisation of PLCH1 wild type and family 2 mutation p.(Cys1079ValfsTer16). (A) Uppermost is a cartoon of the structure of the PLCH1 gene. The relative size of the exons, but not introns, is shown. Lowermost is a cartoon of the PLCH1 protein with the canonical PLCH domains in blue and named, a predicted nuclear localisation signal is shown in black, and predicted nuclear export signal in green. Between the gene and the protein, the family 1 and family 2 mutations are shown, with their respective postions in gene and protein indicated. (B) Electrophoretogram of the family 1 mutation, with upper homozygous wild-type control and lower homozygous mutation. (C) Subcellular localisation of wild-type PLCH1 on the left to be cytoplasmic in a transfected 1-7HB2 epithelial cell line, whereas the middle pane shows that the family two mutation P. (Cys1079Valfs*16) is also present in the nucleus. on the right a bar chart shows the nuclear signal depicted by pixel/area of PLCH1 covered in the nucleus of WT PLCH1 (red) and mutant PLCH1 (blue). A two tailed t-test performed on the data gave a p value of 2.43116E-10, so p<0.01 and the mutant and WT PLCH1 nuclear signals are significantly different p<0.01, so mutant PLCH1 shows a statistically significant increase in nuclear signal. Methodology if needed for subcellular localisation of mut v wt: cellular localisation of the WT PLCH1 protein and mutant PLCH1 protein, showing a clear change in localisation to include in the nucleus in 1-7HB2 epithelial cell line, with PLCH1 being stained with antiFLAG (goat anti-rabbit 488) in green at 1:1000 and DAPI nuclear staining in blue. These were viewed using confocal microscopy at ×100. PLCH1, phospholipase C eta-1.
Figure 3
Figure 3
Human embryo immunohistochemistry studies expression of PLCH1 and SHH in a carnegie stage 10 sagittal section and carnegie stage 12 transverse section through the upper thorax. Antibodies to human SHH are shown in red; antibodies to PLCH1 are shown in green; and DAPI in blue shows nuclei. (A) Near midline sagittal section of a CS10 embryo, with size bar 100 µm. The boxed area contains cells with both SHH and PLCH1 expression and is shown magnified in B. The green mass to the lower left is artefact autofluorescence. The orientation of the embryo is unclear, but probably the head is at the right top with the back at the bottom and abdominal area to the left side. (B) Magnification of the boxed area in A, size bar 40 µm. The upper left panel is of SHH expression, upper right of PLCH1, lower left of DAPI and the composite is at the lower right and shows a collection of cells, most of which express both SHH and PLCH1. (C) Transverse CS12 section through the upper thorax, with size bars 100 µm. The upper left panel is of SHH expression, upper right of PLCH1, lower left of DAPI and the composite is at the lower right showing the spinal cord at the centre including a boxed area, developing dorsal root ganglia at either side—on the right indicated by an arrow and laterally the somites stained prominently by PLCH1. (D) Magnification of the boxed area in C, size bar 25 µm. the left panel is of SHH expression, middle of PLCH1, and the composite is at the right also including DAPI. It shows that some cells in the developing spinal cord express SHH or PLCH1, but rarely both. (E) Magnification of the arrowed area in C, size bar 10 µm. The left panel is of SHH expression, middle of PLCH1, and the composite is at the right also including DAPI. This shows that the cells of the developing dorsal root ganglia predominantly express both SHH and PLCH1. PLCH1, phospholipase C eta-1; SHH, sonic hedgehog.
Figure 4
Figure 4
Human embryo immunohistochemistry studies in carnegie stage 12 transverse sections illustrating a PLCH1 ventrodorsal gradient in the spinal cord, notocord expression and that embryonic subcellular localisation of PLCH1 is consistently cytoplasmic and not nuclear. Antibodies to human PLCH1 are shown in red, and DAPI in blue shows nuclei. (A) Transverse CS12 section through the upper thorax, with size bars 100 µm. Leftmost is PLCH1 expression; middle DAPI and the composite at right. This shows the ventrodorsal gradient of PLCH1 expression in the developing spinal cord – mirroring a similar reported SHH gradient. The laterally placed somites also express PLCH1. The dorsal root ganglia (between the somites and spinal cord) also express PLCH1 but are less well shown. This is likely a consequence of the somites and spinal cord being continuous, but the dorsal root ganglia being an intermittent chain of cell aggregates. (B) Transverse CS12 section through the upper thorax, with size bars 100 µm; only staining for PLCH1 expression is shown. the white arrow shows PLCH1 expression in the notochord; the ventrodorsal gradient of PLCH1 expression in the developing spinal cord is again shown. (C) Sagittal C12 section with size bar 10 µm. Leftmost is PLCH1 expression, middle DAPI and the merge at right. This shows a cytoplasmic subcellular localisation of PLCH1 in the hindbrain. PLCH1, phospholipase C eta-1; SHH, sonic hedgehog.

Similar articles

Cited by

References

    1. Shiota K, Yamada S, Komada M, Ishibashi M. Embryogenesis of holoprosencephaly. Am J Med Genet A 2007;143A:3079–87. 10.1002/ajmg.a.32020 - DOI - PubMed
    1. Solomon BD, Gropman A, Muenke M. Holoprosencephaly Overview. In: Adam MP, Ardinger HH, Pagon RA, Wallace SE, Bean LJH, Stephens K, Amemiya A, eds. GeneReviews® [Internet]. Seattle (WA): University of Washington, 2000: 1993–2019.
    1. Martinez AF, Kruszka PS, Muenke M. Extracephalic manifestations of nonchromosomal, nonsyndromic holoprosencephaly. Am J Med Genet C Semin Med Genet 2018;178:246–57. 10.1002/ajmg.c.31616 - DOI - PMC - PubMed
    1. Dubourg C, Bendavid C, Pasquier L, Henry C, Odent S, David V. Holoprosencephaly. Orphanet J Rare Dis 2007;2:1–14. 10.1186/1750-1172-2-8 - DOI - PMC - PubMed
    1. Taniguchi K, Anderson AE, Sutherland AE, Wotton D. Loss of Tgif function causes holoprosencephaly by disrupting the SHH signaling pathway. PLoS Genet 2012;8:e1002524. 10.1371/journal.pgen.1002524 - DOI - PMC - PubMed

Publication types