. 2021 Apr 20;118(16):e2008814118.
doi: 10.1073/pnas.2008814118.

Measuring voluntary and policy-induced social distancing behavior during the COVID-19 pandemic

Affiliations

Measuring voluntary and policy-induced social distancing behavior during the COVID-19 pandemic

Youpei Yan et al. Proc Natl Acad Sci U S A. .

Abstract

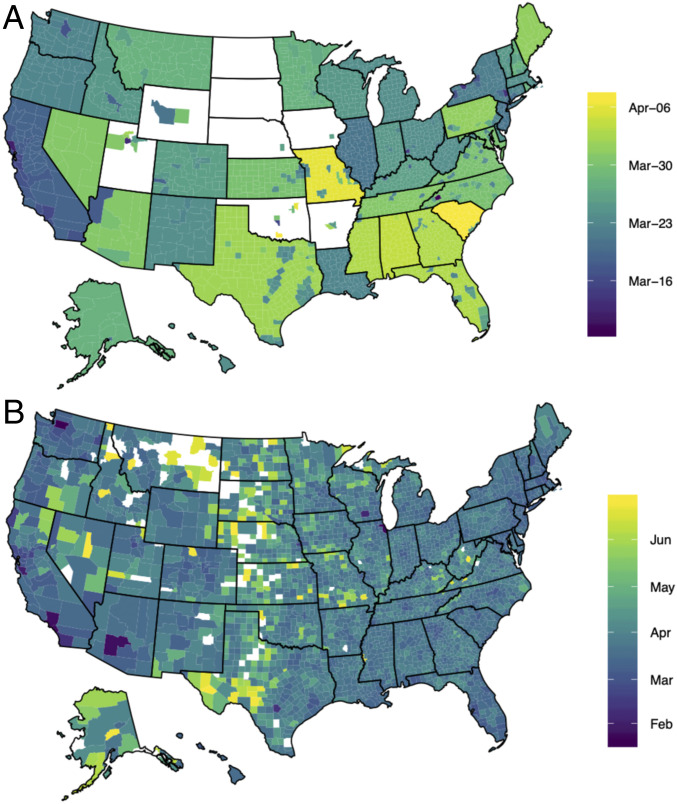
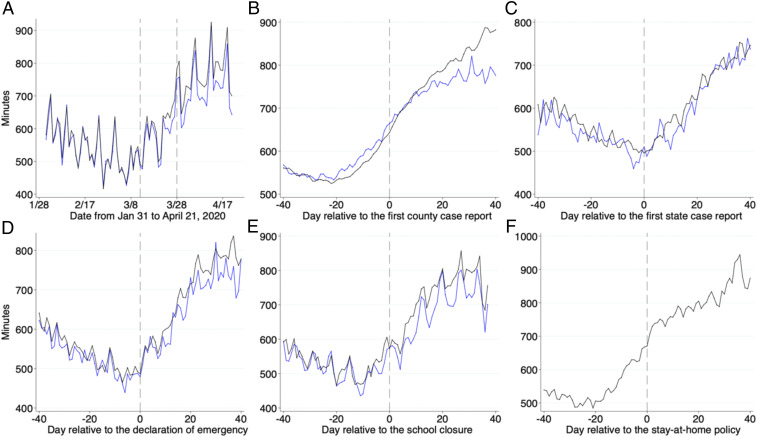
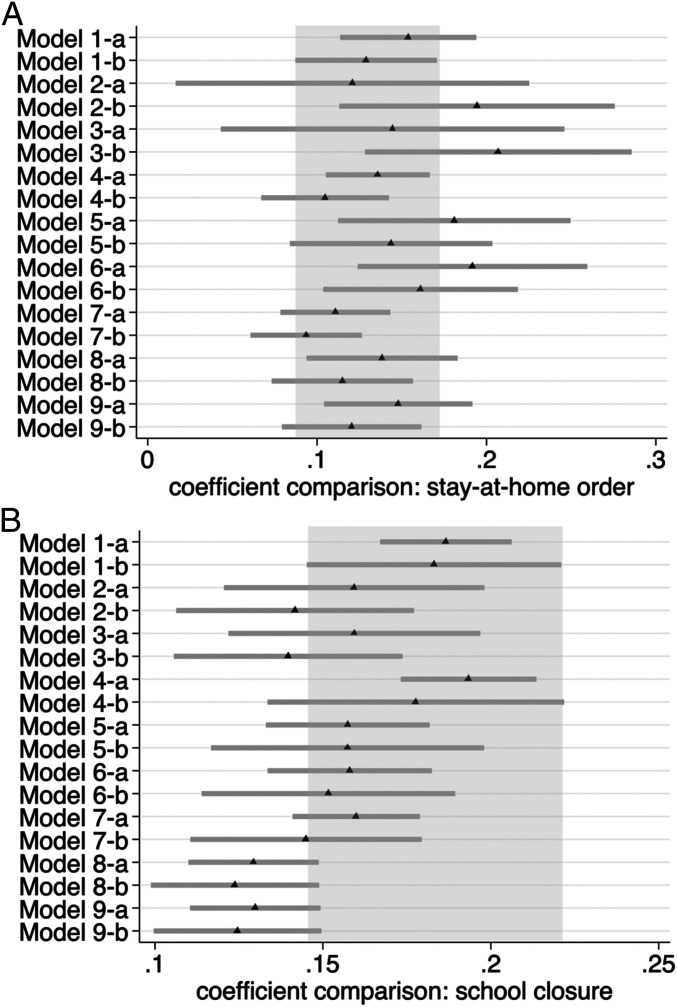
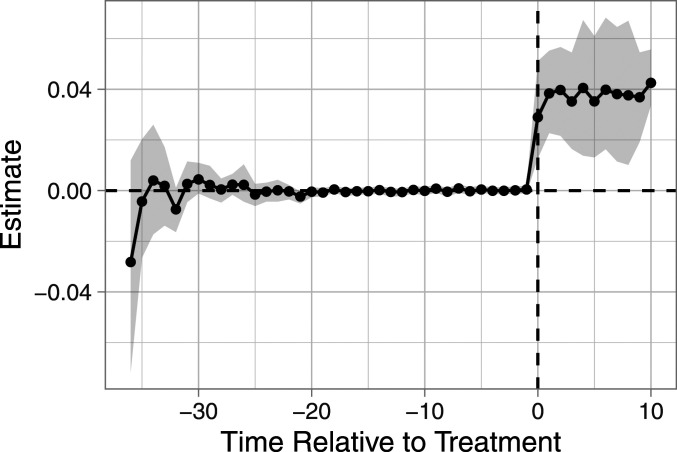
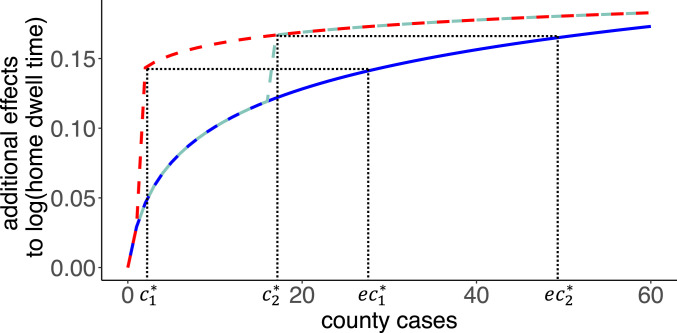
Staying home and avoiding unnecessary contact is an important part of the effort to contain COVID-19 and limit deaths. Every state in the United States enacted policies to encourage distancing and some mandated staying home. Understanding how these policies interact with individuals' voluntary responses to the COVID-19 epidemic is a critical initial step in understanding the role of these nonpharmaceutical interventions in transmission dynamics and assessing policy impacts. We use variation in policy responses along with smart device data that measures the amount of time Americans stayed home to disentangle the extent that observed shifts in staying home behavior are induced by policy. We find evidence that stay-at-home orders and voluntary response to locally reported COVID-19 cases and deaths led to behavioral change. For the median county, which implemented a stay-at-home order with about two cases, we find that the response to stay-at-home orders increased time at home as if the county had experienced 29 additional local cases. However, the relative effect of stay-at-home orders was much greater in select counties. On the one hand, the mandate can be viewed as displacing a voluntary response to this rise in cases. On the other hand, policy accelerated the response, which likely helped reduce spread in the early phase of the pandemic. It is important to be able to attribute the relative role of self-interested behavior or policy mandates to understand the limits and opportunities for relying on voluntary behavior as opposed to imposing stay-at-home orders.

Keywords: COVID-19; avoidance behavior; nonpharmaceutical interventions; social distancing; stay-at-home order.


Conflict of interest statement

The authors declare no competing interest.

Figures

Fig. 1.
Fig. 1.
Date that counties enacted stay-at-home order (A) and date of the first case reported within a county (B).
Fig. 2.
Fig. 2.
Trends for the mean time at home in minutes for counties never receiving stay-at-home policies (blue lines) and counties receiving a stay-at-home policy (black lines) by calendar date with vertical lines showing the median date for emergency orders and stay-at-home policies (A), aligned to the first case reported at the county level (B), aligned to the first case reported at the state level (C), aligned to the emergency declarations (D), aligned to school closure (E), and aligned to the stay-at-home policy (F).
Fig. 3.
Fig. 3.
Summary of regression results on policy effects. The specifications are: 1) models with cumulative county cases, 2) models with cumulative state rather than county cases, 3) models with cumulative state and county cases, 4) models with new county cases rather than cumulative cases, 5) models with new state cases rather than cumulative cases, 6) models with new county and state cases rather than cumulative cases, 7) models with cumulative county deaths, 8) models with cumulative state rather than county deaths, and 9) models with cumulative state and county deaths. Model A is the basic county fixed effects model without time-varying fixed effects, and B includes interaction of labor share with county fixed effects, and fixed effects relative to the first case.
Fig. 4.
Fig. 4.
Augmented synthetic control estimate of the effect of the stay-at-home order (time 0) and m-out-of-n bootstrap 95% confidence intervals. The minimal difference between the treated and control counties prior to treatment is evidence of parallel pretrends.
Fig. 5.
Fig. 5.
Illustration of the case equivalent response to the stay-at-home order concept. The symbol c is the level of cases when the stay-at-home order went into effect, and ecc is the cases needed to induce the equivalent additional time at home. The horizontal difference is the case equivalent response to the stay-at-home order. The blue curve is the voluntary response for the no stay-at-home order counterfactual. The red (cyan) curve is the response with the stay-at-home order when the mandate is imposed on the median (mean excluding New York City’s 9,065 cases) number case when a stay-at-home order went into effect. We note that the median county reflects the experience of most Americans better than the mean county.
Fig. 6.
Fig. 6.
(A) Cases in each county when the stay-at-home order was in effect (censored at 99% = 318 cases). Counties imposing stay-at-home orders with zero cases are shown in black. Missing data or those never imposing stay-at-home orders are white. (B) Equivalent cases to the response to the stay-at-home order (values about 95% = 3,553.7 cases are colored yellow) for each county using coefficients of column 2 in Table 1. (C) Equivalent cases per population by county.

Comment in

  • doi: 10.1073/pnas.2104413118

Similar articles

Cited by

References

    1. Budryk Z., North Dakota records world’s highest COVID-19 mortality rate. The Hill, https://thehill.com/policy/healthcare/526324-north-dakota-records-worlds.... Accessed 17 November 2020.
    1. Dake L., Oregon leaders want you to follow new COVID-19 rules. But don’t expect a knock on the door. OPB,. https://www.opb.org/article/2020/11/18/oregon-leaders-want-you-to-follow.... Accessed 18 November 2020.
    1. Bayham J., Fenichel E. P., Impact of school closures for COVID-19 on the US health-care workforce and net mortality: A modelling study. Lancet Public Health 5, e271–e278 (2020). - PMC - PubMed
    1. BallotPedia , Lawsuits about state actions and policies in response to the coronavirus (COVID-19) pandemic. https://ballotpedia.org/Lawsuits_about_state_actions_and_policies_in_res.... Accessed 19 November 2020.
    1. National Academies of Sciences, Engineering, and Medicine , Framework for Equitable Allocation of COVID-19 Vaccine (The National Academies Press, Washington, DC, 2020). - PubMed

Publication types

LinkOut - more resources