. 2021 Apr;23(4):366-376.
doi: 10.1038/s41556-021-00646-5. Epub 2021 Apr 5.

Liquid-like protein interactions catalyse assembly of endocytic vesicles

Affiliations

Liquid-like protein interactions catalyse assembly of endocytic vesicles

Kasey J Day et al. Nat Cell Biol. 2021 Apr.

Abstract

During clathrin-mediated endocytosis, dozens of proteins assemble into an interconnected network at the plasma membrane. As initiators of endocytosis, Eps15 and Fcho1/2 concentrate downstream components, while permitting dynamic rearrangement within the budding vesicle. How do initiator proteins meet these competing demands? Here we show that Eps15 and Fcho1/2 rely on weak, liquid-like interactions to catalyse endocytosis. In vitro, these weak interactions promote the assembly of protein droplets with liquid-like properties. To probe the physiological role of these liquid-like networks, we tuned the strength of initiator protein assembly in real time using light-inducible oligomerization of Eps15. Low light levels drove liquid-like assemblies, restoring normal rates of endocytosis in mammalian Eps15-knockout cells. By contrast, initiator proteins formed solid-like assemblies upon exposure to higher light levels, which stalled vesicle budding, probably owing to insufficient molecular rearrangement. These findings suggest that liquid-like assembly of initiator proteins provides an optimal catalytic platform for endocytosis.


Conflict of interest statement

Competing Interests

The authors declare no competing interests.

Figures

Extended Data Figure 1:
Extended Data Figure 1:. Fcho2 assembles into protein-rich domains with Eps15 on membranes and in solution.
(a-e) Fcho2 is labeled with Atto-594. Eps15 contains an N-terminal 6xHis tag and is labeled with CF488a. (a-b) Center slices (upper panels) and corresponding z-projections (lower panels) of representative GUVs incubated with 500 nM of the indicated protein(s). GUVs contain 79% DOPC, 15% DOPS, 5% PtdIns(4,5)P2, and 1% DPEG10-biotin. (a) Full-length Fcho2 alone decorates GUVs homogeneously. (b) GUVs incubated with both Fcho2 and Eps15 display protein-rich domains. (c) 7 μM Fcho2 clusters into small, irregular aggregates. (d) When combined at a 1:34 ratio, Fcho2 and Eps15 colocalize in protein droplets. (e) Time course of a fusion event between droplets containing Fcho2 (magenta) and Eps15 (green). Scale bars are 5 μm in a-c, e and 10 μm in d.
Extended Data Figure 2:
Extended Data Figure 2:. Eps15 and Fcho1 co-localize in protein-rich domains on membrane surfaces.
Normalized intensity of Fcho1 and Eps15 signal along the dashed lines in GUV and multibilayer images from Figures 1d and 2f. See Source Data Extended Data Figure 2.
Extended Data Figure 3:
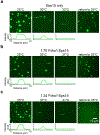
Extended Data Figure 3:. Eps15/Fcho1 droplet:solution partitioning decreases at increasing temperature.
(a-c) Representative images of protein droplets at increasing temperatures, followed by the return to room temperature after heat removal. Plots show fluorescence intensity of Eps15-CF488a measured along dotted lines in each image. Intensity is normalized to the maximum value in the first 25°C panel for each set of images. Fcho1 is unlabeled. Total protein concentration is held at 7 μM while Fcho1:Eps15 ratio is varied. Droplets are formed from (a) 7 μM Eps15, (b) 0.1 μM Fcho1, 6.9 μM Eps15, and (c) 0.2 μM Fcho1, 6.8 μM Eps15. See Source Data Extended Data Figure 3.
Extended Data Figure 4:
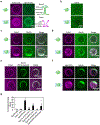
Extended Data Figure 4:. Eps15 mutants and Fcho1 assemble to varying degrees in solution.
(a-c) Fcho1 is labeled with Atto-594, Eps15 mutants are labeled with CF488a. Panels on the left show 7 μM Eps15 mutant alone, set of panels on the right show 6.8 μM Eps15 mutant combined with 0.2 μM Fcho1 (34:1). Cartoons depict binding interaction between Fcho1 and Eps15 mutants. (a) Eps15 lacking the EH domains (Eps15-Δ3xEH) does not form droplets on its own, but when combined with Fcho1 forms small droplets. (b) Eps15 lacking the C-terminal disordered domain (Eps15-ΔCTD) does not form droplets on its own and addition of Fcho1 does not induce droplet formation, reinforcing that the CTD of Eps15 mediates its interaction with Fcho1. (c) Eps15 containing mutated Fcho1-binding DPF motifs (amino acids 623-636; Eps15-DPF>APA) robustly assembles into droplets on its own and co-assembles into droplets with Fcho1, presumably because the disordered domains of Eps15 and Fcho1 interact even in the absence of 3 key DPF motifs. Scale bar is 10 μm.
Extended Data Figure 5:
Extended Data Figure 5:. Controls for Eps15-Cry2 cell experiments.
(a) Left: whole cell lysates from WT SUM159/AP-2-HaloTag cells and WT SUM159/AP-2-HaloTag cells gene edited by CRISPR to disrupt Eps15 were separated by SDS-PAGE and immunoblotted for Eps15 and GAPDH. Right: whole cell lysates from WT SUM159/AP-2-HaloTag cells and WT SUM159/AP-2-HaloTag cells transfected with siRNA against Eps15R were collected 24 hours post-transfection. Proteins were separated by SDS-PAGE and immunoblotted for Eps15R and GAPDH. (b) Itsn1-mCherry (upper panels), Fcho1-mCherry (lower panels), Eps15-Cry2-GFP, and AP2-HaloTag conjugated to JF646 colocalize in Eps15Δ cells expressing Eps15-Cry2 and exposed to low blue light levels. White arrowheads indicate examples of colocalization in endocytic structures. Notably, Fcho1-mCherry/Eps15-Cry2-GFP co-expression often resulted in the formation of large, persistent aggregates on the plasma membrane, denoted by yellow arrowheads. Scale bar is 5 μm. (c) The lifetime distributions of AP-2 σ2-HaloTag-labeled endocytic structures in Eps15 knockout cells expressing Eps15-mCherry and in wild-type Eps15 cells are nearly identical. (d) The average plasma membrane fluorescence intensity of AP-2 σ2-HaloTag::JF646 and Eps15-mCherry in the first frame of each movie analyzed in a and Figure 4. Eps15Δ n=10 biologically independent cell samples, 25,269 pits. WT Eps15 n=10 biologically independent cell samples, 8,969 pits. No light n=11 biologically independent cell samples, 21,996 pits. Low light n=17 biologically independent cell samples, 14,222 pits. Strong light n=12 biologically independent cell samples, 13,978 pits. (e) Lifetime distributions of clathrin-coated structures in Eps15Δ/Eps15R knockdown cells expressing Eps15-Cry2 at no, low, or strong blue light exposure. Plots show frequency of short-lived (<20 s, magenta), productive (20-180 s, gray), and long-lived (>180 s, yellow) structures for each condition. No blue light exposure resulted in 42 ± 3% (SEM) of CCPs being short-lived (<20 s). Low blue light exposure significantly reduced the frequency of short-lived CCPs from 42 ± 3% to 36 ± 4% (t-test, p=0.042, n=5, 5). While 2-3% of pits were long-lived (>180 s) in cells exposed to no or low blue light, the frequency of long-lived pits increased significantly to 6 ± 1% (t-test, p=0.009, n=5, 5) in cells exposed to strong blue light. No light n=5 biologically independent cell samples, 31,427 pits. Low light n=5 biologically independent cell samples, 27,026 pits. Strong light n=5 biologically independent cell samples, 17,623 pits. (f) The lifetime distributions of AP-2 σ2-HaloTag-labeled endocytic structures in Eps15 knockout cells expressing Eps15-mCherry exposed to either no blue light or 50 μW “strong” blue light are nearly identical. (g) Plot from Fig. 6f and (h) plot from Fig. 6h displaying the individual data points that were averaged together for each FRAP curve. n=5-6 biologically independent samples. Data are presented as mean ± SEM. See Source Data Extended Data Figure 5.
Extended Data Figure 6.
Extended Data Figure 6.. The assembly state of initiator proteins impacts CME dynamics.
When Eps15 (green) and Fcho1 (magenta) exist in an unassembled, or dilute phase on the membrane surface, abortive structures are favored. In productive structures, Eps15 and Fcho1 assemble into a liquid protein phase capable of exchange with molecules in solution. Further assembly of Eps15 and Fcho1 into a gel or solid phase limits molecular exchange and promotes stalled endocytic structures.
Figure 1.
Figure 1.. Eps15 and Fcho1 assemble into protein-rich domains on membrane surfaces.
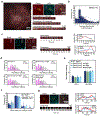
(a-d) Center slices (top) and corresponding z-projections (bottom) of representative GUVs incubated with 500 nM of the indicated protein(s): Atto-594-labeled Fcho1 and CF488a-labeled Eps15 variants. Eps15 variants contain an N-terminal 6xHis tag. GUVs contain 79% DOPC, 15% DOPS, 5% PtdIns(4,5)P2, and 1% DPEG10-biotin unless otherwise indicated. (a) Full-length Fcho1 alone on GUVs, (left) and full-length Eps15 alone on GUVs containing 97% DOPC, 2% DOGS-NTA-Ni, 1% DPEG10-biotin (center). Cartoons (right) depict domain organization of Fcho1 and Eps15 dimeric forms. (c) GUVs incubated with both Fcho1 and Eps15 display a single protein-rich domain or (d) several protein-rich domains. (e) Two representative center slices of GUVs bound with Eps15 lacking the 6x histidine tag and Fcho1, which co-assemble into protein-rich domains on the membrane (left). Domains were observed on 83 ±2% (SEM) of GUVs (49 GUVs, n=4 biologically independent experiments). (f) GUVs labeled with 0.1% Texas Red-DHPE lipid were incubated with 500 nM each of CF488a-labeled Eps15 and unlabeled Fcho1. (g) Frequency of GUVs displaying protein-rich domains for each set of proteins. GUVs were counted as displaying protein-rich domains if they contained distinct regions in which protein signal intensity differed by at least 2-fold and the bright region covered at least 10% of the GUV surface in any z-slice. For each bar, n=4 biologically independent experiments with at least 40 total GUVs for each condition. All GUV experiments were conducted at room temperature, 22°C. Scale bars are 5 μm. Data are presented as mean ± SEM. See Source Data Figure 1.
Figure 2.
Figure 2.. Eps15 and Fcho1 require multivalent interactions to assemble on membrane surfaces.
(a-e) 500 nM of the indicated proteins were incubated with GUVs containing 79% DOPC, 15% DOPS, 5% PtdIns(4,5)P2, and 1% DPEG10-biotin. Upper panels display single center z-slices, lower panels display maximum-projected z-stacks. Fcho1 is labeled with Atto594. 6xHis-Eps15 variants are labeled with CF488a. Cartoons depict binding interaction between Fcho1 and Eps15 mutants. (a) GUVs incubated with Fcho1 and Eps15 lacking the coiled-coil domain (Eps15-ΔCC). (b) Fcho1 and Eps15 lacking the EH domains (Eps15-Δ3xEH) occasionally co-assemble into small protein-rich domains. (c) Eps15 lacking the C-terminal disordered domain (Eps15-ΔCTD) is not recruited to GUV surfaces by Fcho1. (d) Eps15 containing mutated Fcho1-binding DPF motifs (amino acids 623-636; Eps15-DPF>APA) co-assembles with Fcho1 into small protein-rich domains. (e) Without Fcho1, Eps15 mutants decorate GUVs homogeneously. GUVs contain 97% DOPC, 2% DOGS-NTA-Ni, 1% DPEG10-biotin. (f-h) Multibilayers containing 73% DOPC, 25% DOPS, and 2% DOGS-NTA-Ni were incubated with 100 nM Atto594-labeled Fcho1, or 100 nM CF488a-labeled Eps15, or both. (f) Fcho1 and Eps15 individually decorate multibilayers homogeneously. When combined, Fcho1 and Eps15 form micron-scale protein-rich regions. (g) Time course of protein-rich Eps15/Fcho1 domains merging on a multibilayer, 6 s intervals. (h) Representative images and plot of fluorescence recovery after bleaching Eps15 (green)/Fcho1 (unlabeled) protein domains on multibilayers. n=3 biologically independent samples. All experiments were conducted at room temperature, 22°C. Scale bars are 5 μm (a-f), or 2 μm (g-h). Data are presented as mean ± SEM. See Source Data Figure 2.
Figure 3:
Figure 3:. Eps15 and Fcho1 co-assemble into liquid-like protein droplets.
Fcho1 is labeled with Atto-594, Eps15 or Eps15-ΔCC is labeled with CF488a. All droplet experiments are at pH 7.5, 150 mM NaCl with 3% PEG. (a) 7 μM Eps15 forms large, rounded droplets, 7 μM Fcho1 clusters into small, irregular aggregates. Insets show cartoon of inferred protein network assembly within droplets. (b) Time course of Eps15-only droplets (upper panels) undergoing fusion (arrowheads) and Fcho1-only aggregates (lower panels) approaching each other but failing to fuse. (c) Representative images of fluorescence recovery after bleaching an Eps15-only droplet (upper panels) and an Fcho1-only droplet (lower panels). Plot displays fluorescence recovery curves for each. n=6 biologically independent samples. (d) Phase diagram of Eps15/Fcho1 droplets mapped by CF488a-labeled Eps15 fluorescence intensity. Stars denote critical points for each set of Eps15:Fcho1 ratios. CS and CD indicate the concentration of Eps15 in solution and in droplets, respectively. Horizontal tie lines connect CS and CD for a given temperature. Total protein was held constant at 7 μM. n=3 biologically independent experiments. (e) When combined at a 1:34 ratio, Fcho1 and Eps15 co-localize in protein droplets. Inset shows cartoon of inferred protein network assembly within droplets, Fcho1 in magenta and Eps15 in green. (f) Time course of three fusion events (arrowheads) between droplets containing unlabeled Fcho1 and labeled Eps15. (g) Representative images and plot of fluorescence recovery after bleaching a Fcho1 and Eps15 droplet. n=4 biologically independent samples. All experiments were conducted at room temperature, 22°C, except as noted in d. All data are presented as mean ± SEM. See Source Data Figure 3.
Figure 4:
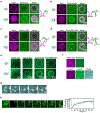
Figure 4:. Eps15 can be engineered to assemble into liquid-like protein droplets.
(a) Like 6xHis-Eps15, Eps15 lacking the 6x histidine tag forms droplets at a concentration of 4 μM, but does not form droplets at 3 μM. (b) Time course of protein phase separation induced by the addition of Fcho1 to Eps15. (c) At a 1 to 34 ratio, Fcho1 and Eps15-ΔCC do not co-assemble into droplets. (d) Diagram of Eps15-Cry2 chimera in which the Eps15 coiled-coil domain is replaced with the Cry2 PHR domain. Blue light exposure drives oligomeric association of Cry2 PHR domains. (e) 5 μM Atto594-labeled Eps15-Cry2 forms small, irregular aggregates in the absence of blue light. (f) In the absence of blue light, 1 μM Eps15 labeled with CF488a (green) and 3 μM Eps15-Cry2 labeled with Atto594 (magenta) are in a single dilute phase (left). Addition of blue light triggers droplet formation (right). Inset shows cartoon of inferred protein network assembly within blue-light induced droplets containing Eps15 and Eps15-Cry2. (g-h) 0.12 μM Atto594-labeled Fcho1 (magenta), 3 μM CF488a-labeled Eps15 (green), and 1 μM Atto647N-labeled Eps15-Cry2 (blue) were combined in solution and exposed to low blue light for 500 ms every 2 s for 1 minute. (g) Fcho1, Eps15, and Eps15-Cry2 colocalize in droplets after exposure to blue light. (h) Time course of fusion between Fcho1, Eps15, and Eps15-Cry2 droplets exposed to low blue light. (i) Recovery of Eps15 fluorescence after bleaching whole Eps15-Cry2/Eps15 droplets, labeled as in (f), is similar to the recovery of Eps15 in WT Eps15/Fcho1 droplets (from Fig. 2d). n=3 biologically independent samples. All experiments were conducted at room temperature, 22°C. Data are presented as mean ± SEM. See Source Data Figure 4.
Figure 5:
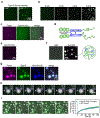
Figure 5:. Lifetimes of endocytic pits correspond to abortive, productive, or stalled events.
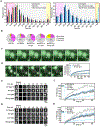
(a) Representative image of a cell expressing gene-edited AP-2 σ2-HaloTag:JF646 (cyan) and Eps15-mCherry (red). Large inset highlights three representative clathrin-coated structures shown in smaller insets: abortive (magenta), productive (gray), and stalled (yellow) structures lasting 18 s, 96 s, and > 10 min, respectively. (b) Histogram of the distribution of the difference in arrival times between Eps15-mCherry and AP-2 σ2-HaloTag:JF646 in endocytic structures in Eps15 knockout cells. Positive times indicate that Eps15 signal appeared before AP-2 signal. n=11 biologically independent cell samples. (c) Representative image of a cell expressing gene-edited AP-2 σ2-HaloTag:JF646 (cyan) and Dyn2-mCherry (red). Representative abortive (magenta) and productive (gray) clathrin-coated structures are indicated by the boxes and shown in smaller insets. Line plots show intensity measurements for the abortive (top) and productive (bottom) pit. (d) Histograms of the distribution of Dyn2 max./mean intensity. (WT Eps15: 1,394 pits; Eps15-Cry2, no light: 1,350 pits; Eps15-Cry2, low light: 1,310 pits; Eps15-Cry2, strong light: 1,507 pits.) (e) Median distribution of Dyn2 max./mean intensity for each lifetime cohort for each light condition. n= 5 biologically independent cell samples. (f) Histogram of the distribution of Dyn2 peaks per endocytic event among productive (20-180 s) events in cells expressing WT Eps15 compared to long-lived (>180 s) events in cells expressing Eps15-Cry2 and exposed to strong light. n= 5 biologically independent cell samples. (g) A typical long-lived clathrin-coated structure is indicated by the yellow box and shown in lower panels over time. Line plots show intensity measurements of AP-2 and Dyn2 for two representative clathrin-coated structures. Dyn2 signal was variable in long-lived structures and often displayed either a single peak at the end of an event (top plot) or no distinct peak (bottom plot). All data are presented as mean ± SEM. See Source Data Figure 5.
Figure 6:
Figure 6:. Liquid-like assemblies of initiator proteins optimize the productivity of CME.
(a) Histogram of lifetime distributions of clathrin-coated structures, shaded to indicate lifetimes corresponding to abortive, productive, and stalled structures. For each condition, cells lack endogenous Eps15 and express either WT Eps15, no Eps15 (Eps15Δ), or Eps15-Cry2 at no, low, or strong blue light exposure. Eps15Δ n=10 biologically independent cell samples, 25,269 pits. WT Eps15 n=10 biologically independent cell samples, 8,969 pits. No light n=11 biologically independent cell samples, 21,996 pits. Low light n=17 biologically independent cell samples, 14,222 pits. Strong light n=12 biologically independent cell samples, 13,978 pits. (b) Lifetime distributions shown in (a) by type of structure. (c) Time course of droplets containing 0.12 μM Atto594-labeled Fcho1 (magenta), 3 μM CF488a-labeled Eps15 (green), and 1 μM Atto647N-labeled Eps15-Cry2 (blue) after 1 minute strong blue light exposure. (d) Recovery of CF488a-labeled Eps15 fluorescence after bleaching an Eps15-Cry2/Eps15 droplet after 1 minute strong blue light exposure. n= 3 biologically independent samples. Plot compares recovery to that of the droplet in Fig. 4i (Low light). All droplet experiments were conducted at room temperature, 22°C. (e) Representative images of fluorescence recovery of Eps15-mCherry (top row) or Eps15-Cry2-mCherry in clathrin-coated structures in cells under no, low, or strong blue light exposure. (f) Average fluorescence recovery of Eps15 or Eps15-Cry2 for each condition shown in e. n=6 biologically independent samples. Mobile fractions: 57 ± 5%, 95 ± 4%, 65 ± 4%, 24 ± 2%, respectively. Plot with data points is in Extended Data Fig. 5g. (g) Representative images of fluorescence recovery of AP-2-HaloTag:JF646 in clathrin-coated structures in cells expressing Eps15-mCherry (top row) or Eps15-Cry2-mCherry under no, low, or strong blue light exposure. (h) Average fluorescence recovery of AP-2-HaloTag:JF646 for each condition shown in g. n=6 biologically independent samples. Mobile fractions: 71 ± 10%, 121 ± 9%, 78 ± 8%, 24 ± 3%, respectively. Plot with data points is in Extended Data Fig. 5h. All data are presented as mean ± SEM. See Source Data Figure 6.

Comment in

Similar articles

Cited by

References

    1. Henne WM et al. FCHo Proteins Are Nucleators of Clathrin-Mediated Endocytosis. Science 328, 1281–1284 (2010). - PMC - PubMed
    1. Taylor MJ, Perrais D & Merrifield CJ A High Precision Survey of the Molecular Dynamics of Mammalian Clathrin-Mediated Endocytosis. PLoS Biology 9, e1000604 (2011). - PMC - PubMed
    1. Wang L, Johnson A, Hanna M & Audhya A Eps15 membrane-binding and-bending activity acts redundantly with Fcho1 during clathrin-mediated endocytosis. Molecular biology of the cell 27, 2675–2687 (2016). - PMC - PubMed
    1. Sengar AS, Wang W, Bishay J, Cohen S & Egan SE The EH and SH3 domain Ese proteins regulate endocytosis by linking to dynamin and Eps15. The EMBO Journal 18, 1159–1171 (1999). - PMC - PubMed
    1. Mayers JR et al. Regulation of ubiquitin-dependent cargo sorting by multiple endocytic adaptors at the plasma membrane. Proceedings of the National Academy of Sciences 110, 11857–11862 (2013). - PMC - PubMed

Methods References

    1. Kennedy MJ et al. Rapid blue-light-mediated induction of protein interactions in living cells. Nat. Methods 7, 973–975 (2010). - PMC - PubMed
    1. Zeno WF, Rystov A, Sasaki DY, Risbud SH & Longo ML Crowding-Induced Mixing Behavior of Lipid Bilayers: Examination of Mixing Energy, Phase, Packing Geometry, and Reversibility. Langmuir 32, 4688–4697 (2016). - PMC - PubMed
    1. Ran FA et al. Genome engineering using the CRISPR-Cas9 system. Nat Protoc 8, 2281–2308 (2013). - PMC - PubMed
    1. Aguet F, Antonescu CN, Mettlen M, Schmid SL & Danuser G Advances in Analysis of Low Signal-to-Noise Images Link Dynamin and AP2 to the Functions of an Endocytic Checkpoint. Developmental Cell 26, 279–291 (2013). - PMC - PubMed

Publication types