. 2021 Apr;23(4):424-436.
doi: 10.1038/s41556-021-00652-7. Epub 2021 Apr 5.

PANDORA-seq expands the repertoire of regulatory small RNAs by overcoming RNA modifications

Affiliations

PANDORA-seq expands the repertoire of regulatory small RNAs by overcoming RNA modifications

Junchao Shi et al. Nat Cell Biol. 2021 Apr.

Erratum in

Abstract

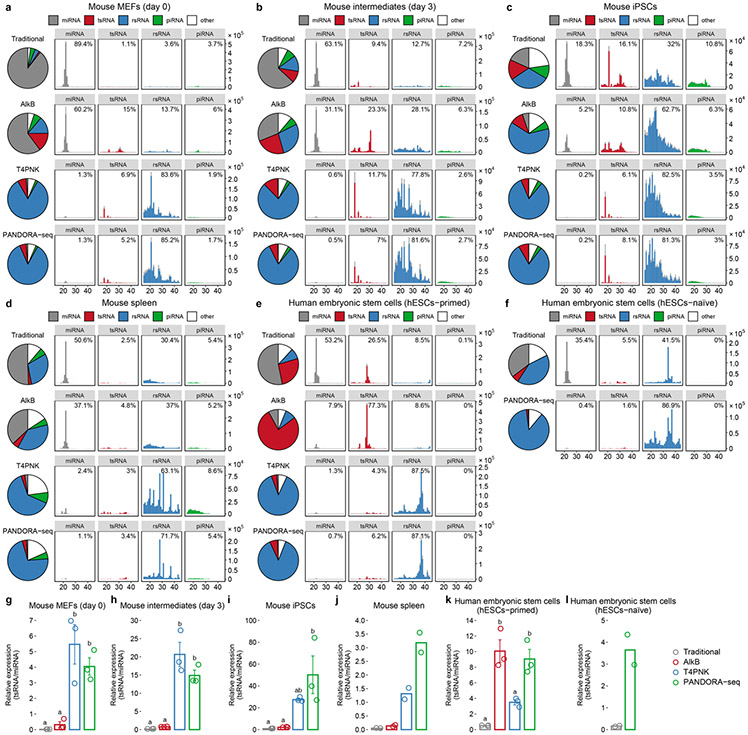
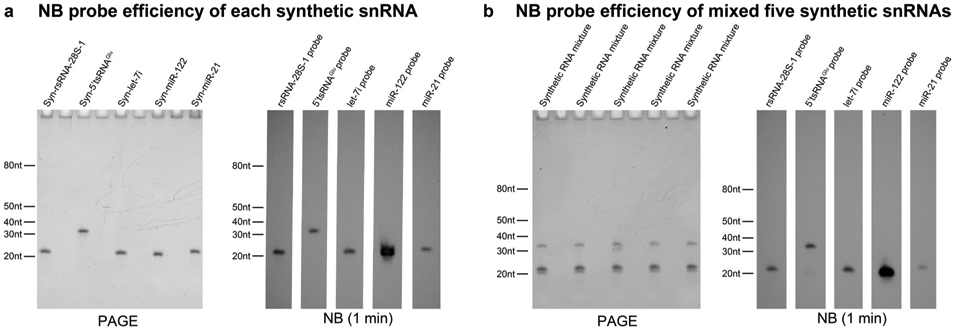
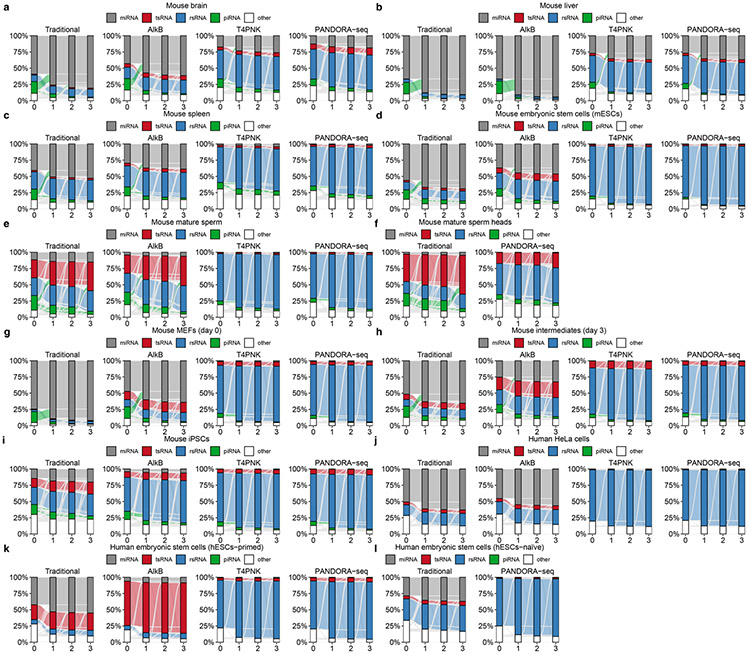
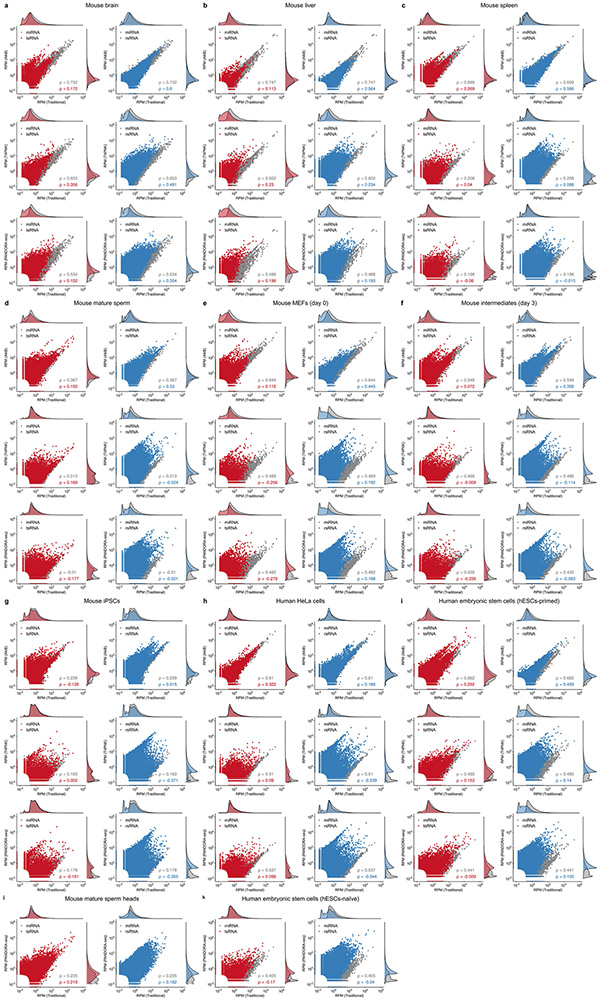
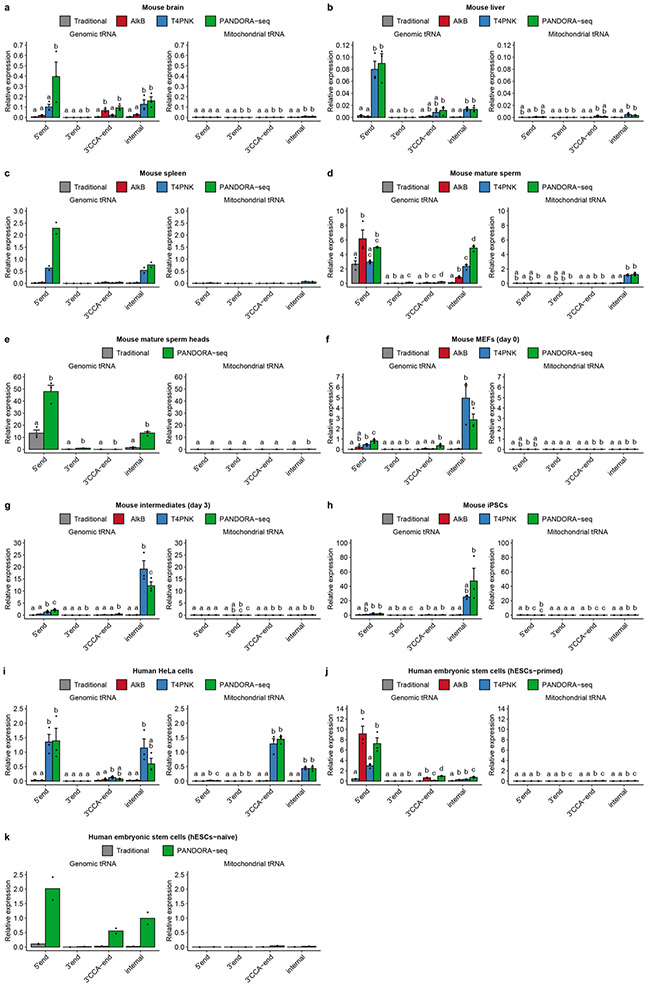
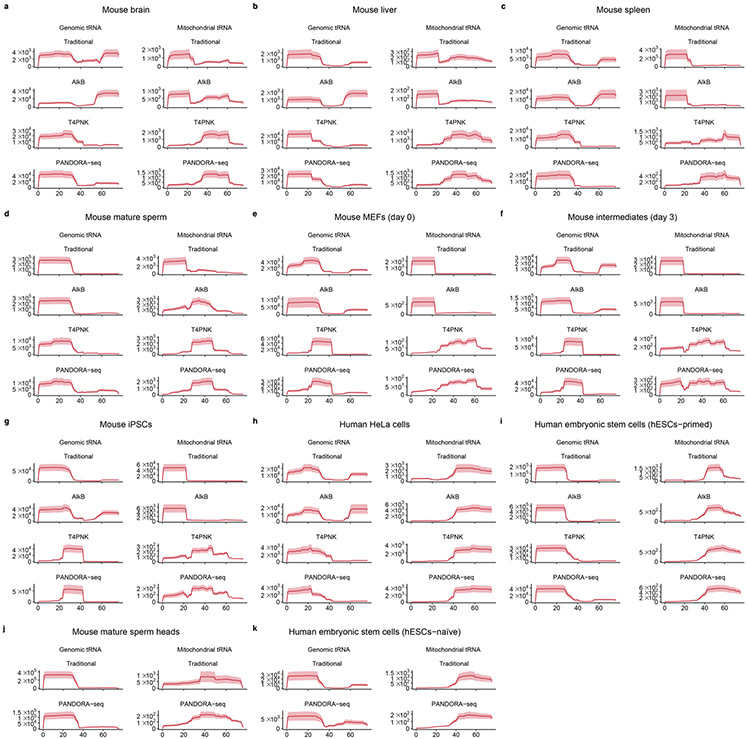
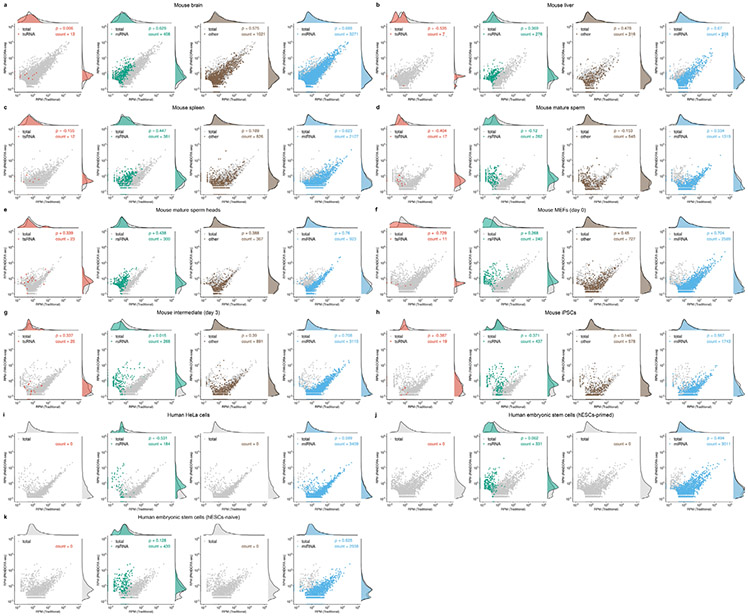
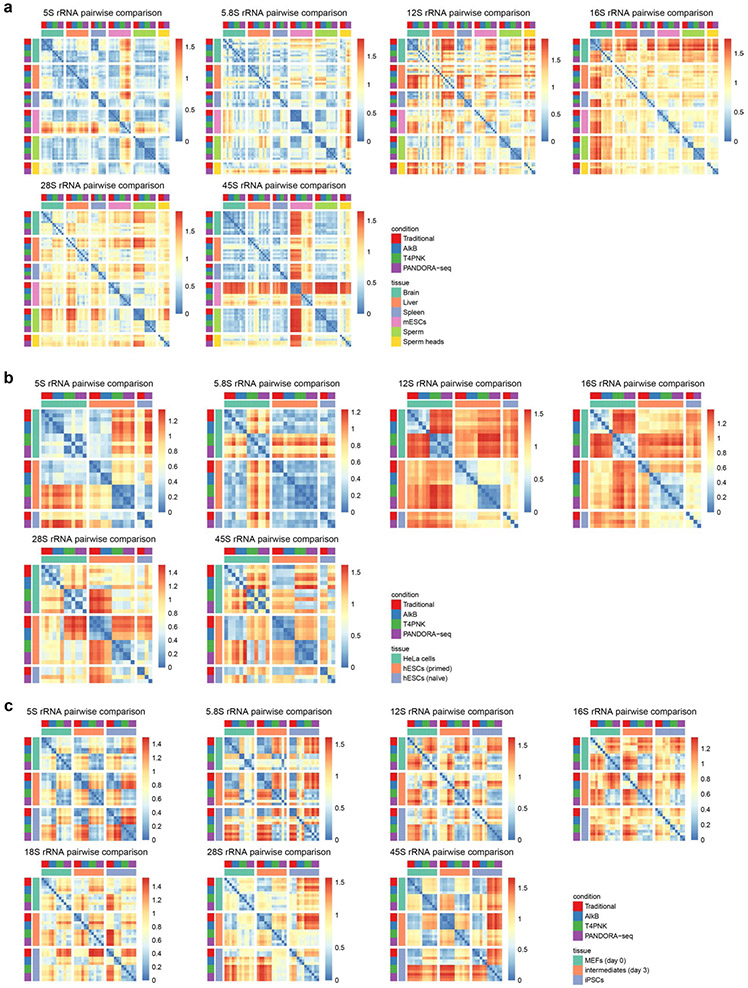
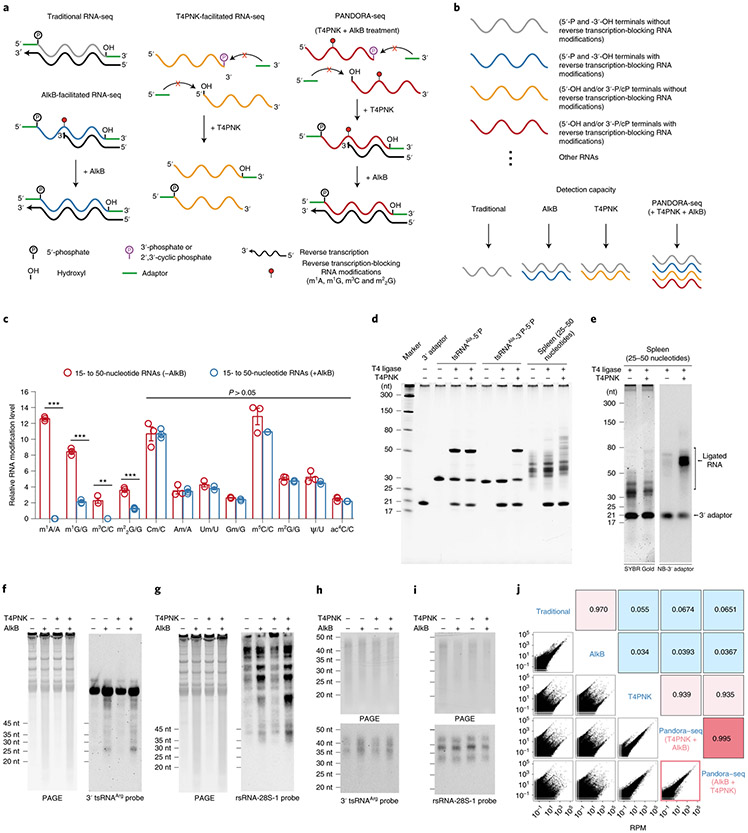
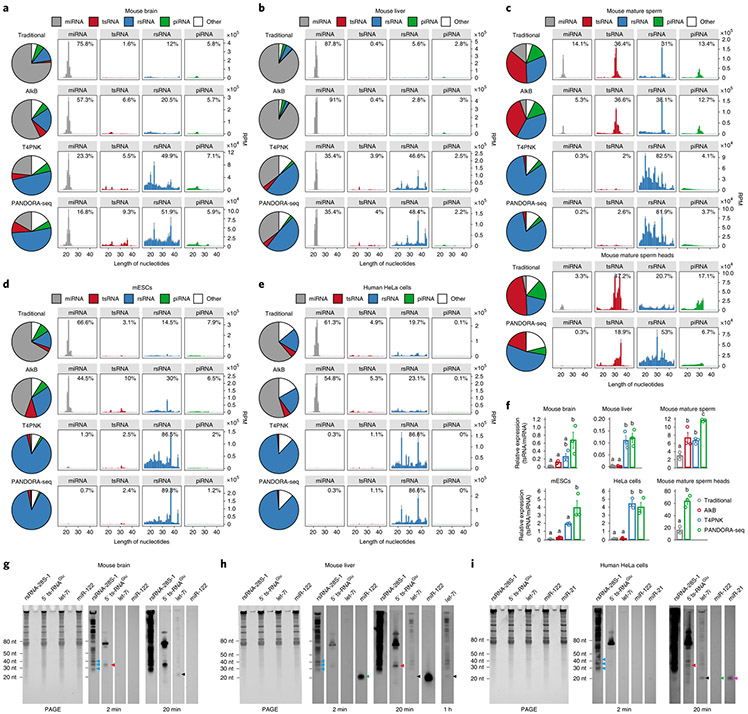
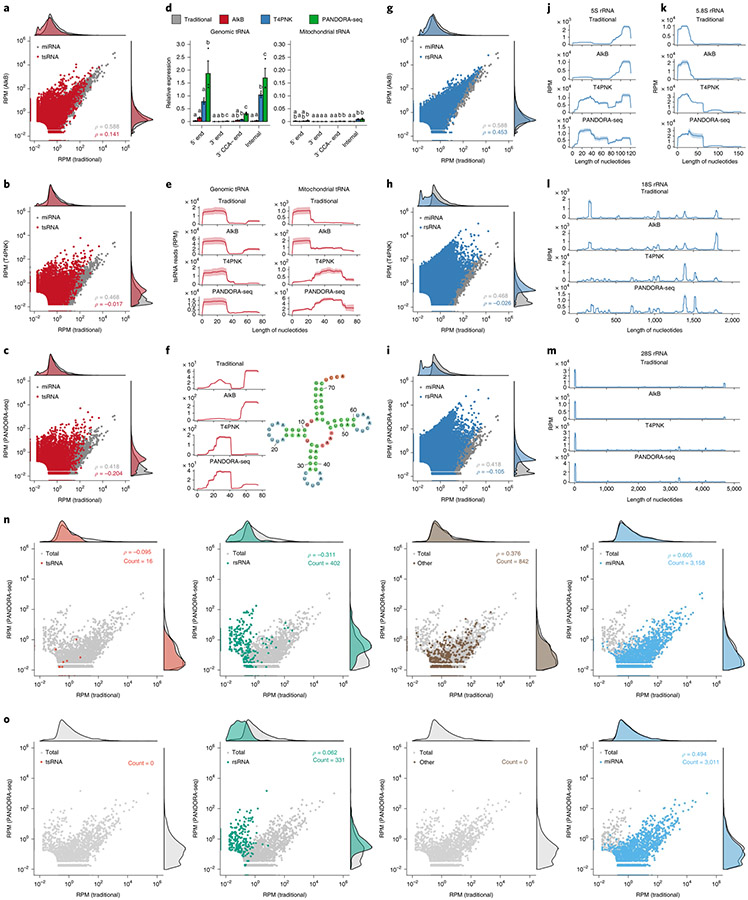
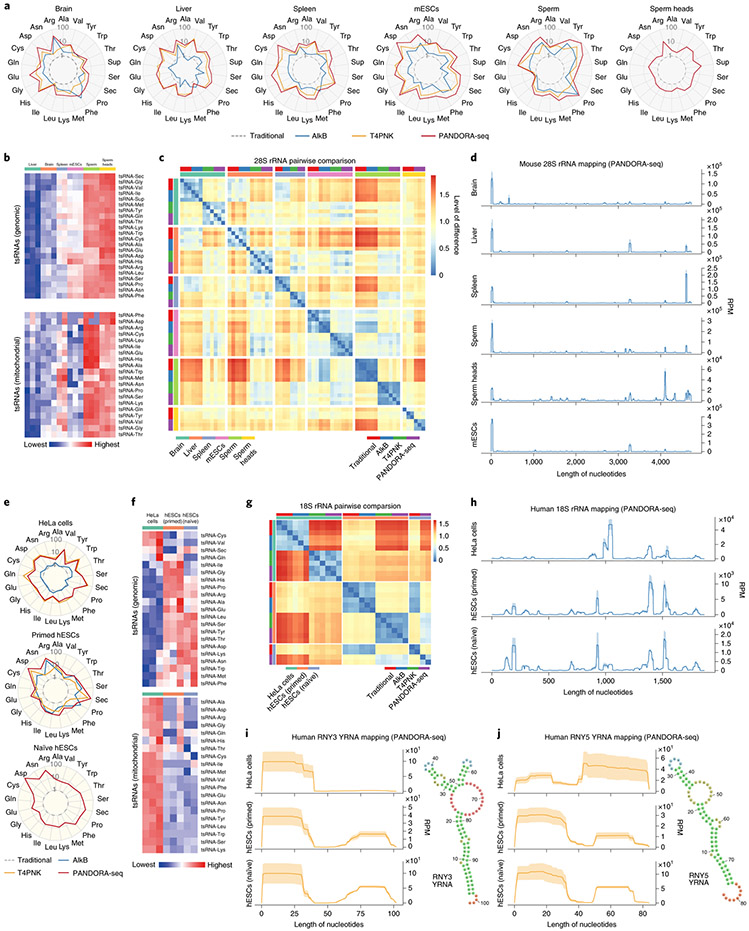
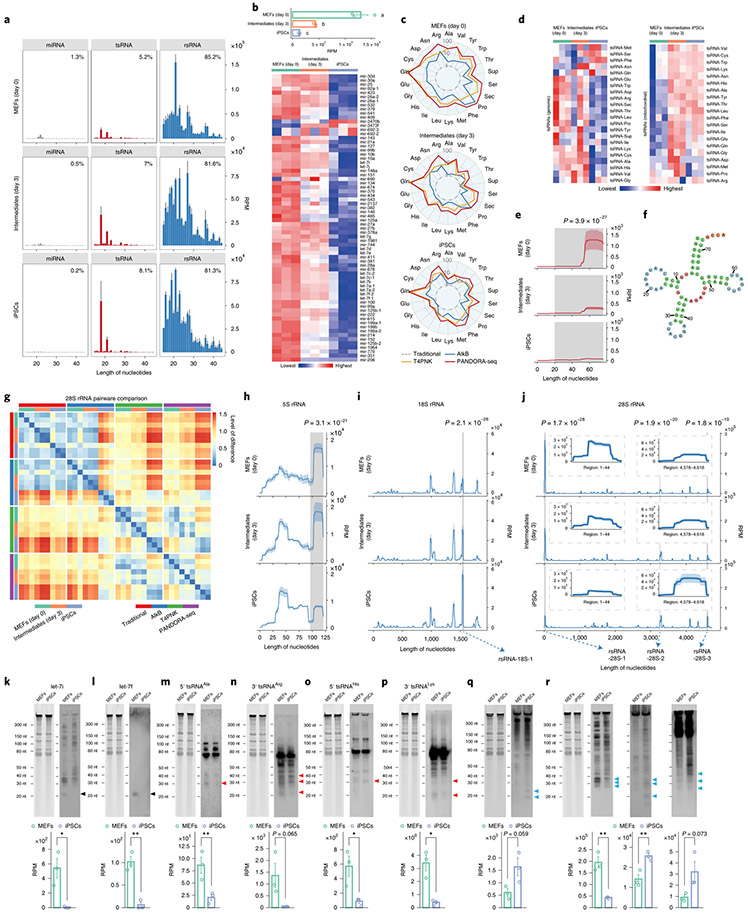
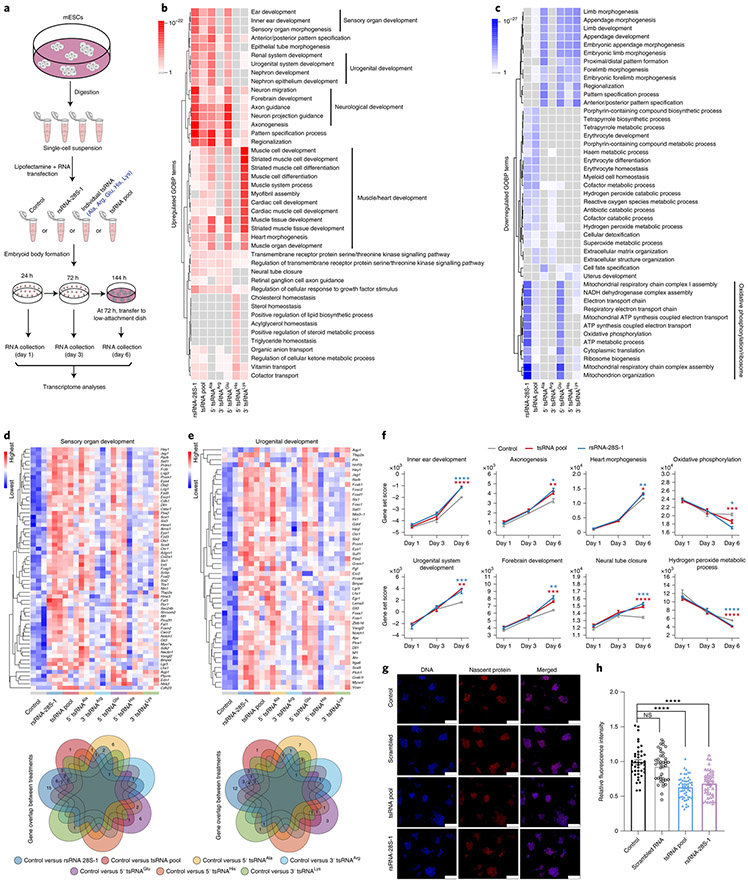
Although high-throughput RNA sequencing (RNA-seq) has greatly advanced small non-coding RNA (sncRNA) discovery, the currently widely used complementary DNA library construction protocol generates biased sequencing results. This is partially due to RNA modifications that interfere with adapter ligation and reverse transcription processes, which prevent the detection of sncRNAs bearing these modifications. Here, we present PANDORA-seq (panoramic RNA display by overcoming RNA modification aborted sequencing), employing a combinatorial enzymatic treatment to remove key RNA modifications that block adapter ligation and reverse transcription. PANDORA-seq identified abundant modified sncRNAs-mostly transfer RNA-derived small RNAs (tsRNAs) and ribosomal RNA-derived small RNAs (rsRNAs)-that were previously undetected, exhibiting tissue-specific expression across mouse brain, liver, spleen and sperm, as well as cell-specific expression across embryonic stem cells (ESCs) and HeLa cells. Using PANDORA-seq, we revealed unprecedented landscapes of microRNA, tsRNA and rsRNA dynamics during the generation of induced pluripotent stem cells. Importantly, tsRNAs and rsRNAs that are downregulated during somatic cell reprogramming impact cellular translation in ESCs, suggesting a role in lineage differentiation.


Figures

Extended Data Fig. 1 ∣
Extended Data Fig. 1 ∣. Reads summary and length distributions of different sncRNA category under Traditional RNA-seq, AlkB-facilitated RNA-seq, T4PNK-facilitated RNA-seq, and PANDORA-seq.
Showing Reads summary and length distributions of different sncRNA category in six tissue/cell types that are not shown in Fig. 3 because of space limitation. (a-c) Cells during mouse somatic cell reprogramming to iPSC: (a) MEFs (day 0), (b) intermediates (day 3), (c) iPSCs; (d) mouse spleen, (e) primed human embryonic stem cells (hESCs-primed), and (f) naïve human embryonic stem cells (hESCs-naïve) (g-l) the relative tsRNA/miRNA ratio under different protocols. for g,h,I,k, mean ± SEM, n=3 biologically independent samples in each bar; for j,l, n=2 biologically independent samples in each bar; different letters above bars indicate statistical difference, P < 0.05; same letters indicate P ≥ 0.05 (two-sided, one-way ANOVA, uncorrected Fisher’s LSD test). Statistical source data and the precise P values are provided in Source Data Extended Data Fig. 1.
Extended Data Fig. 2 ∣
Extended Data Fig. 2 ∣. Evaluation of Northern blot probe efficiency on synthesized targets (that is, rsRNA-28S-1, 5′tsRNAGlu, let-7i, mir-122, mir-21).
The Northern blot probes used for each target are the same as used in main Fig. 2g-i. a, each synthetic sncRNAs are individually loaded on PAGE followed by Northern blots analyses. b, the five synthetic sncRNAs were mixed together with the amount tested in (a) and then equally separated and loaded on PAGE followed by Northern blots analyses. The relative efficiency of each NB probe can be shown: the probe efficiency between let-7i, tsRNAGlu and rsRNA-28 are similar; the probe for mir-122 is highest, while the probe for mir-21 has the lowest efficiency. Similar results were obtained in 3 independent experiments. The unprocessed blots are provided in Source Data Extended Data Fig. 2.
Extended Data Fig. 3 ∣
Extended Data Fig. 3 ∣. Annotation of mouse piRNA in non-germ cell tissue/cell types is not stable when 1–3 mismatches are allowed.
When 1–3 mismatches are allowed for sncRNAs matching, the piRNA annotation rate (but not other sncRNAs types) show significant decrease in mouse tissue/cell types (a) mouse brain, (b) mouse liver, (c) mouse spleen, (d) mouse embryonic stem cells, (e) mouse mature sperm, (f) mouse mature sperm heads, (g) mouse MEFs (day 0), (h) mouse intermediate cells (day 3), (i) mouse iPSCs. Very few piRNAs were annotated for human cell lines (j) human HeLa cells, (k) human hESCs-primed, and (l) human hESCs-naïve. These data suggest the annotated piRNAs in non-germ cell tissue/cell types could be due to database quality issue and their true identity awaits to be verified.
Extended Data Fig. 4 ∣
Extended Data Fig. 4 ∣. Scattered plot comparison of profile changes in tsRNAs and rsRNAs compared to miRNAs under different treatment protocol.
Scattered plot comparison of profile changes in tsRNAs (red dots) and rsRNAs (blue dots) compared to miRNAs (gray dots) under AlkB vs traditional, T4PNK vs traditional and PANDORA-seq vs traditional in (a) mouse brain, (b) mouse liver, (c) mouse spleen, (d) mouse mature sperm, (e) mouse MEFs (day 0), (f) mouse intermediate cells (day 3), (g) mouse iPSCs, (h) human HeLa cells, (i) human hESCs-primed, (j) mouse mature sperm heads, and (k) human hESCs-naïve.
Extended Data Fig. 5 ∣
Extended Data Fig. 5 ∣. The tsRNA responses to AlkB, T4PNK and PANDORA-seq in regard to different tsRNA origin (5′tsRNA, 3′tsRNA, 3′tsRNA with CCA end, and internal tsRNAs).
a, mouse brain, (b) mouse liver, (c) mouse spleen, (d) mouse mature sperm, (e) mouse mature sperm heads, (f) mouse MEFs (day 0), (g) mouse intermediate cells (day 3), (h) mouse iPSCs, (i) human HeLa cells, (j) human hESCs-primed, and (k) human hESCs-naïve. For a-b,d-j, data are plotted as mean ± SEM (n=3 biologically independent samples in each bar); for c,k, n=2 biologically independent samples in each bar. Different letters above bars indicate statistical difference, P < 0.05; same letters indicate P ≥ 0.05 (two-sided, one-way ANOVA, uncorrected Fisher’s LSD test). Statistical source data and the precise P values are provided in Source Data Extended Data Fig. 5.
Extended Data Fig. 6 ∣
Extended Data Fig. 6 ∣. Overall length mapping of tsRNA reads in genomic and mitochondrial tRNA under different RNA-seq protocol.
Overall mapping of all tsRNAs on a tRNA length scale revealed the preferential loci from which tsRNAs are derived from the mature full tRNA under traditional protocol and different enzymatic treatments. a, mouse brain, (b) mouse liver, (c) mouse spleen, (d) mouse mature sperm, (e) mouse MEFs (day 0), (f) mouse intermediate cells (day 3), (g) mouse iPSCs, (h) human HeLa cells, (i) human hESCs-primed, (j) mouse mature sperm heads, and (k) human hESCs-naïve. Mapping plots are presented as mean ± SEM.
Extended Data Fig. 7 ∣
Extended Data Fig. 7 ∣. The miRNAs that showing sensitive response to PANDORA-seq are in fact rsRNAs.
Previously annotated miRNAs from miRbase that showing upregulation under PANDORA-seq could also annotated to rsRNAs (with one mismatch tolerance), as shown in (a) mouse brain, (b) mouse liver, (c) mouse spleen, (d) mouse mature sperm, (e) mouse mature sperm heads, (f) mouse MEFs (day 0), (g) mouse intermediate cells (day 3), (h) mouse iPSCs, (i) human HeLa cells, and (j) human hESCs-naïve.
Extended Data Fig. 8 ∣
Extended Data Fig. 8 ∣. The pairwise comparison matrices showing the differential expression pattern of rsRNAs under different RNA-seq protocol across tissues and cells.
a, Pairwise comparison matrices for six mouse tissue/cell types, including 5S rRNA, 5.8S rRNA, mitochondrial 12S rRNA, mitochondrial 16S rRNA, 28S rRNA and 45S rRNA. Color bar: from blue (more similar) to red (more different). b, Pairwise comparison matrices for three human cell types, including 5S rRNA, 5.8S rRNA, mitochondrial 12S rRNA, mitochondrial 16S rRNA, 28S rRNA and 45S rRNA. Color bar: from blue (more similar) to red (more different). c, Pairwise comparison matrices for during mouse iPSC reprogramming, including 5S rRNA, 5.8S rRNA, mitochondrial 12S rRNA, mitochondrial 16S rRNA, 18S rRNA, 28S rRNA and 45S rRNA. Color bar: from blue (more similar) to red (more different).
Extended Data Fig. 9 ∣
Extended Data Fig. 9 ∣. Northern blot analyses of tsRNA/rsRNA (that is, tsRNAAla, tsRNAArg, tsRNAGlu, tsRNAHis, tsRNALys and rsRNA-28S-1) changes during mESC to EB differentiation.
a, mESC vs Day6 EB; (b) mESC vs Day10 EB. Red arrowhead: tsRNAs; Blue arrowhead: rsRNAs. Similar results were obtained in 3 independent experiments for rsRNA-28S-1; and in 2 independent experiments for tsRNAAla, tsRNAArg, tsRNAGlu, tsRNAHis, and tsRNALys. The unprocessed blots are provided in Source Data Extended Data Fig. 9.
Extended Data Fig. 10 ∣
Extended Data Fig. 10 ∣. Expression heatmap of the differentially expressed genes from representative GOBP terms in Day6 and Enriched GOBP terms of differential expressed genes in Day3 EBs after tsRNA/rsRNA transfection.
a,b,c,d, Expression heatmap of the differentially expressed genes from the representative GOBP terms in Day3 EBs from Fig. 6b,c: (a) Neurological development; (b) Muscle/heart development; (c) Oxidative phosphorylation; (d) Translation/ribosome. Venn-diagram beneath each heatmap shows the numbers of overlapped dysregulated genes under different tsRNA/rsRNA transfection. e, Top-ranked upregulated GOBP terms in Day3 EBs after each tsRNA/rsRNA transfection compared to control. f, Top-ranked downregulated GOBP terms in Day3 EBs after each tsRNA/rsRNA transfection compared to control.
Fig. 1 ∣
Fig. 1 ∣. Schematic overview, validation of AlkB and T4PNK enzyme activity, and protocol optimization of PANDORA-seq.
a, Schematics of the RNA properties (terminal and internal modifications) and key steps (adapter ligation and reverse transcription) of traditional RNA-seq, AlkB-facilitated RNA-seq, T4PNK-facilitated RNA-seq and PANDORA-seq. b, Schematic of the detection capacities of the abovementioned RNA-seq protocols from a small RNA pool. c, Demethylation activity of m1A, m1G, m3C and m22G with or without AlkB treatment of 15- to 50-nucleotide RNA fractions from mouse tissue (liver), as revealed by LC-MS/MS (n = 3 biologically independent samples). The data represent means ± s.e.m. Statistical significance was determined by two-sided multiple t-test (**P < 0.01; ***P < 0.001). d, Validation of improvements in 3′ terminal ligation following T4PNK treatment in synthesized tsRNAs and small RNA fractions extracted from mouse tissue (spleen). nt, nucleotides. e, Northern blot analysis of the 3′ adapter sequence to show, semi-quantitatively, improvement in the number of adapters being ligated before and after treatment with T4PNK. f–i, The improved treatment protocol minimized the potential artificial increase in tsRNAs and rsRNAs due to de novo degradation of tRNAs and rRNAs. In f and g, AlkB treatment on total RNAs (from HeLa cells) resulted in increased tsRNA (f) and rsRNA products (g), as observed by increased RNA smear (left) and by northern blots (right). In h and i, northern blot analyses of tsRNAs (h) and rsRNAs (i) after AlkB and/or T4PNK treatment on pre-size-selected RNA fractions (15- to 50-nucleotide RNA from HeLa cells) did not result in further degradation. For d–i, similar results were obtained in three independent experiments. j, Comparison of the PANDORA-seq results using treatment with either T4PNK first and AlkB second (T4PNK + AlkB) or AlkB first and T4PNK second (AlkB + T4PNK) in HeLa cells (15- to 50-nucletide RNA) showed highly consistent results (Spearman’s correlation; ρ = 0.995). Correlation coefficients for comparisons between other protocols are also provided. Statistical source data, precise P values and unprocessed blots are provided in the source data.
Fig. 2 ∣
Fig. 2 ∣. Read summaries and length distributions of different sncRNA categories under traditional RNA-seq, AlkB-facilitated RNA-seq, T4PNK-facilitated RNA-seq and PANDORA-seq.
a–e, Comparison of different protocols in five representative tissue or cell types (from a total of 11; the results for the other tissue and cell types are provided in Supplementary Fig. 1): mouse brain (a), mouse liver (b), mouse mature sperm and mature sperm heads (c), mESCs (d) and HeLa cells (e). The results show a dynamic landscape of sncRNAs detected by different methods and across different tissue and cell types. The data represent means ± s.e.m. f, Relative tsRNA/miRNA ratios under different protocols (n = 3 biologically independent samples per bar). Different letters above the bars indicate a statistically significant difference (P < 0.05). Same letters indicate P ≥ 0.05. Statistical significance was determined by two-sided one-way ANOVA with uncorrected Fisher’s LSD test. All data are plotted as means ± s.e.m. g–i, The relative expression levels of miRNAs, tsRNAs and rsRNAs, as revealed by PANDORA-seq, were validated by northern blots. The results for mouse brain (g), mouse liver (h) and HeLa cells (i) are shown. For g–i, similar results were obtained in three independent experiments. Blue arrowheads point to rsRNA-28S-1, red arrowheads point to 5′ tsRNAGlu, black arrowheads point to let-7i, green arrowheads point to miR-122 and purple arrowheads point to miR-21. Statistical source data, precise P values and unprocessed blots are provided in the source data.
Fig. 3 ∣
Fig. 3 ∣. Dissecting the effects of AlkB, T4PNK and PANDORA-seq on different sncRNA populations in ESCs.
a–c, Scatter plots comparing profile changes in tsRNAs (red dots) and miRNAs (grey dots) detected using AlkB versus traditional (a), T4PNK versus traditional (b) and PANDORA-seq versus traditional protocols (c). ρ is the Spearman’s correlation coefficient. d, tsRNA responses to AlkB, T4PNK and PANDORA-seq in regard to different origins (5′ tsRNA, 3′ tsRNA, 3′ tsRNA-CCA end and internal tsRNAs). The y axes represent the relative expression level compared with total reads of miRNA (n = 3 biologically independent samples per bar). Different letters above the bars indicate statistically significant differences (P < 0.05). Same letters indicate P ≥ 0.05. Statistical significance was determined by two-sided one-way ANOVA with uncorrected Fisher’s LSD test. All data are plotted as means ± s.e.m. e, Overall length mapping showing the distribution of relative tsRNA reads from mature genomic (left) and mitochondrial (right) tRNA under different RNA-seq protocols. f, Dynamic response to different RNA-seq protocols (left) of a representative individual tsRNA (mouse tRNA-Gln-TTG-2; pictured right). g–i, Scatter plots comparing profile changes in rsRNAs (blue dots) and miRNAs (grey dots) detected using the following protocols: AlkB versus traditional (g), T4PNK versus traditional (h) and PANDORA-seq versus traditional (i). j–m, Comparison of rsRNA-generating loci by rsRNA mapping data on 5S rRNA (j), 5.8S rRNA (k), 18S rRNA (l) and 28S rRNA (m), detected using different RNA-seq protocols. n,o, Many of the previously annotated miRNAs from miRBase that showed upregulation under PANDORA-seq could also be annotated to other sncRNA categories, as exemplified in mESCs (n) and primed hESCs (o). The mapping plots in e, f and j–m are presented as means ± s.e.m. Statistical source data and precise P values are provided in the source data.
Fig. 4 ∣
Fig. 4 ∣. Tissue- and cell type-specific expression of tsRNAs and rsRNAs in mice and humans.
a, Radar plots showing the different sensitivities of five different mouse tissue or cell types in regard to different RNA-seq protocols. The numbers (1, 10 and 100) on the radius represent log values. b, Heatmaps showing the tsRNA (genomic and mitochondrial) relative expression levels (normalized to total miRNA levels and based on a log2-transformed scale in the row direction) of five different mouse tissue or cell types, as detected by PANDORA-seq. c, Pairwise comparison matrix showing the overall expression pattern difference of rsRNAs (derived from 28S rRNAs) under different RNA-seq protocols across five mouse tissue or cell types. Blue represents more similarity and red more difference. d, Comparison of rsRNA-generating loci from mouse 28S rRNA revealed distinct patterns across tissue and cell types. e, Radar plots showing the different sensitivities of three different human cell types in regard to different RNA-seq protocols. The numbers (1, 10 and 100) on the radius represent log values. f, Heatmaps showing the tsRNA (genomic and mitochondrial) relative expression levels (normalized to total miRNA levels and based on a log2-transformed scale in the row direction) of three different human cell types, as detected by PANDORA-seq. g, Pairwise comparison matrix showing the overall expression pattern difference of rsRNAs (derived from 18S rRNAs) identified using different RNA-seq protocols across three human cell types. Blue represents more similarity and red more difference. h, Comparison of rsRNA-generating loci from human 18S rRNA revealed distinct patterns across tissue and cell types. i,j, Exemplary human ysRNAs (RNY3 (i) and RNY5 (j)) that are differentially expressed between different cell types, as determined by PANDORA-seq. The mapping plots in d, h, i and j are presented as means ± s.e.m.
Fig. 5 ∣
Fig. 5 ∣. PANDORA-seq reveals that tsRNAs and rsRNAs are dynamically regulated during MEF reprogramming to iPSCs (day 0) to intermediate (day 3) and iPSC stages.
a, Dynamic changes in sncRNA distribution during iPSC reprogramming from MEFs (day 0) to intermediate (day 3) and iPSC stages (means ± s.e.m.), as determined by PANDORA-seq. b, Bar plot (top) and heatmap (bottom) showing miRNA expression changes (based on RPM values) during cell reprogramming using PANDORA-seq. c, Radar plots showing the different sensitivities of MEFs, intermediate stages and iPSCs in regard to different RNA-seq protocols. d, Heatmaps showing tsRNA (genomic and mitochondrial) expression levels (based on RPM values) during cell reprogramming using PANDORA-seq. e,f, Dynamic changes (e) of a representative tsRNA (tRNA-Arg-ACG-1; pictured in f) during the reprogramming process, as determined by PANDORA-seq. g, Pairwise comparison matrix showing the correlation of rsRNAs (derived from 28S rRNA) under different RNA-seq protocols during cell reprogramming. Blue signifies more similarity and red more difference. Note that PANDORA-seq revealed a more dynamic change across different stages than traditional RNA-seq. h–j, Comparison of rsRNA-generating loci by rsRNA mapping data on 5S rRNA (h), 18S rRNA (i) and 28S rRNA (j) under PANDORA-seq, showing dynamic changes during the reprogramming process. In e and h–j, the shaded peaks are marked with the significance value for the comparison between MEFs and iPSCs, as determined by two-way ANOVA. The mapping plots in e and h–j are presented as means ± s.e.m. The highlighted windows in i and j show the detailed read mappings of rsRNA-18S-1 (i) and rsRNA-28S-1, -2 and -3 (j), which were used for northern blot validation in q and r (see arrows). k–r, Northern blot examination of representative sncRNAs (let-7i (k), let-7f (l), 5′ tsRNAAla (m), 3′ tsRNAArg (n), 5′ tsRNAHis (o), 3′ tsRNALys (p), rsRNA-18S-1 (q) and rsRNA-28S-1, -2 and -3 (r)) was performed in MEFs and iPSCs. The northern blot signals (similar results were obtained in three independent experiments) showed overall consistency with their corresponding sequencing reads in MEFs and iPSCs, as revealed by PANDORA-seq (n = 3 biologically independent samples per bar). Black arrowheads, miRNAs; red arrowheads, tsRNAs; blue arrowheads, rsRNAs. The data represent means ± s.e.m. Statistical significance was determined by two-sided Student’s t-test (*P < 0.05; **P < 0.01). Statistical source data, precise P values and unprocessed blots are provided in the source data.
Fig. 6 ∣
Fig. 6 ∣. Transfection of tsRNA or rsRNA impacts mESC lineage differentiation and cell translation.
a, Schematic of the procedure of tsRNA/rsRNA transfection (that is, rsRNA-28S-1, 5′ tsRNAAla, 3′ tsRNAArg, 5′ tsRNAGlu, 5′ tsRNAHis, 3′ tsRNALys and a pool of the five aforementioned tsRNAs (tsRNA pool)), followed by embryoid body formation and transcriptome RNA-seq at days 1, 3 and 6 after transfection. b,c, Top-ranked upregulated (b) and downregulated GOBP terms (c) in day 6 embryoid bodies after each tsRNA/rsRNA transfection compared with the control. d,e, Expression heatmaps of the differentially expressed genes from the representative GOBP terms sensory organ development (d) and urogenital development (e). Similar analyses for other pathways are shown in Extended Data Fig. 10a-d. The Venn diagram beneath each heatmap shows the numbers of overlapped dysregulated genes under different tsRNA/rsRNA transfections. f, Gene set score analyses of the representative GOBP terms during days 1, 3 and 6 of embryoid body differentiation under control, rsRNA-28S-1 or pooled tsRNA transfection (n = 3 biologically independent samples at each time point). Statistical significance was determined by two-sided one-way ANOVA (*P < 0.05; **P < 0.01; ***P < 0.001; ****P < 0.0001). Data represent means ± s.e.m. g,h, Global translational assay results. Representative pictures of nascent protein syntheses (g) and protein synthesis rates 24 h after transfection of the control (vehicle only; n = 40), scrambled RNA (n = 41), rsRNA-28S-1 (n = 44) and pooled tsRNA (n = 54) (h) are shown. Scale bars in g, 100 μm. The ESC clones were from three independent biological experiments. Statistical significance was determined by two-sided one-way ANOVA (****P < 0.0001). NS, not significant. Data represent means ± s.e.m. Statistical source data and precise P values are provided in the source data.

References

    1. Bartel DP Metazoan microRNAs. Cell 173, 20–51 (2018). - PMC - PubMed
    1. Honda S et al. Sex hormone-dependent tRNA halves enhance cell proliferation in breast and prostate cancers. Proc. Natl Acad. Sci. USA 112, E3816–E3825 (2015). - PMC - PubMed
    1. Cozen AE et al. ARM-seq: AlkB-facilitated RNA methylation sequencing reveals a complex landscape of modified tRNA fragments. Nat. Methods 12, 879–884 (2015). - PMC - PubMed
    1. Zheng G et al. Efficient and quantitative high-throughput tRNA sequencing. Nat. Methods 12, 835–837 (2015). - PMC - PubMed
    1. Dai Q, Zheng G, Schwartz MH, Clark WC & Pan T Selective enzymatic demethylation of N2,N2-dimethylguanosine in RNA and its application in high-throughput tRNA sequencing. Angew. Chem. Int. Ed. Engl 56, 5017–5020 (2017). - PMC - PubMed

Publication types