. 2021 Jun;53(6):830-839.
doi: 10.1038/s41588-021-00827-w. Epub 2021 Apr 5.

Shared heritability of human face and brain shape

Affiliations

Shared heritability of human face and brain shape

Sahin Naqvi et al. Nat Genet. 2021 Jun.

Abstract

Evidence from model organisms and clinical genetics suggests coordination between the developing brain and face, but the role of this link in common genetic variation remains unknown. We performed a multivariate genome-wide association study of cortical surface morphology in 19,644 individuals of European ancestry, identifying 472 genomic loci influencing brain shape, of which 76 are also linked to face shape. Shared loci include transcription factors involved in craniofacial development, as well as members of signaling pathways implicated in brain-face cross-talk. Brain shape heritability is equivalently enriched near regulatory regions active in either forebrain organoids or facial progenitors. However, we do not detect significant overlap between shared brain-face genome-wide association study signals and variants affecting behavioral-cognitive traits. These results suggest that early in embryogenesis, the face and brain mutually shape each other through both structural effects and paracrine signaling, but this interplay may not impact later brain development associated with cognitive function.


Conflict of interest statement

Competing interests statement

The authors declare no competing interests.

Figures

Extended Data Fig. 1
Extended Data Fig. 1. Number of additional brain shape loci contributed by hierarchical levels.
For all genome-wide (left) or study-wide (right) significant associations, associations with all segments in hierarchical levels up to the indicated number were masked, and the number of remaining associations was assessed.
Extended Data Fig. 2
Extended Data Fig. 2. Point-wise SNP heritability estimates across the mid-cortical surface.
Colors represent the total SNP heritability (computed by a linear mixed model approach, see Methods) at each point on the mid-cortical surface, represented by a set of three-dimensional coordinates in each individual.
Extended Data Fig. 3
Extended Data Fig. 3. Replication rates in the ABCD cohort by hierarchical level.
Only segments in the indicated hierarchical level were considered, and all loci (left) or locus-segment pairs (right) reaching genome-wide significance in those segments were tested for replication in the ABCD cohort at a 5% FDR.
Extended Data Fig. 4
Extended Data Fig. 4. Overlap between genome-wide significant brain shape loci and genome-wide significant loci from 430 other studies.
GWAS hits (number on x-axis) for other studies were obtained from the NCBI-EBI GWAS Catalog, and P-values (left, y-axis) and odds ratios (right, y-axis) for significance of overlap with regions in LD (> 0.2) with brain shape loci were computed using bedtools’ fisher function (see Methods). Note that relative to other traits with equivalent numbers of GWAS hits, face shape shows overlap with brain shape loci greater in both significance and magnitude.
Extended Data Fig. 5
Extended Data Fig. 5. Comparison of LDSC genetic correlations and Spearman correlation between pairs of univariate traits.
Each point represents a pair of univariate traits (of all those considered in this study, see Methods), while the x- and y-axes indicate the absolute value of the LDSC-estimated genetic correlation and the estimated genome-wide sharing of effects by the Spearman correlation method. Point colors and shapes indicate significance (P < 0.05) from LDSC or the Spearman correlation method, respectively. Exact p-values are provided in Supplementary Table 6.
Extended Data Fig. 6
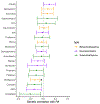
Extended Data Fig. 6. Genetic correlations between RA (rheumatoid arthritis) and univariate brain-related traits.
Points (center of error bars) represent estimated genetic correlations. Error bars represent 95% confidence intervals. *, 5% FDR.
Extended Data Fig. 7
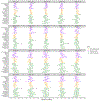
Extended Data Fig. 7. Genetic correlations between the most heritable brain (top two rows) or face (bottom two rows) shape PCs and other traits.
Points (center of error bars) represent estimated genetic correlations (rg) between the top ten shape PCs (for segment 1, the full brain or face) with heritability z-score > 3 and each of the indicated univariate traits using LD score regression. Error bars represent 95% confidence intervals. *, 5% FDR for indicated PC; +, 10% FDR.
Extended Data Fig. 8
Extended Data Fig. 8. SNP heritability of individual face shape PCs and multivariate face shape estimated by LDSC.
Points (center of error bars) represent estimated SNP heritability of each PC. Error bars represent 95% confidence intervals. The red line represents the mean heritability of all 70 PCs, and the blue line indicates the heritability obtained by applying LDSC to corrected χ2 statistics from the multivariate CCA GWAS using all 70 PCs.
Extended Data Fig. 9
Extended Data Fig. 9. Partitioned heritability enrichments for brain shape with respect to stage- and cell-type-specific brain organoid open chromatin.
S-LDSC coefficient Z-scores and heritability fold-enrichment for annotations corresponding to the indicated cell-type and differentiation day were computed as described in Methods. Regression lines represent the linear best fit with intercept and organoid differentiation day as dependent variable, and grey areas represent 95% confidence intervals. P-values are from a two-tailed F-test.
Extended Data Fig. 10
Extended Data Fig. 10. Partitioned heritability enrichments for brain shape with respect to open chromatin in CNCCs or early glial organoid cells, with or without 76 brain-face shared loci.
S-LDSC Z-scores were calculated using full brain shape as the trait and the most enriched craniofacial (top) or brain organoid (bottom) ATAC-seq dataset as annotations. Z-scores were re-estimated (blue) after removing all SNPs in the same approximately independent LD block as one of the 76 brain-face shared loci (see Methods for details).
Fig. 1:
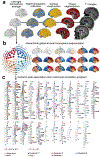
Fig. 1:. Multivariate genome-wide association study (GWAS) of brain shape.
a, Upstream processing of UK Biobank (UKB) magnetic resonance imaging (MRI) images. b, in the polar dendrogram on the left, each concentric ring of filled circles corresponds to a hierarchical level (labeled i-ix) shown on the right, and the filled circle colors correspond to the respective segments in the same hierarchical level. c, Ideogram showing genomic locations and regional effects of 472 genome-wide significant loci for brain shape. Circles and diamonds represent associations passing the study-wide or genome-wide significance thresholds, colors represent broad regions of the brain with the indicated effects.
Fig. 2:
Fig. 2:. Loci affecting both brain and face shape.
a, Miami plot of GWAS for brain (top) and face (bottom) shape. For each SNP, p-values aggregated across all brain or face segments are plotted. All 76 loci reaching genome-wide (P < 5 x 10⁻⁸) significance in one study and genome-wide suggestive (P < 5 x 10⁻⁷) significance in the other are highlighted by unfilled circles. Right-tailed, one-sided P-values were computed based on canonical correlation analysis (CCA) chi-squared statistics; exact p-values are available in Supplementary Table 4. Loci near candidate genes highlighted in the text and in b and c are labeled, generally on the side where they show greater significance of association. b, Expression (in transcripts per million, TPM) of candidate genes near brain-face shared loci in cranial neural crest cells (CNCCs) of different passages, representing different stages of maturation, from early (P1) to late (P4) and their chondrocyte (Chond. D9) derivatives (left), and three dimensional forebrain organoids at various stages of differentiation (right), further sorted into glial or neuronal lineages or profiled as whole organoids. c, Regional phenotypic effects of four candidate loci, showing effects of linked single nucleotide polymorphisms (SNPs) on brain (left) or face (right) shape. Segments shown are of hierarchical level v, −log10(p-values) are normalized to the maximum at each locus. Full face and brain images from all 76 brain-face shared loci corresponding to all hierarchical levels can be found online (see Data Availability)
Fig. 3:
Fig. 3:. Genome-wide sharing of signals with neuropsychiatric disorders and behavioral-cognitive traits.
Genome-wide sharing of signals between any two given GWAS was assessed by Spearman correlation of linkage disequlibrium block-average SNP −log10(p-values) (Methods). a, Spearman correlations between GWAS of indicated facial quadrants and brain segments. b, Spearman correlations between GWAS of selected neuropsychiatric disorders, behavioral-cognitive traits, subcortical volume measures and brain segments, or select immune traits. All brain segments in a,b are from hierarchical level v segmentation, with the exception of Hippocampus, where hierarchical level vi segmentation shows a strong correlation of shape of the hippocampal region with volume. c, Spearman correlations between shape effects on the full brain (left) or face (right) with the indicated traits. * 5% false discovery rate (FDR) based on bootstrapped p-value (Methods). Images of brain-trait correlations at all six hierarchical levels can be found online (see Data Availability). Abbreviations: ADHD, Attention Deficit Hyperactivity Disorder ;GEN, generalized epilepsy; JME, juvenile myoclonic epilepsy; ICV, intracranial volume; T1D, type 1 diabetes; SSC, systemic sclerosis; RA, rheumatoid arthritis.
Fig. 4:
Fig. 4:. Partitioned heritability enrichments based on cell-type-specific regulatory annotations.
Heritability enrichment Z-scores, as estimated by stratified linkage disequilibrium score regression (S-LDSC), of a) multivariate shape for the first 7 face segments, b) multivariate shape for the first 7 brain segments, excluding segment 4 which had low heritability, c) neuropsychiatric disorders, d) behavioral cognitive traits, and e) subcortical volume measures. Heritability enrichments were estimated for annotations based on open chromatin (based on Assay for Transposase-Accesible Chromatin using sequencing (ATAC-seq)), regulatory regions (based on chromatin immune precipitation followed by sequencing (ChIP-seq) of multiple histone modifications), or a combination of the two. Annotations for the indicated samples, representing in-vitro-derived cell-types, primary tissues, or a combination of both (see Methods for source papers), were added to the S-LDSC baseline model, and the resulting Z-score was scaled by column to visualize relative enrichments between traits. * 5% FDR based on unscaled Z-scores. Trait abbreviations as in Figure 3, with AN representing anorexia nervosa.

Comment in

  • Our faces and brains.
    van den Heuvel MP, Posthuma D. van den Heuvel MP, et al. Nat Genet. 2021 Jun;53(6):765-766. doi: 10.1038/s41588-021-00858-3. Nat Genet. 2021. PMID: 33888909 No abstract available.

Similar articles

  • Genome scans of facial features in East Africans and cross-population comparisons reveal novel associations.
    Liu C, Lee MK, Naqvi S, Hoskens H, Liu D, White JD, Indencleef K, Matthews H, Eller RJ, Li J, Mohammed J, Swigut T, Richmond S, Manyama M, Hallgrímsson B, Spritz RA, Feingold E, Marazita ML, Wysocka J, Walsh S, Shriver MD, Claes P, Weinberg SM, Shaffer JR. Liu C, et al. PLoS Genet. 2021 Aug 19;17(8):e1009695. doi: 10.1371/journal.pgen.1009695. eCollection 2021 Aug. PLoS Genet. 2021. PMID: 34411106 Free PMC article.
  • Novel genetic loci affecting facial shape variation in humans.
    Xiong Z, Dankova G, Howe LJ, Lee MK, Hysi PG, de Jong MA, Zhu G, Adhikari K, Li D, Li Y, Pan B, Feingold E, Marazita ML, Shaffer JR, McAloney K, Xu SH, Jin L, Wang S, de Vrij FM, Lendemeijer B, Richmond S, Zhurov A, Lewis S, Sharp GC, Paternoster L, Thompson H, Gonzalez-Jose R, Bortolini MC, Canizales-Quinteros S, Gallo C, Poletti G, Bedoya G, Rothhammer F, Uitterlinden AG, Ikram MA, Wolvius E, Kushner SA, Nijsten TE, Palstra RT, Boehringer S, Medland SE, Tang K, Ruiz-Linares A, Martin NG, Spector TD, Stergiakouli E, Weinberg SM, Liu F, Kayser M; International Visible Trait Genetics (VisiGen) Consortium. Xiong Z, et al. Elife. 2019 Nov 26;8:e49898. doi: 10.7554/eLife.49898. Elife. 2019. PMID: 31763980 Free PMC article.
  • A genome-wide association study identifies five loci influencing facial morphology in Europeans.
    Liu F, van der Lijn F, Schurmann C, Zhu G, Chakravarty MM, Hysi PG, Wollstein A, Lao O, de Bruijne M, Ikram MA, van der Lugt A, Rivadeneira F, Uitterlinden AG, Hofman A, Niessen WJ, Homuth G, de Zubicaray G, McMahon KL, Thompson PM, Daboul A, Puls R, Hegenscheid K, Bevan L, Pausova Z, Medland SE, Montgomery GW, Wright MJ, Wicking C, Boehringer S, Spector TD, Paus T, Martin NG, Biffar R, Kayser M. Liu F, et al. PLoS Genet. 2012 Sep;8(9):e1002932. doi: 10.1371/journal.pgen.1002932. Epub 2012 Sep 13. PLoS Genet. 2012. PMID: 23028347 Free PMC article.
  • Joint multi-ancestry and admixed GWAS reveals the complex genetics behind human cranial vault shape.
    Goovaerts S, Hoskens H, Eller RJ, Herrick N, Musolf AM, Justice CM, Yuan M, Naqvi S, Lee MK, Vandermeulen D, Szabo-Rogers HL, Romitti PA, Boyadjiev SA, Marazita ML, Shaffer JR, Shriver MD, Wysocka J, Walsh S, Weinberg SM, Claes P. Goovaerts S, et al. Nat Commun. 2023 Nov 16;14(1):7436. doi: 10.1038/s41467-023-43237-8. Nat Commun. 2023. PMID: 37973980 Free PMC article. Review.
  • Genetic architecture of brain morphology and overlap with neuropsychiatric traits.
    Ge YJ, Fu Y, Gong W, Cheng W, Yu JT. Ge YJ, et al. Trends Genet. 2024 Aug;40(8):706-717. doi: 10.1016/j.tig.2024.04.005. Epub 2024 May 2. Trends Genet. 2024. PMID: 38702264 Review.

Cited by

References

MAIN REFERENCES

    1. Lui JH, Hansen DV & Kriegstein AR Development and evolution of the human neocortex. Cell 146, 18–36 (2011). - PMC - PubMed
    1. Gu J & Kanai R What contributes to individual differences in brain structure? Front. Hum. Neurosci 8, 1–6 (2014). - PMC - PubMed
    1. Strike L et al. Genetic complexity of cortical structure: Differences in genetic and environmental factors influencing cortical surface area and thickness. Cereb. Cortex 29, 952–962 (2019). - PMC - PubMed
    1. Wen W et al. Distinct Genetic Influences on Cortical and Subcortical Brain Structures. Sci. Rep 6, 1–11 (2016). - PMC - PubMed
    1. Grasby KL et al. The genetic architecture of the human cerebral cortex. Science (80-.). 367, (2020). - PMC - PubMed

METHODS REFERENCES

    1. Miller KL et al. Multimodal population brain imaging in the UK Biobank prospective epidemiological study. Nat. Neurosci 19, 1523–1536 (2016). - PMC - PubMed
    1. Dale AM, Fischl B & Sereno MI Cortical surface-based analysis. I. Segmentation and surface reconstruction. Neuroimage 9, 179–194 (1999). - PubMed
    1. Dickie EW et al. Ciftify: A framework for surface-based analysis of legacy MR acquisitions. Neuroimage 197, 818–826 (2019). - PMC - PubMed
    1. Winkler AM et al. Measuring and comparing brain cortical surface area and other areal quantities. Neuroimage 61, 1428–1443 (2012). - PMC - PubMed
    1. Van Essen DC A Population-Average, Landmark- and Surface-based (PALS) atlas of human cerebral cortex. Neuroimage 28, 635–662 (2005). - PubMed

Publication types