. 2021 Jun 11;2(6):720-735.e4.
doi: 10.1016/j.medj.2021.03.013. Epub 2021 Mar 31.

Alterations in T and B cell function persist in convalescent COVID-19 patients

Collaborators, Affiliations

Alterations in T and B cell function persist in convalescent COVID-19 patients

Halima A Shuwa et al. Med. .

Abstract

Background: Emerging studies indicate that some coronavirus disease 2019 (COVID-19) patients suffer from persistent symptoms, including breathlessness and chronic fatigue; however, the long-term immune response in these patients presently remains ill-defined.

Methods: Here, we describe the phenotypic and functional characteristics of B and T cells in hospitalized COVID-19 patients during acute disease and at 3-6 months of convalescence.

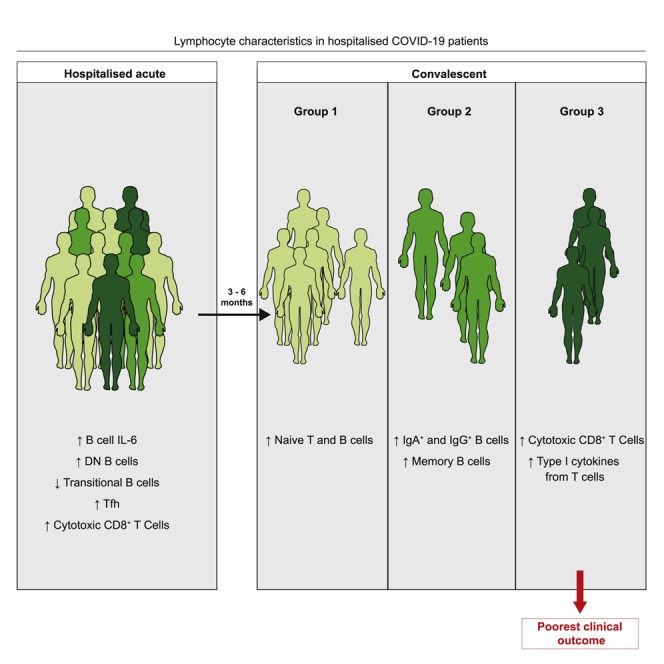
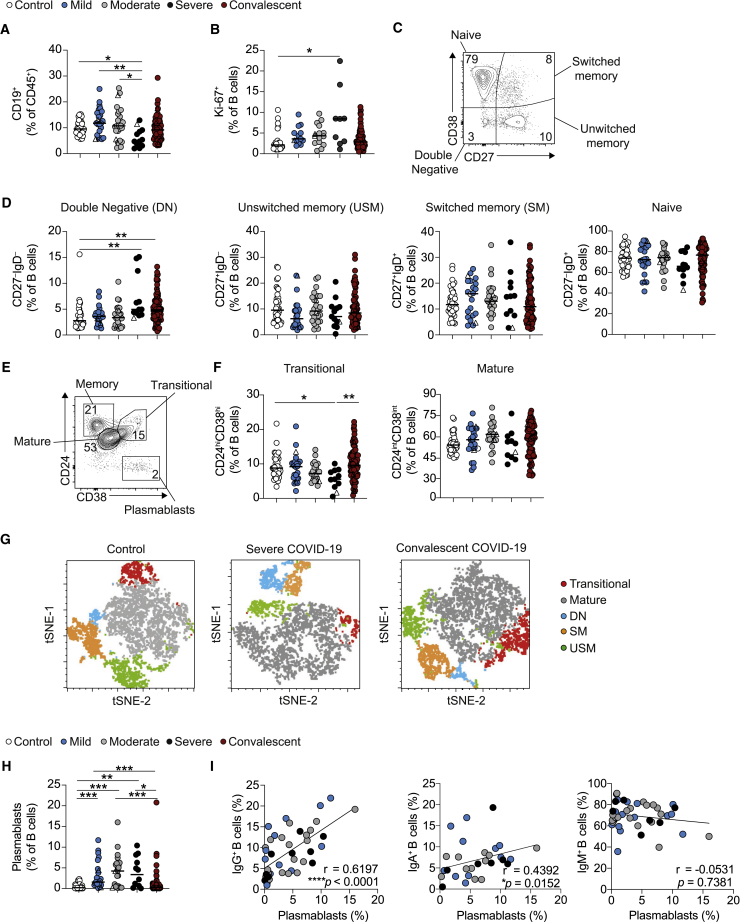
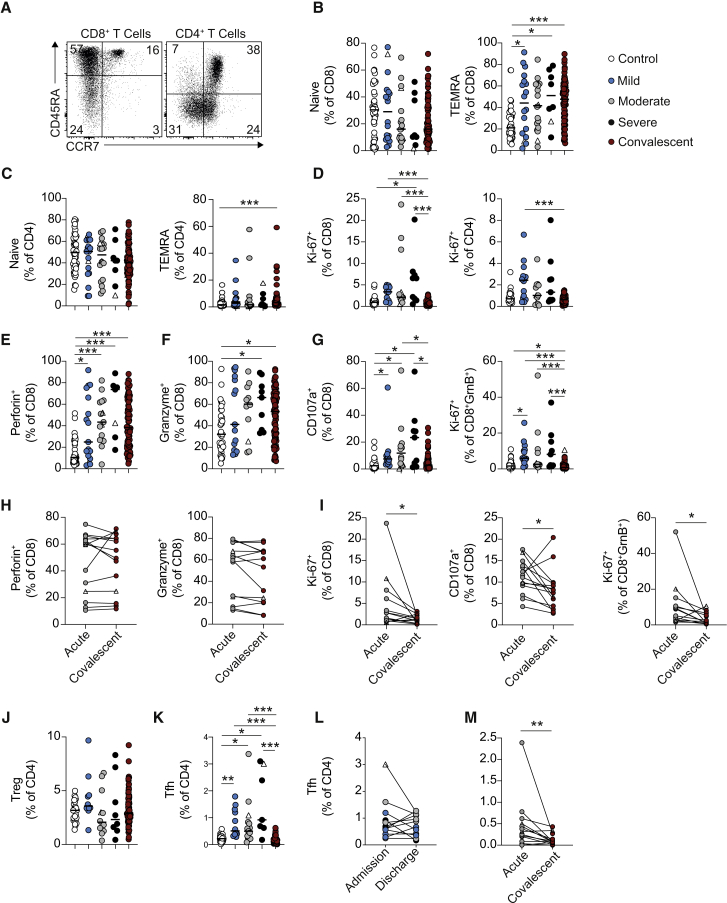
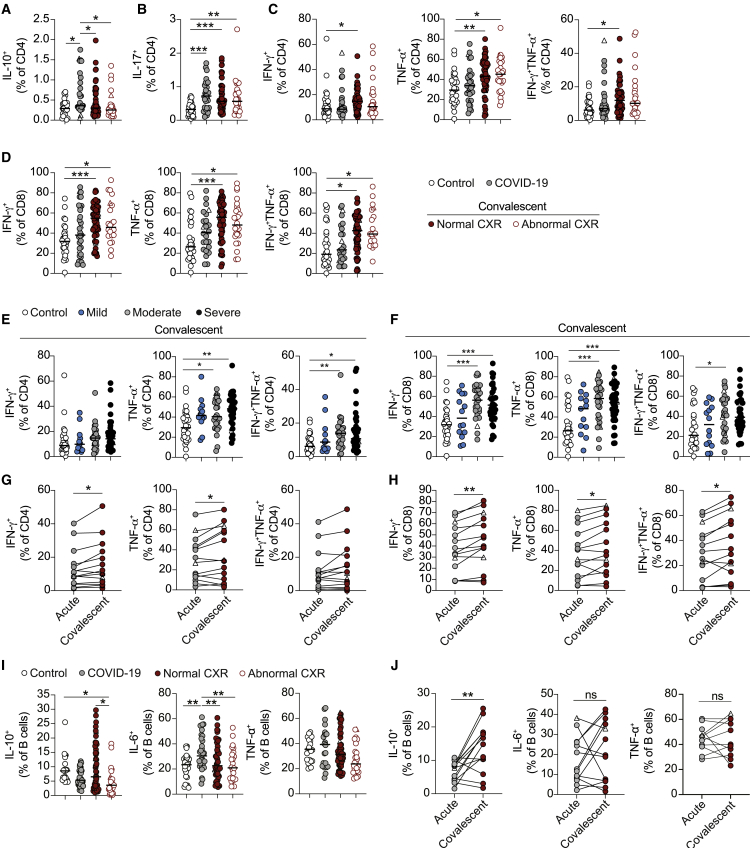
Findings: We report that the alterations in B cell subsets observed in acute COVID-19 patients were largely recovered in convalescent patients. In contrast, T cells from convalescent patients displayed continued alterations with persistence of a cytotoxic program evident in CD8+ T cells as well as elevated production of type 1 cytokines and interleukin-17 (IL-17). Interestingly, B cells from patients with acute COVID-19 displayed an IL-6/IL-10 cytokine imbalance in response to Toll-like receptor activation, skewed toward a pro-inflammatory phenotype. Whereas the frequency of IL-6+ B cells was restored in convalescent patients irrespective of clinical outcome, the recovery of IL-10+ B cells was associated with the resolution of lung pathology.

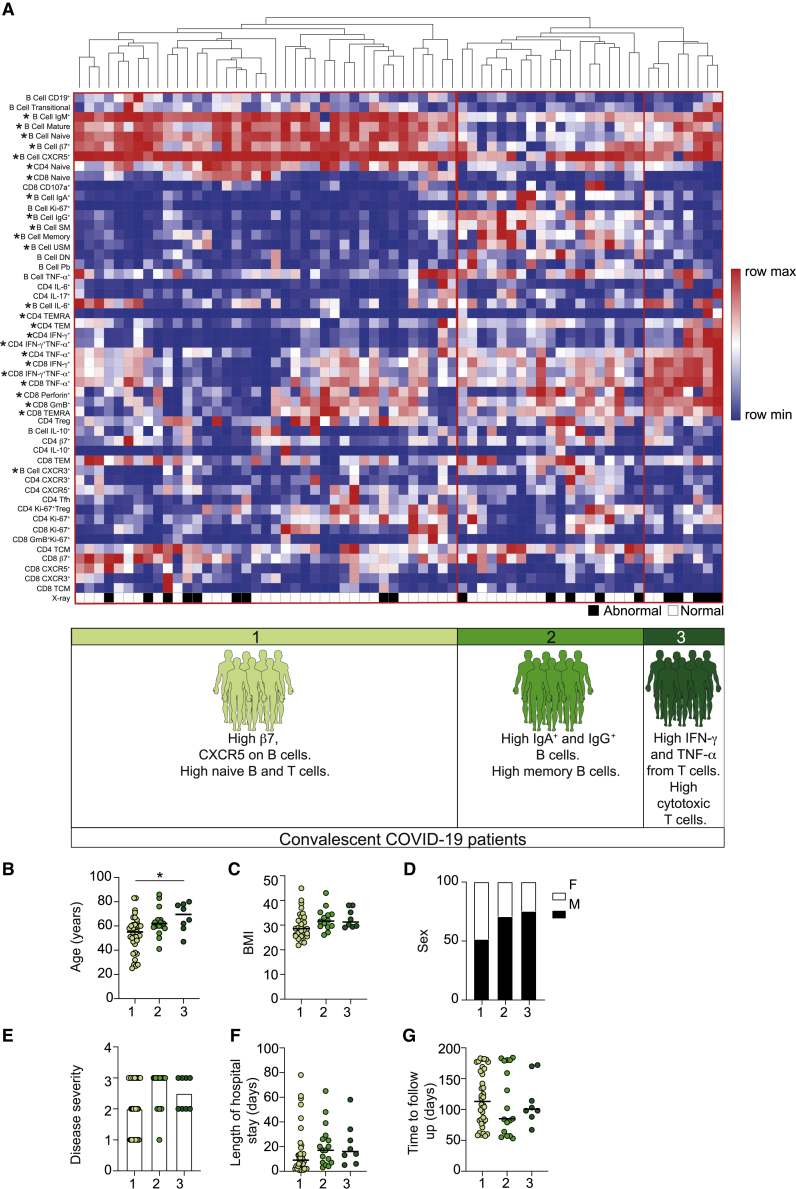
Conclusions: Our data detail lymphocyte alterations in previously hospitalized COVID-19 patients up to 6 months following hospital discharge and identify 3 subgroups of convalescent patients based on distinct lymphocyte phenotypes, with 1 subgroup associated with poorer clinical outcome. We propose that alterations in B and T cell function following hospitalization with COVID-19 could affect longer-term immunity and contribute to some persistent symptoms observed in convalescent COVID-19 patients.

Funding: Provided by UKRI, Lister Institute of Preventative Medicine, the Wellcome Trust, The Kennedy Trust for Rheumatology Research, and 3M Global Giving.

Keywords: B cells; COVID-19; T cells; convalescent patients; long COVID; viral Infection.


Conflict of interest statement

The authors declare no competing interests.

Figures

None
Graphical abstract
Figure 1
Figure 1
Alterations in B cell subsets during acute COVID-19 are recovered upon convalescence (A) Cumulative data show ex vivo frequency of CD19+ B cells in healthy individuals (n = 38) and COVID-19 patients with mild (n = 24), moderate (n = 26), and severe (n = 12) disease and at convalescence (n = 83). (B) Cumulative data show Ki-67 expression by B cells in healthy individuals (n = 28) and COVID-19 patients with mild (n = 13), moderate (n = 15), and severe (n = 9) disease and at convalescence (n = 75). (C and D) Representative flow cytometry plots and cumulative data show frequencies of naive (CD27IgD+), unswitched memory (CD27+IgD+), switched memory (CD27+IgD), and double-negative (CD27IgD) B cells in healthy individuals (n = 38–40) and COVID-19 with mild (n = 22–24), moderate (n = 25–26), and severe (n = 12–13) disease and at convalescence (n = 78–80). (E and F) Representative flow cytometry plots and cumulative data show ex vivo frequency of CD24hiCD38hi transitional B cells and CD24intCD38int mature B cells in healthy individuals (n = 37) and COVID-19 patients with mild (n = 24), moderate (n = 23), and severe (n = 11) disease and at convalescence (n = 80). (G) tSNE projection of flow cytometry panel visualizing B cell subsets in PBMCs. Representative images for healthy individuals, severe COVID-19 patients, and convalescent patients. Key indicates cell subsets identified on the image. (H) Cumulative data show frequency of CD27hiCD38hi plasmablasts in healthy controls (n = 38) and COVID-19 patients with mild (n = 23), moderate (n = 23), and severe (n = 12) disease and at convalescence (n = 81). (I) Graph showing correlation between plasmablasts and IgG+ (left), IgA+ (center), or IgM+ (right) B cell frequencies in acute COVID-19 patients. Graphs show individual patient data, with the bar representing median values. In all graphs, open triangles represent SARS-CoV-2 PCR patients. ∗p < 0.05, ∗∗p < 0.01, ∗∗∗p < 0.001, 1-way ANOVA with Kruskal-Wallis test with Dunn’s post hoc testing for multiple comparisons or Spearman ranked coefficient correlation test. See also Figures S1 and S2.
Figure 2
Figure 2
Acute alterations in CD4+ T cells and persistent alterations in CD8+ T cells during COVID-19 (A) Representative FACS plots showing CD45RA and CCR7 staining on CD4+ (gated CD3+CD8) and CD8+ (gated CD3+CD4) T cells. (B and C) Graphs showing frequencies of (B) CD8+ and (C) CD4+ T cells that have a naive (CD45RA+CCR7+) and TEMRA (CD45RA+CCR7) phenotype in healthy individuals (n = 44) and COVID-19 patients with mild (n = 18–19), moderate (n = 18), and severe (n = 8) disease and at up to 6 months of convalescence (n = 83). (D) Graphs showing frequencies of CD8+ and CD4+ T cells that stain positive for Ki-67 in healthy individuals (n = 28–30), and COVID-19 patients with mild (n = 14), moderate (n = 11–13), and severe (n = 9) disease and at convalescence (n = 81). (E–G) Graphs showing frequencies of (E) CD8+Perforin+ cells, (F) CD8+GranzymeB+ cells, and (G) CD8+CD107a+ cells and CD8+GranzymeB+ Ki-67+ cells in healthy individuals (n = 29–37), and COVID-19 patients with mild (n = 12–17), moderate (n = 12–15), and severe (n = 7–9) disease and at convalescence (n = 81–83). (H and I) Graphs track frequencies of (H) Perforin+ and GranzymeB+ and (I) Ki-67+, CD107a+, and GranzymeB+Ki-67+CD8+ T cells in the same COVID-19 patient at acute (gray circles) and convalescent (maroon circles) time points (n = 14). (J) Graph shows frequencies of Tregs within CD4+ T cells of healthy individuals (n = 20) and COVID-19 patients with mild (n = 10), moderate (n = 12), and severe (n = 8) disease and at convalescence (n = 82). (K) Graph shows frequencies of Tfh within CD4+ T cells of healthy individuals (n = 34) and COVID-19 patients with mild (n = 12), moderate (n = 15), and severe (n = 7) disease and at convalescence (n = 83). (L) Graph shows frequencies of Tfh in individual acute COVID-19 patients with mild (n = 4), moderate (n = 5), and severe (n = 3) disease at their first and last time points of hospitalization. (M) Graph tracks frequency of Tfh CD4+ T cells in the same COVID-19 patient at acute (gray circles) and convalescent (maroon circles) time points (n = 14). Graphs show individual patient data, with the bar representing median values. In all graphs, open triangles represent SARS-CoV-2 PCR patients. ∗p < 0.05, ∗∗p < 0.01, ∗∗∗p < 0.001, 1-way ANOVA with Kruskal-Wallis test with Dunn’s post hoc testing for multiple comparisons (for B–G and K) or Wilcoxon matched-pairs signed rank test (I and M). See also Figures S1 and S2.
Figure 3
Figure 3
Changes in cytokine production by lymphocytes during acute and convalescent COVID-19 (A–C) Graphs showing frequencies of CD4+ T cells that stain positive for (A) IL-10, (B) IL-17, and (C) IFNγ and TNF-α following 3-h stimulation with PMA and ionomycin in healthy individuals (n = 25–30), acute COVID-19 patients (n = 29–33), and convalescent COVID-19 patients with normal (n = 55–57) or abnormal chest X-ray findings (n = 25–26). (D) Graphs showing frequencies of CD8+ T cells that stain positive for IFNγ and TNF-α following 3-h stimulation with PMA and ionomycin in healthy individuals (n = 28), acute COVID-19 patients (n = 24–31), and convalescent COVID-19 patients with normal (n = 54–57) or abnormal chest X-ray findings (n = 21–24). (E and F) Graphs show frequencies of (E) CD4+ and (F) CD8+ T cells that stain positive for IFNγ and TNF-α following 3-h stimulation with PMA and ionomycin in convalescent COVID-19 patients who initially presented with mild (n = 13–14), moderate (n = 25–28), and severe (n = 34–41) disease. (G and H) Graphs track frequencies of (G) CD4+ and (H) CD8+ T cells that stain positive for IFNγ and TNF-α in the same COVID-19 patient at acute (gray circles) and convalescent (maroon circles) time points (n = 14). (I) Graphs showing frequencies of CD19+ B cells positive for IL-10, IL-6, and TNF-α following 48-h stimulation with CpGB in healthy individuals (n = 22–27), acute COVID-19 patients (n = 22–32), and convalescent COVID-19 patients with normal (n = 52–54) or abnormal chest X-ray findings (n = 24–27). (J) Graphs track frequencies of CD19+ B cells that stain positive for IL-10, IL-6, and TNF-α in the same COVID-19 patient at acute (gray circles) and convalescent (maroon circles) time points (n = 11–14). Graphs show individual patient data, with the bar representing median values. In all graphs, open triangles represent SARS-CoV-2 PCR patients. ∗p < 0.05, ∗∗p < 0.01, ∗∗∗p < 0.001, 1-way ANOVA with Kruskal-Wallis test with Dunn’s post hoc testing for multiple comparisons, except for graphs showing CD4+TNF-α+ and CD8+IFNγ+ T cells in (E) and (F), where 1-way ANOVA with Holm-Sidak post hoc test was used, or Wilcoxon matched-pairs signed rank test (G, H, and J). See also Figures S3 and S4.
Figure 4
Figure 4
Distinct immune profiles emerge in previously hospitalized convalescent COVID-19 patients (A) Heatmap of indicated immune parameters by row. Each column represents an individual convalescent COVID-19 patient. The patients were clustered using one minus Pearson correlation hierarchical clustering. Significance was determined by 2-way ANOVA, followed by a Tukey’s multiple comparison test. Asterisk next to lymphocyte characteristic indicates a significant difference between patient groups. Dominant immune characteristics of each group are indicated at the bottom of the heatmap. Black and white squares indicate patients displaying a normal (white) or abnormal (black) chest X-ray at follow-up. (B–G) Graphs show patient characteristics and clinical details of convalescent COVID-19 patients in each of the 3 immune groups identified, specifically: (B) age; (C) BMI; (D) sex; (E) severity of acute COVID-19 (with 1 being mild, 2 moderate and 3 severe); (F) length, in days, of hospitalization for acute COVID-19; and (G) time, in days, from hospital discharge to follow-up of convalescent patients. Graphs show individual patient data, with the bar representing median values. ∗p < 0.05, 1-way ANOVA with Kruskal-Wallis test with Dunn’s post hoc testing for multiple comparisons.

References

    1. Huang C., Wang Y., Li X., Ren L., Zhao J., Hu Y., Zhang L., Fan G., Xu J., Gu X. Clinical features of patients infected with 2019 novel coronavirus in Wuhan, China. Lancet. 2020;395:497–506. - PMC - PubMed
    1. Guan W.-J., Ni Z.-Y., Hu Y., Liang W.H., Ou C.Q., He J.X., Liu L., Shan H., Lei C.L., Hui D.S.C., China Medical Treatment Expert Group for Covid-19 Clinical Characteristics of Coronavirus Disease 2019 in China. N. Engl. J. Med. 2020;382:1708–1720. - PMC - PubMed
    1. Kuri-Cervantes L., Pampena M.B., Meng W., Rosenfeld A.M., Ittner C.A.G., Weisman A.R., Agyekum R.S., Mathew D., Baxter A.E., Vella L.A. Comprehensive mapping of immune perturbations associated with severe COVID-19. Sci. Immunol. 2020;5:eabd7114. - PMC - PubMed
    1. Lucas C., Wong P., Klein J., Castro T.B.R., Silva J., Sundaram M., Ellingson M.K., Mao T., Oh J.E., Israelow B., Yale IMPACT Team Longitudinal analyses reveal immunological misfiring in severe COVID-19. Nature. 2020;584:463–469. - PMC - PubMed
    1. Mann E.R., Menon M., Knight S.B., Konkel J.E., Jagger C., Shaw T.N., Krishnan S., Rattray M., Ustianowski A., Bakerly N.D., NIHR Respiratory TRC. CIRCO Longitudinal immune profiling reveals key myeloid signatures associated with COVID-19. Sci. Immunol. 2020;5:eabd6197. - PMC - PubMed

Publication types