[Preprint]. 2021 Mar 30:2021.03.30.437173.
doi: 10.1101/2021.03.30.437173.

Severity of SARS-CoV-2 infection as a function of the interferon landscape across the respiratory tract of COVID-19 patients

Affiliations

Severity of SARS-CoV-2 infection as a function of the interferon landscape across the respiratory tract of COVID-19 patients

Benedetta Sposito et al. bioRxiv. .

Update in

  • The interferon landscape along the respiratory tract impacts the severity of COVID-19.
    Sposito B, Broggi A, Pandolfi L, Crotta S, Clementi N, Ferrarese R, Sisti S, Criscuolo E, Spreafico R, Long JM, Ambrosi A, Liu E, Frangipane V, Saracino L, Bozzini S, Marongiu L, Facchini FA, Bottazzi A, Fossali T, Colombo R, Clementi M, Tagliabue E, Chou J, Pontiroli AE, Meloni F, Wack A, Mancini N, Zanoni I. Sposito B, et al. Cell. 2021 Sep 16;184(19):4953-4968.e16. doi: 10.1016/j.cell.2021.08.016. Epub 2021 Aug 19. Cell. 2021. PMID: 34492226 Free PMC article.

Abstract

The COVID-19 outbreak driven by SARS-CoV-2 has caused more than 2.5 million deaths globally, with the most severe cases characterized by over-exuberant production of immune-mediators, the nature of which is not fully understood. Interferons of the type I (IFN-I) or type III (IFN-III) families are potent antivirals, but their role in COVID-19 remains debated. Our analysis of gene and protein expression along the respiratory tract shows that IFNs, especially IFN-III, are over-represented in the lower airways of patients with severe COVID-19, while high levels of IFN-III, and to a lesser extent IFN-I, characterize the upper airways of patients with high viral burden but reduced disease risk or severity; also, IFN expression varies with abundance of the cell types that produce them. Our data point to a dynamic process of inter- and intra-family production of IFNs in COVID-19, and suggest that IFNs play opposing roles at distinct anatomical sites.


Conflict of interest statement

Declaration of Interests.

IZ reports compensation for consulting services with Implicit Biosciences.

Figures

FIGURE 1.
FIGURE 1.. Members of the IFN-III and IFN-I families are over-represented in the lower airways of COVID-19 patients.
(A–H) IFNL1 (A), IFNL2,3 (B), IFNL4 (C), IFNB1 (D), IFNA2 (E), IFNA4 (F), IL1B (G), and IL6 (H) mRNA expression was evaluated in nasopharyngeal swabs from SARS-CoV-2-negative (Swab −) and -positive (Swab +) subjects and in the BALF from SARS-CoV-2-positive patients (BALF). Expression is plotted as log2 (gene/GAPDH mRNA + 0.5 × gene-specific minimum). Each dot represents a patient. Median with range is depicted. Statistics: (A–H) Kruskal-Wallis test with Dunn’s post-hoc test: ns, not significant (P>0.05); *P<0.05, **P<0.01, ***P<0.001, and ****P<0.0001.
FIGURE 2.
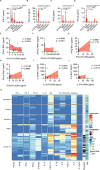
FIGURE 2.. A unique IFN signature characterizes the lower airways of COVID-19 patients compared to patients with other ARDS or non-infectious lung pathologies.
(A–D) IFN-λ1 (A), IFN-λ2,3 (B), IFN-β (C), IFN-α2 (D) protein levels were measured in the BALF of COVID-19, ARDS, Fibrosis, Sarcoidosis, and Transplant patients. Each dot represents a patient. Samples from ARDS patients diagnosed with H1N1 influenza A virus infection are color-coded in blue. Violin plots are depicted. (E–J) IFN-λ1 (E), IFN-λ2,3 (F), IFN-β (G), IFN-α2 (H), IL-1β (I), and IL-6 (J) protein levels in the BALF are plotted against protein levels in the plasma of the same patient. Each dot represents a patient. Linear regression lines (continuous line) and 95% confidence interval (dashed line and shaded area) are depicted in red. Spearman correlation coefficients (r) and p-value (p) are indicated. (K) Heatmap comparison of IFN-α2, IFN-β, IFN-γ, IFN-λ1, IFN-λ2,3, IL-10, CXCL-10, IL-1β, IL-6, TNF-α, IL-8, IL12p70 protein levels in the BALF of COVID-19, ARDS, Transplant, Fibrosis and Sarcoidosis patients. The color is proportional to the Log10 transformed concentration (pg/ml) of each cytokine. Rows in each group represent different patients. Statistics: (A–D) Kruskal-Wallis test with Dunn’s post-hoc test: ns, not significant (P>0.05); *P<0.05, **P<0.01, ***P<0.001, and ****P<0.0001. NA: not available.
FIGURE 3.
FIGURE 3.. High viral loads drive the efficient production of IFN-III, and to a lesser extent of IFN-I, in an age-dependent manner in the upper airways of COVID-19 patients.
(A–H) IFNL1 (A), IFNL2,3 (B), IFNL4 (C), IFNB1 (D), IFNA2 (E), IFNA4 (F), IL1B (G), and IL6 (H) mRNA expression is plotted against mean viral RNA CT in SARS-CoV-2+ swabs. (A–H) Expression is plotted as log2 (gene/GAPDH mRNA + 0.5 × gene-specific minimum). Each dot represents a patient. Linear regression lines (continuous line) and 95% confidence interval (dashed line and shaded area) are depicted in red. Spearman correlation coefficients (r) and p-value (p) are indicated. (I–P) IFNL1 (I), IFNL2,3 (J), IFNL4 (K), IFNB1 (L), IFNA2 (M), IFNA4 (N), IL1B (O), and IL6 (P) mRNA expression is plotted against mean viral RNA CT in swabs from SARS-CoV-2+ patients over 70-year-old (≥ 70, blue dots and lines) and below 70-year-old (< 70, orange dots and lines). (I–P) Expression is plotted as log2 (gene/GAPDH mRNA + 0.5 × gene-specific minimum). Each dot represents a patient. Linear regression (continuous lines) and 95% confidence interval (dashed line and shaded area) are depicted. Spearman correlation coefficients (r) and p-value (p) are indicated in blue and in orange for ≥70 and <70 year-old patients respectively.
FIGURE 4.
FIGURE 4.. Mild COVID-19 is characterized by high levels of IFN-III, not IFN-I, in response to high viral loads in the upper airways
(A–L) Swabs from a cohort of SARS-CoV-2+ patients with known disease severity including ICU inpatients and hospitalized patients (HOSP, black dots and lines) and home-isolated patients (HI, red dots and lines) were analyzed. (A–H) IFNL1 (A), IFNL2,3 (B), IFNL4 (C), IFNB1 (D), IFNA2 (E), IFNA4 (F), IL1B (G), and IL6 (H) mRNA expression is plotted against mean viral RNA CT. Expression is plotted as log2 (gene/GAPDH mRNA + 0.5 × gene-specific minimum). Each dot represents a patient. Linear regression lines (continuous line) and 95% confidence interval (dashed line and shaded area) are depicted. Spearman correlation coefficients (r) and p-value (p) are indicated in black and in red for HOSP and HI patients respectively. (I) K-means clustering based on the expression of IFNA2, IFNB1 IFNL1, IFNL2,3, IL1B was used to determine clusters 1–3 (Cluster 1 n=15, Cluster 2 n=8, Cluster 3 n=6). The color indicates the relative gene expression. Viral load tercile, age group and severity are annotated. Viral load terciles (“+++”, “++”, “+”) are defined by mean viral RNA CT (<20, >20 and <30, > 30). Age groups are defined as <70 or ≥70-year old patients. Severity groups are defined as follows: HI=home isolated, HOSP (non ICU)=Hospitalized patients that did not require ICU admission, HOSP (ICU)=Hospitalized patients admitted to the ICU. (J) IFNL1, IFNL2,3, IFNA2, IFNB1, IL1B mRNA expression within clusters identified in Figure 4I. Expression is plotted as log2 (gene/GAPDH mRNA + 0.5 × gene-specific minimum). Each dot represents a patient. Violin plots are depicted. (K) Percentage of patients with the indicated disease severity within clusters identified in Figure 4I. (L) Odds ratio of patients in Cluster 2 and Cluster 1 being hospitalized relative to patients in Cluster 3 (Clusters identified in Figure 4I). Symbols represent the odds ratio. Error bars represent the 95% confidence interval associated to the odds ratio. Statistics: (L) Odds ratio: ns, not significant (P>0.05); *P<0.05, **P<0.01, ***P<0.001.
FIGURE 5.
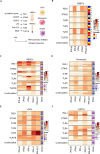
FIGURE 5.. Bronchial epithelial cells and phagocytes produce specific members of the IFN-III and IFN-I family when activated by different PRRs.
(A) Schematic of experimental setup. HBECs, PBMCs, Monocytes, cDCs and moDCs were treated for 24 hours with 3p-hpRNA/LyoVec, cGAMP, CpG(C), LPS, Poly (I:C), R848 for stimulation of RIG-I, STING, TLR9, TLR4, TLR3, TLR7/8 respectively. Cytokine expression was evaluated on RNA extracted from cell lysates and cytokine production was evaluated in supernatants (created with BioRender). (B–F) Heatmap representation of IFN-α2, IFN-β, IFN-γ, IFN-λ1 and IFN-λ2,3 production by HBECs (B), PMBCs (C), Monocytes (D), cDCs (E), moDCs (F) 24 hours after treatment. The color is proportional to the Log10 transformed concentration (pg/ml) of each cytokine. (B) Rows in each group represent a biological replicate. (C–F) Rows in each group represent different donors as depicted in the annotation.

References

    1. Lucas C. et al. , Longitudinal analyses reveal immunological misfiring in severe COVID-19. Nature 584, 463–469 (2020). - PMC - PubMed
    1. Lee J. S. et al. , Immunophenotyping of COVID-19 and influenza highlights the role of type I interferons in development of severe COVID-19. Sci Immunol 5, (2020). - PMC - PubMed
    1. Guan W. J. et al. , Clinical Characteristics of Coronavirus Disease 2019 in China. The New England journal of medicine 382, 1708–1720 (2020). - PMC - PubMed
    1. Zhou F. et al. , Clinical course and risk factors for mortality of adult inpatients with COVID-19 in Wuhan, China: a retrospective cohort study. Lancet 395, 1054–1062 (2020). - PMC - PubMed
    1. Iwasaki A., Medzhitov R., Regulation of adaptive immunity by the innate immune system. Science 327, 291–295 (2010). - PMC - PubMed

Publication types

LinkOut - more resources