[Preprint]. 2021 May 29:2021.03.31.21254660.
doi: 10.1101/2021.03.31.21254660.

Neutralizing activity of Sputnik V vaccine sera against SARS-CoV-2 variants

Affiliations

Neutralizing activity of Sputnik V vaccine sera against SARS-CoV-2 variants

Satoshi Ikegame et al. medRxiv. .

Update in

Abstract

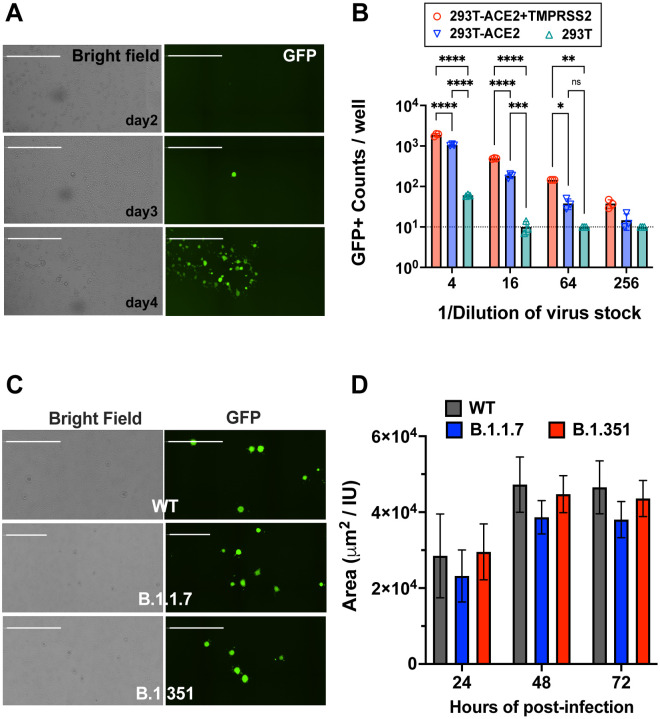
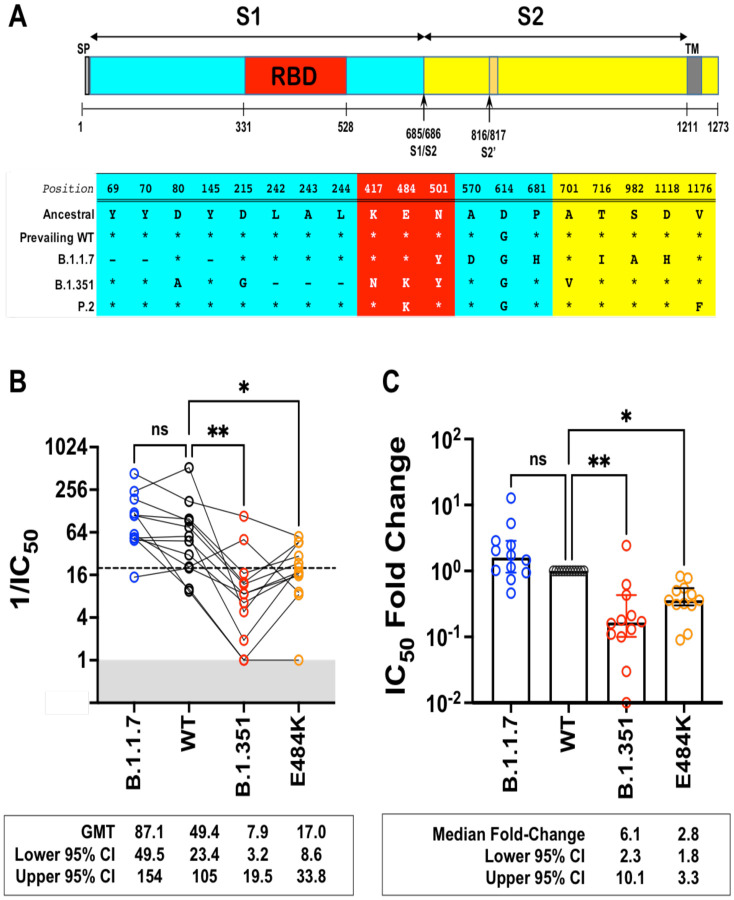
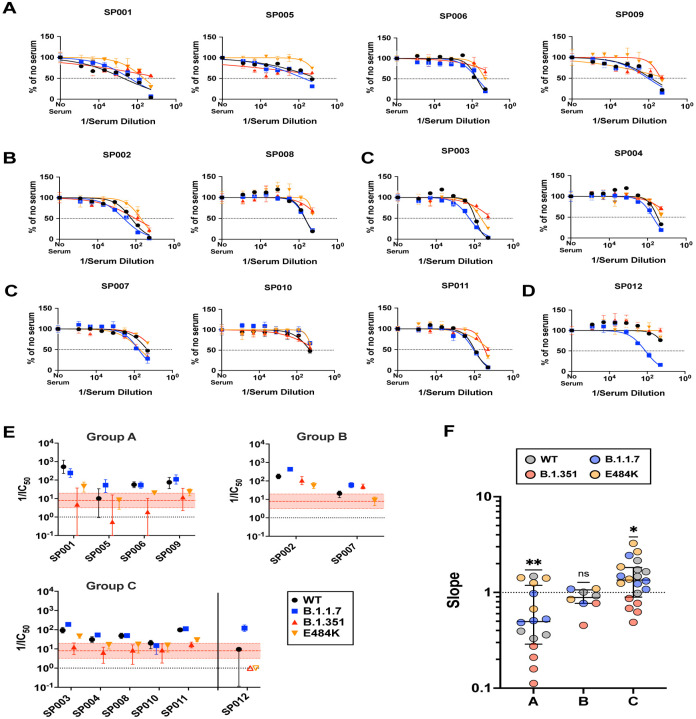
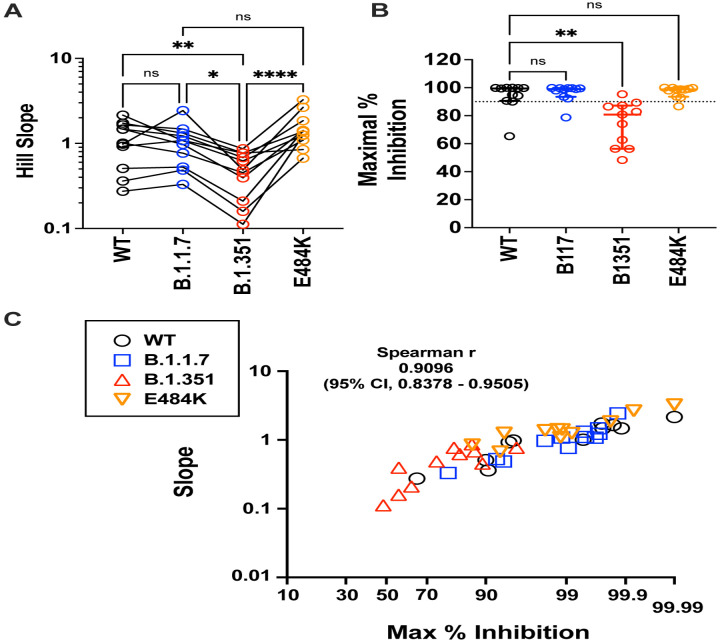
The novel pandemic betacoronavirus, severe acute respiratory syndrome coronavirus 2 (SARS-CoV-2), has infected at least 120 million people since its identification as the cause of a December 2019 viral pneumonia outbreak in Wuhan, China. Despite the unprecedented pace of vaccine development, with six vaccines already in use worldwide, the emergence of SARS-CoV-2 'variants of concern' (VOC) across diverse geographic locales suggests herd immunity may fail to eliminate the virus. All three officially designated VOC carry Spike (S) polymorphisms thought to enable escape from neutralizing antibodies elicited during initial waves of the pandemic. Here, we characterize the biological consequences of the ensemble of S mutations present in VOC lineages B.1.1.7 (501Y.V1) and B.1.351 (501Y.V2). Using a replication-competent EGFP-reporter vesicular stomatitis virus (VSV) system, rcVSV-CoV2-S, which encodes S from SARS coronavirus 2 in place of VSV-G, and coupled with a clonal HEK-293T ACE2 TMPRSS2 cell line optimized for highly efficient S-mediated infection, we determined that only 1 out of 12 serum samples from a cohort of recipients of the Gamaleya Sputnik V Ad26 / Ad5 vaccine showed effective neutralization (IC90) of rcVSV-CoV2-S: B.1.351 at full serum strength. The same set of sera efficiently neutralized S from B.1.1.7 and showed only moderately reduced activity against S carrying the E484K substitution alone. Taken together, our data suggest that control of some emergent SARS-CoV-2 variants may benefit from updated vaccines.


Conflict of interest statement

Competing interests: B.L. and K.Y.O. are named inventors on a patent filed by the Icahn School of Medicine for some of the materials used in this work. J.P.K. is a consultant for BioNTech (advisory panel on coronavirus variants).

Figures

Figure 1.
Figure 1.. Replication-competent VSV bearing wild-type and variant SARS-CoV-2 spike (rcVSV-CoV2-S).
(A) Representative images of de novo generation of rcVSV-CoV2-S, carrying an EGFP reporter, in transfected 293T-ACE2+TMPRSS2 (F8–2) cells as described in Extended Data Fig. S1. Single GFP+ cells detected at 2–3 days post-transfection (dpt) form a foci of syncytia by 4 dpt. Images are taken by Celigo imaging cytometer (Nexcelom) and are computational composites from the identical number of fields in each well. White bar is equal to 1 millimeter. (B) Entry efficiency of rcVSV-CoV2-S in parental 293T cells, 293T stably expressing ACE2 alone (293T-ACE2) or with TMPRSS2 (293T-ACE2+TMPRSS2). Serial dilutions of virus stocks amplified on Vero-TMPRSS2 cells were used to infect the indicated cell lines in 96-well plates in triplicates. GFP signal was detected and counted by a Celigo imaging cytometer (Nexcelom) 10 hours post-infection. Symbols are individual data points from triplicate infections at the indicated dilutions. Bars represent the average of 3 replicates with error bars indicating standard deviation. A two-way ANOVA was used to compare the differences between cell lines at any given dilution. Adjusted p values from Tukey’s multiple comparisons test are given (ns; not significant, * p < 0.05, ** p < 0.01, *** p < 0.001, **** p < 0.0001). (C) rcVSV-CoV-2-S containing the prevailing WT (D614G) and VOC (B.1.1.7 and B.1.351) spikes were inoculated into one 6-well each of F8–2 cells (MOI 0.1) and subsequently overlaid with methylcellulose-DMEM to monitor syncytia formation. Representative images of syncytial plaques at 48 hpi are shown. White bar equals 1 millimeter. (D) shows the growth of GFP positive area / infectious unit (IU) in the 6 well plate. GFP positive areas were imaged and measured by the Celigo imaging cytometer. IU was checked at 10 hpi in the same well. Bar shows the average of 3 independent experiments with error bar indicating standard deviation. No statistically significant differences were detected between WT and VOC spikes in the size of GFP+ syncytia at any given time point (two-way ANOVA as above, ‘ns’ not indicated in graph).
Figure 2.
Figure 2.. Neutralization activity of antibody responses elicited by the Sputnik V vaccine.
(A) Schematic of the Spike substitutions that make up the variants being evaluated in this study. The amino acid positions and corresponding ‘Ancestral’ sequence of the Wuhan isolate is shown. The prevailing WT sequence now has a D614G substitution. All the variants and mutants have D614G. (B) Neutralization activity of individual serum samples against rcVSV-CoV2-S with the WT, variant (B.1.1.7 or B.1.351), or mutant E484K spike proteins. Neutralization is represented by the reciprocal 50% inhibitory dilution factor (1/IC50). Sera samples with no appreciable neutralization against a given virus were assigned a defined 1/IC50 value of 1.0, as values ≤1 are not physiological (Grey shaded area). Dashed line indicates the lowest serum dilution tested (1/IC50 = 20). Geometric mean titers (GMT and 95% CI) for the neutralizing activity of all vaccine sera are indicated below each of the viral spike proteins examined . NS; not significant, *; p<0.05, p < 0.01; ** are adjusted p values from non-parametric one-way ANOVA with Dunn’s multiple comparisons test. (C) For each serum sample, the fold-change in IC50 (reciprocal inhibitory dilution factor) against the indicated variant and mutant spike proteins relative to its IC50 against wild-type (WT) spike (set at 1) is plotted. Adjusted p values were calculated as in (B). Medians are represented by the bars and whiskers demarcate the 95% CI. Neutralization dose-response curves were performed in triplicates, and the mean values from each triplicate experiment are shown as the single data points for each sera sample.
Figure 3.
Figure 3.. Sputnik vaccine recipients generate qualitatively different neutralizing antibody responses against SARS-CoV-2.
(A-C) Group A (SP001, SP005, SP006, SP012), Group B (SP002, SP007), and Group C (SP003, SP004, SP008, SP010, SP011) represent potentially distinct classes of virus neutralizing activity present in the sera samples analyzed. Full neutralization curves for all sera tested against all viruses bearing the variant and mutant spike proteins are shown. (D) shows a singular example of a serum that only neutralized the B.1.1.7 spike. (E) graphs the serum neutralizing titers (SNT = 1/IC50) and 95% CI that can be extrapolated from the nonlinear regression curves shown for all the sera samples analyzed. Colored filled symbols represent the indicated viruses, open symbols in (E) represent assigned SNT values of 1.0 when no significant neutralization activity could be detected (SP012, B.1.351 and E484K). The dotted black line represents a reciprocal serum dilution of 1.0. The red dashed line and shaded boundaries represent the geometric mean titer and 95% CI, respectively, for B.1.351. (F) The Hill slope values for all the neutralization curves are aggregated according to their groups. The different colored symbols in each group represent the indicated virus tested. P values are from a non-parametric Wilcoxon signed rank test using a theoretical median of 1.0.
Figure 4.
Figure 4.. Maximal inhibition and slope help to define the distinct classes of neutralizing sera in Sputnik vaccine recipients.
(A) Paired comparison of Hillslopes from the neutralization curves of all samples except for SP012 where no significant neutralization was observed for viruses other than B.1.1.7. NS; not significant, p<0.05, *; p<0.01; **, p < 0.0001; ****, are adjusted p values from non-parametric one-way ANOVA with Dunn’s multiple comparisons test, which assumes non-Gaussian distribution of values being analyzed. (B) Maximal percent inhibition (MPI) at full serum strength extrapolated from nonlinear regression of log(inhibitor) versus normalized response, variable slope curve. Model used is from PRISM v9.1 where Y= 100/(1+10^((LogIC50-X)*HillSlope))). Log IC50 and Hill slope values were obtained for each curve generated in Fig. 3. MPI = 100-Y, when X= 0 for reciprocal serum dilution of 1 (10^0 =1). Data points for one serum (SP012) against WT, B.1.351 and E484K could not be calculated because there was no best-fit value. The dotted line indicates 90% inhibition. Median (central bar) and interquartile values (whiskers) are indicated. Adjusted p values was calculated as in (A). (C) Correlation analysis of MPI versus the Hill Slope parameter for all sera samples tested against all spike proteins. SP012 was excluded for the abovementioned reasons. Non-parametric Spearman r values and 95% confidence interval are shown. X-axis is plotted as an asymptotic cumulative probability scale as x approaches 100% (PRISM v9.1.1) only to resolve the many MPI values >90%.
Figure 5.
Figure 5.. Competitive inhibition of rcVSV-CoV2-S entry by soluble RBD-Fc.
(A) Recombinant RBD-Fc was serially titrated with the infection inoculum containing a fixed amount of rcVSV-CoV2-S bearing WT or the indicated VOC spike proteins. 10 hpi, GFP+ cells were quantified by the Celigo image cytometer. Data points are means of six independent replicates with error bars representing S.D. The number of GFP+ cells in the absence of any RBD-Fc was set to 100% and used to normalize the infection response in the presence of increasing amounts of RBD-Fc. Log[inhibitor] versus normalized response variable slope nonlinear regression curves were generated using GraphPad PRISM (v9.1.0). (B) The IC50 values from each replicate dose response curve generated for a given virus were grouped. The mean (central bar) and SD (whiskers) for each group are indicated. Adjusted p values (*; p<0.05, **; p<0.01, ****; p<0.0001) from ordinary one-way ANOVA with Dunnett’s multiple comparisons test are indicated. (C) is a repeat of the experiment done in A with the E484K mutant using a different preparation of recombinant RBD-Fc (see methods). B.1.1.7 serves as the common reference control. (D) The IC50 values were calculated and analyzed as in (B).

References

    1. Huang C. et al. Clinical features of patients infected with 2019 novel coronavirus in Wuhan, China. Lancet 395, 497–506 (2020). - PMC - PubMed
    1. COVID-19 Map - Johns Hopkins Coronavirus Resource Center. https://coronavirus.jhu.edu/map.html.
    1. Boni M. F. et al. Evolutionary origins of the SARS-CoV-2 sarbecovirus lineage responsible for the COVID-19 pandemic. Nat Microbiol 382, 1199 (2020). - PubMed
    1. Logunov D. Y. et al. Safety and efficacy of an rAd26 and rAd5 vector-based heterologous prime-boost COVID-19 vaccine: an interim analysis of a randomised controlled phase 3 trial in Russia. Lancet 397, 671–681 (2021). - PMC - PubMed
    1. Baden L. R. et al. Efficacy and safety of the mRNA-1273 SARS-CoV-2 vaccine. N. Engl. J. Med. 384, 403–416 (2021). - PMC - PubMed

Publication types

LinkOut - more resources