

This is a preprint.
Estimating the strength of selection for new SARS-CoV-2 variants
- PMID: 33821289
- PMCID: PMC8020992
- DOI: 10.1101/2021.03.29.21254233
Estimating the strength of selection for new SARS-CoV-2 variants
Update in
-
Estimating the strength of selection for new SARS-CoV-2 variants.Nat Commun. 2021 Dec 14;12(1):7239. doi: 10.1038/s41467-021-27369-3. Nat Commun. 2021. PMID: 34907182 Free PMC article.
Abstract
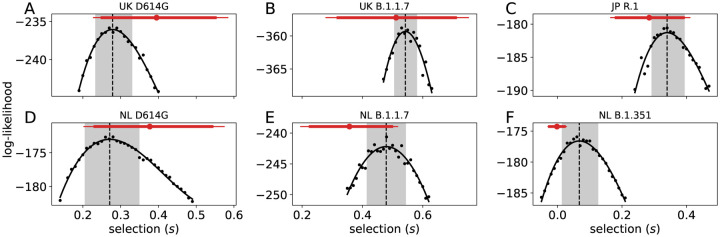
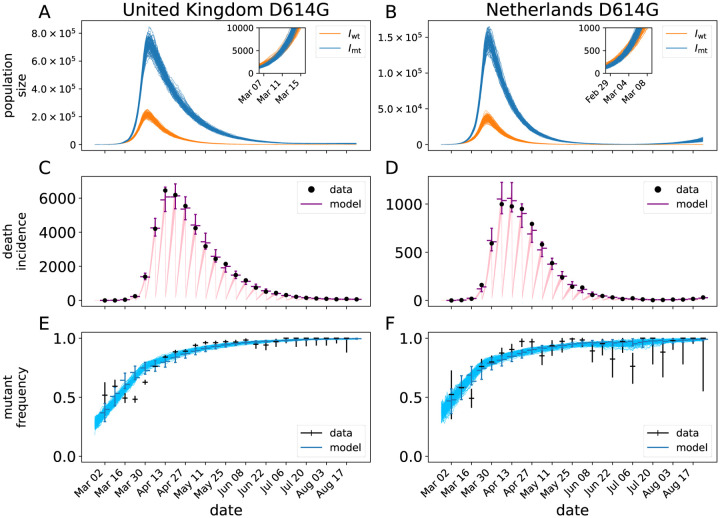
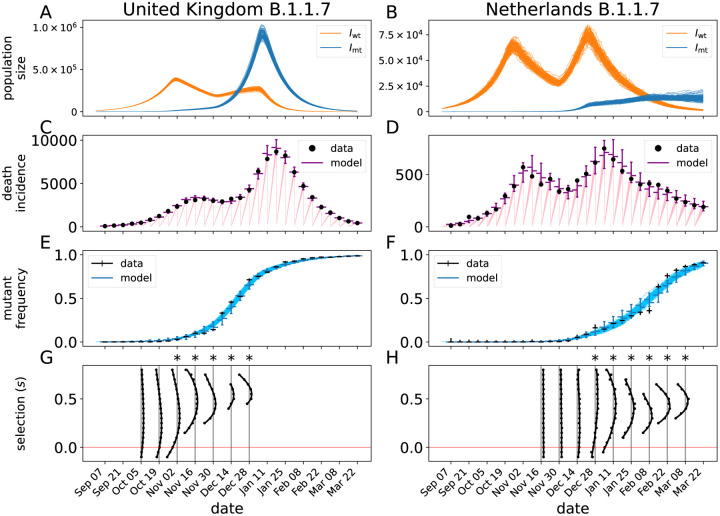
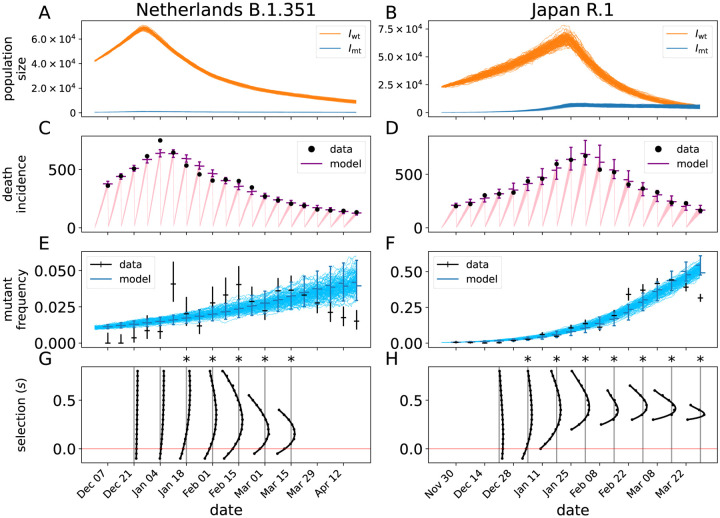
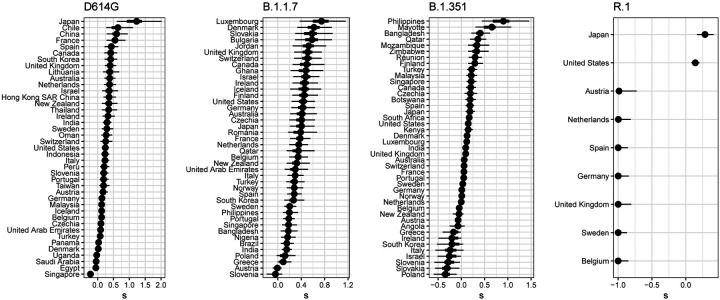
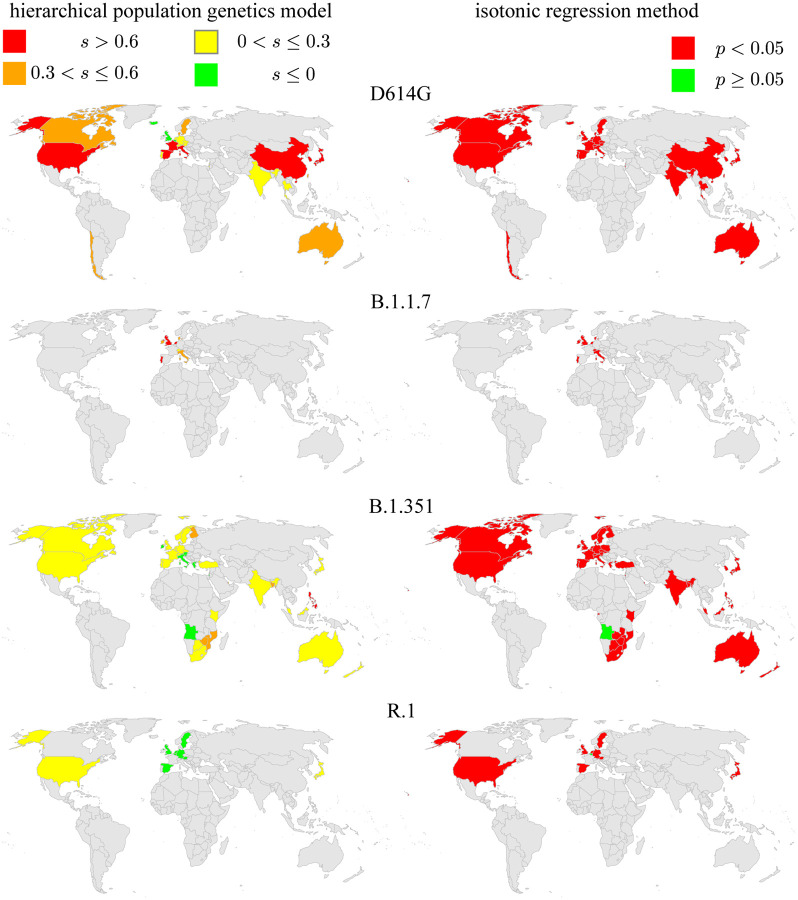
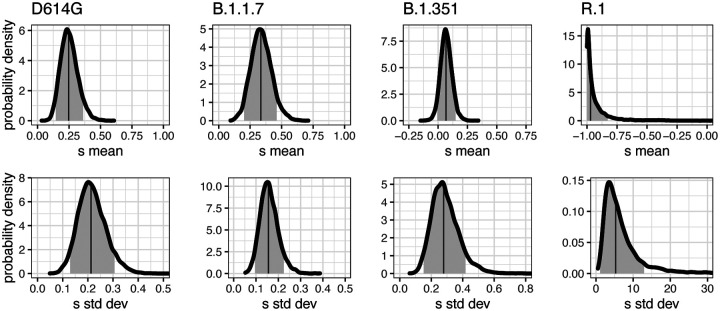
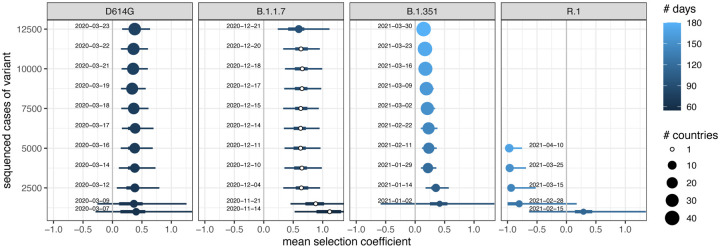
Controlling the SARS-CoV-2 pandemic becomes increasingly challenging as the virus adapts to human hosts through the continual emergence of more transmissible variants. Simply observing that a variant is increasing in frequency is relatively straightforward, but more sophisticated methodology is needed to determine whether a new variant is a global threat and the magnitude of its selective advantage. We present three methods for quantifying the strength of selection for new and emerging variants of SARS-CoV-2 relative to the background of contemporaneous variants. These methods range from a detailed model of dynamics within one country to a broad analysis across all countries, and they include alternative explanations such as migration and drift. We find evidence for strong selection favoring the D614G spike mutation and B.1.1.7 (Alpha), weaker selection favoring B.1.351 (Beta), and no advantage of R.1 after it spreads beyond Japan. Cutting back data to earlier time horizons reveals large uncertainty very soon after emergence, but that estimates of selection stabilize after several weeks. Our results also show substantial heterogeneity among countries, demonstrating the need for a truly global perspective on the molecular epidemiology of SARS-CoV-2.
Figures
Similar articles
-
Estimating the strength of selection for new SARS-CoV-2 variants.Nat Commun. 2021 Dec 14;12(1):7239. doi: 10.1038/s41467-021-27369-3. Nat Commun. 2021. PMID: 34907182 Free PMC article.
-
Selection for infectivity profiles in slow and fast epidemics, and the rise of SARS-CoV-2 variants.Elife. 2022 May 19;11:e75791. doi: 10.7554/eLife.75791. Elife. 2022. PMID: 35587653 Free PMC article.
-
The Spike-Stabilizing D614G Mutation Interacts with S1/S2 Cleavage Site Mutations To Promote the Infectious Potential of SARS-CoV-2 Variants.J Virol. 2022 Oct 12;96(19):e0130122. doi: 10.1128/jvi.01301-22. Epub 2022 Sep 19. J Virol. 2022. PMID: 36121299 Free PMC article.
-
D614G mutation and SARS-CoV-2: impact on S-protein structure, function, infectivity, and immunity.Appl Microbiol Biotechnol. 2021 Dec;105(24):9035-9045. doi: 10.1007/s00253-021-11676-2. Epub 2021 Nov 10. Appl Microbiol Biotechnol. 2021. PMID: 34755213 Free PMC article. Review.
-
The Development of SARS-CoV-2 Variants: The Gene Makes the Disease.J Dev Biol. 2021 Dec 15;9(4):58. doi: 10.3390/jdb9040058. J Dev Biol. 2021. PMID: 34940505 Free PMC article. Review.
References
-
- Tegally H. et al. Detection of a SARS-CoV-2 variant of concern in South Africa. Nature 592, 438–443 (2021). - PubMed
-
- Volz E. et al. Transmission of SARS-CoV-2 lineage B.1.1.7 in England: Insights from linking epidemiological and genetic data. medRxiv (2021).
-
- Challen R. et al. Early epidemiological signatures of novel SARS-CoV-2 variants: establishment of B.1.617.2 in England. medRxiv (2021).
Publication types
Grants and funding
LinkOut - more resources
Full Text Sources
Other Literature Sources
Miscellaneous