. 2021 Sep;86(3):1494-1504.
doi: 10.1002/mrm.28796. Epub 2021 Apr 6.

Cardiac T2 measurement of hyperpolarized 13 C metabolites using metabolite-selective multi-echo spiral imaging

Affiliations

Cardiac T2 measurement of hyperpolarized 13 C metabolites using metabolite-selective multi-echo spiral imaging

Junjie Ma et al. Magn Reson Med. 2021 Sep.

Abstract

Purpose: Noninvasive imaging with hyperpolarized (HP) pyruvate can capture in vivo cardiac metabolism. For proper quantification of the metabolites and optimization of imaging parameters, understanding MR characteristics such as T2 s of the HP signals is critical. This study is to measure in vivo cardiac T2 s of HP [1-13 C]pyruvate and the products in rodents and humans.

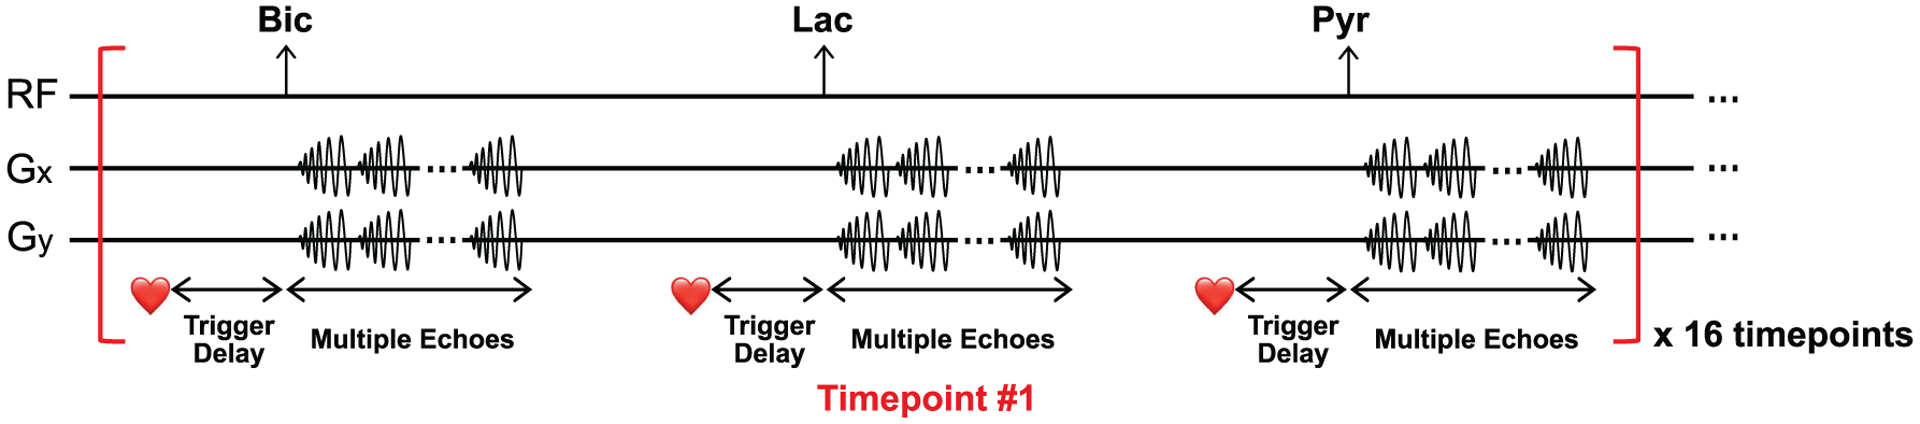
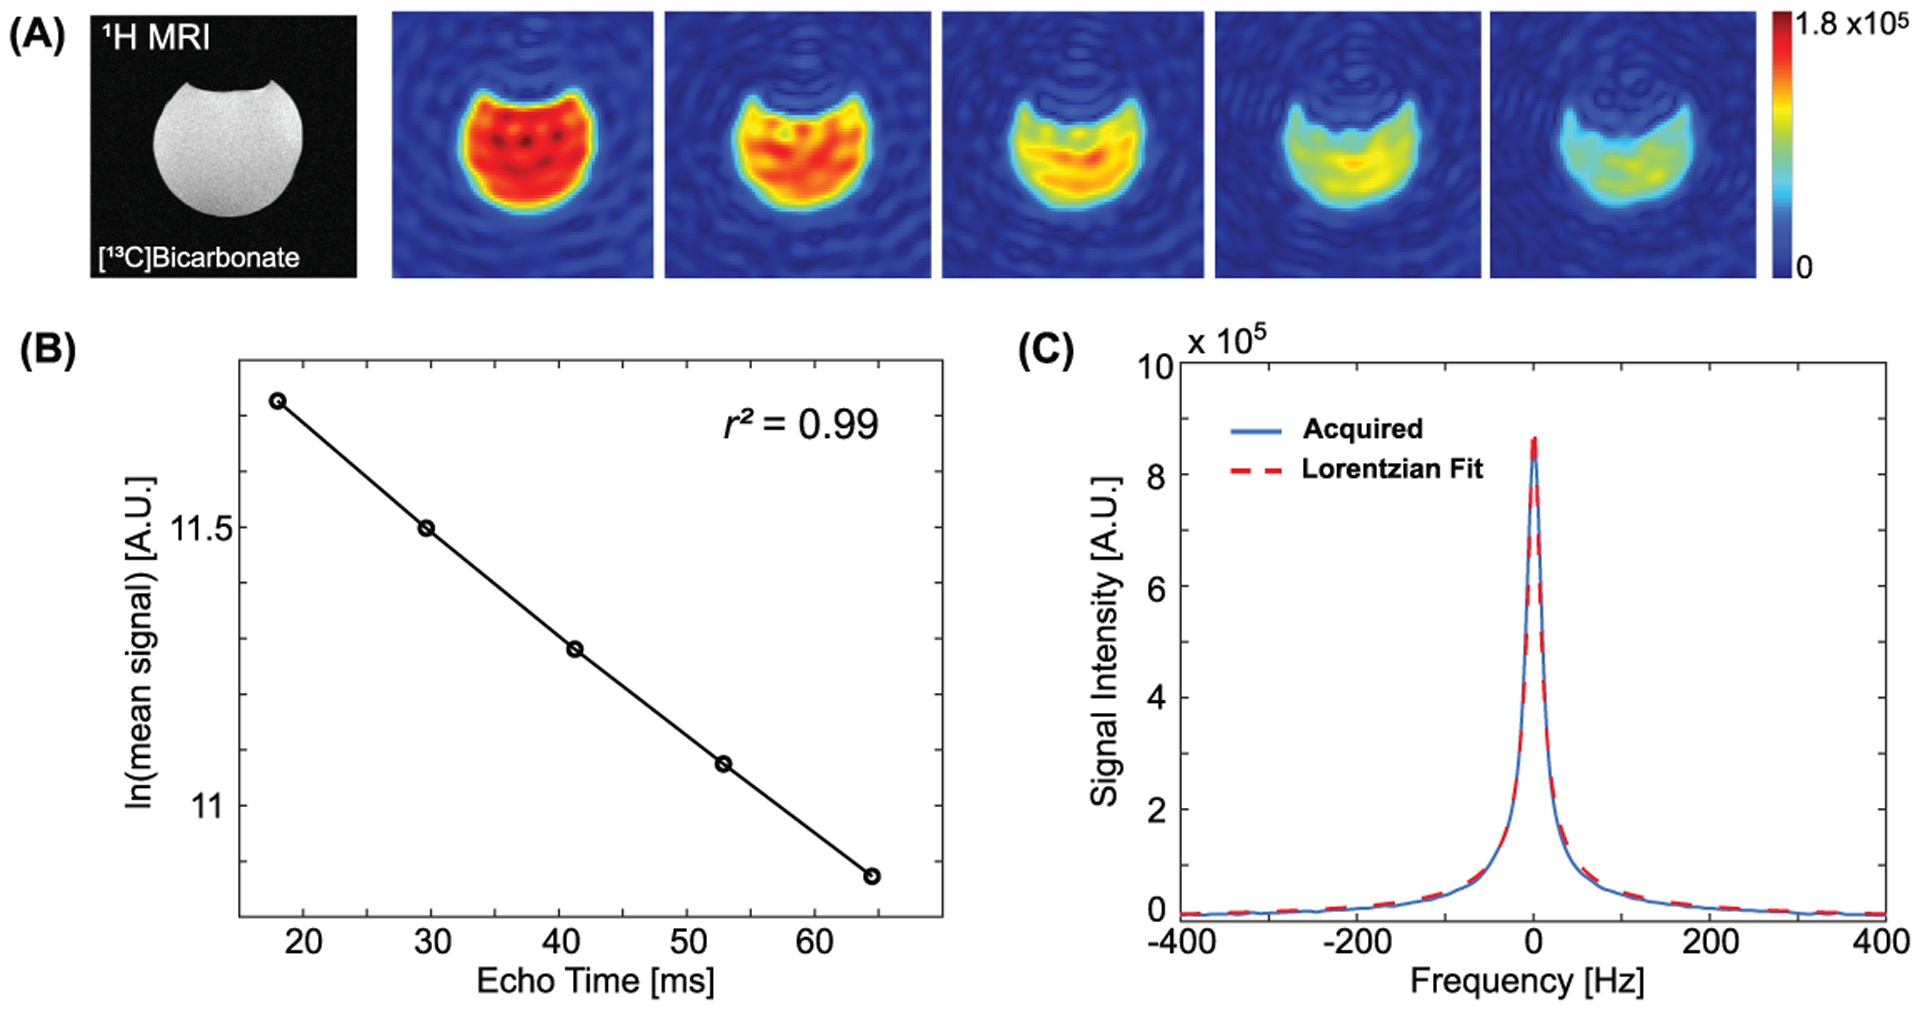
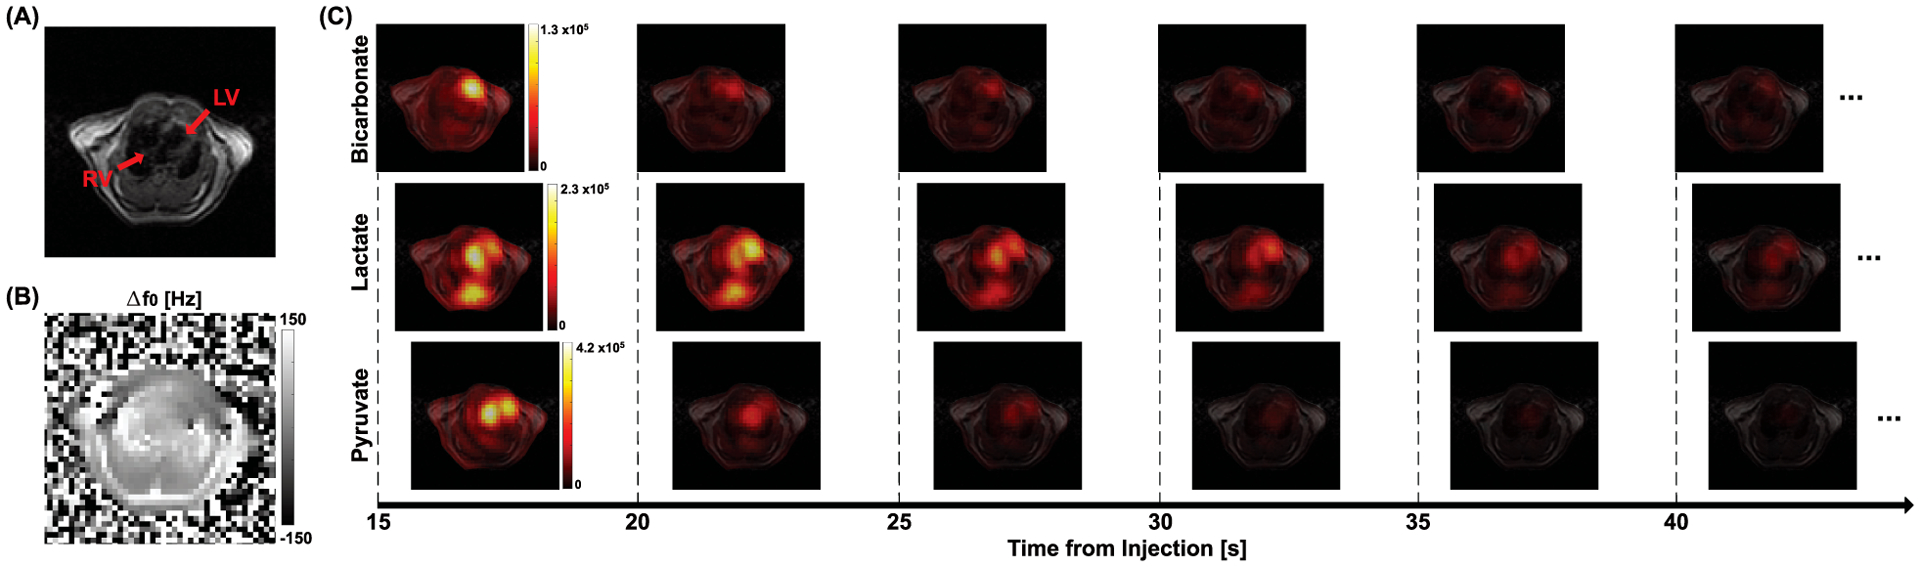
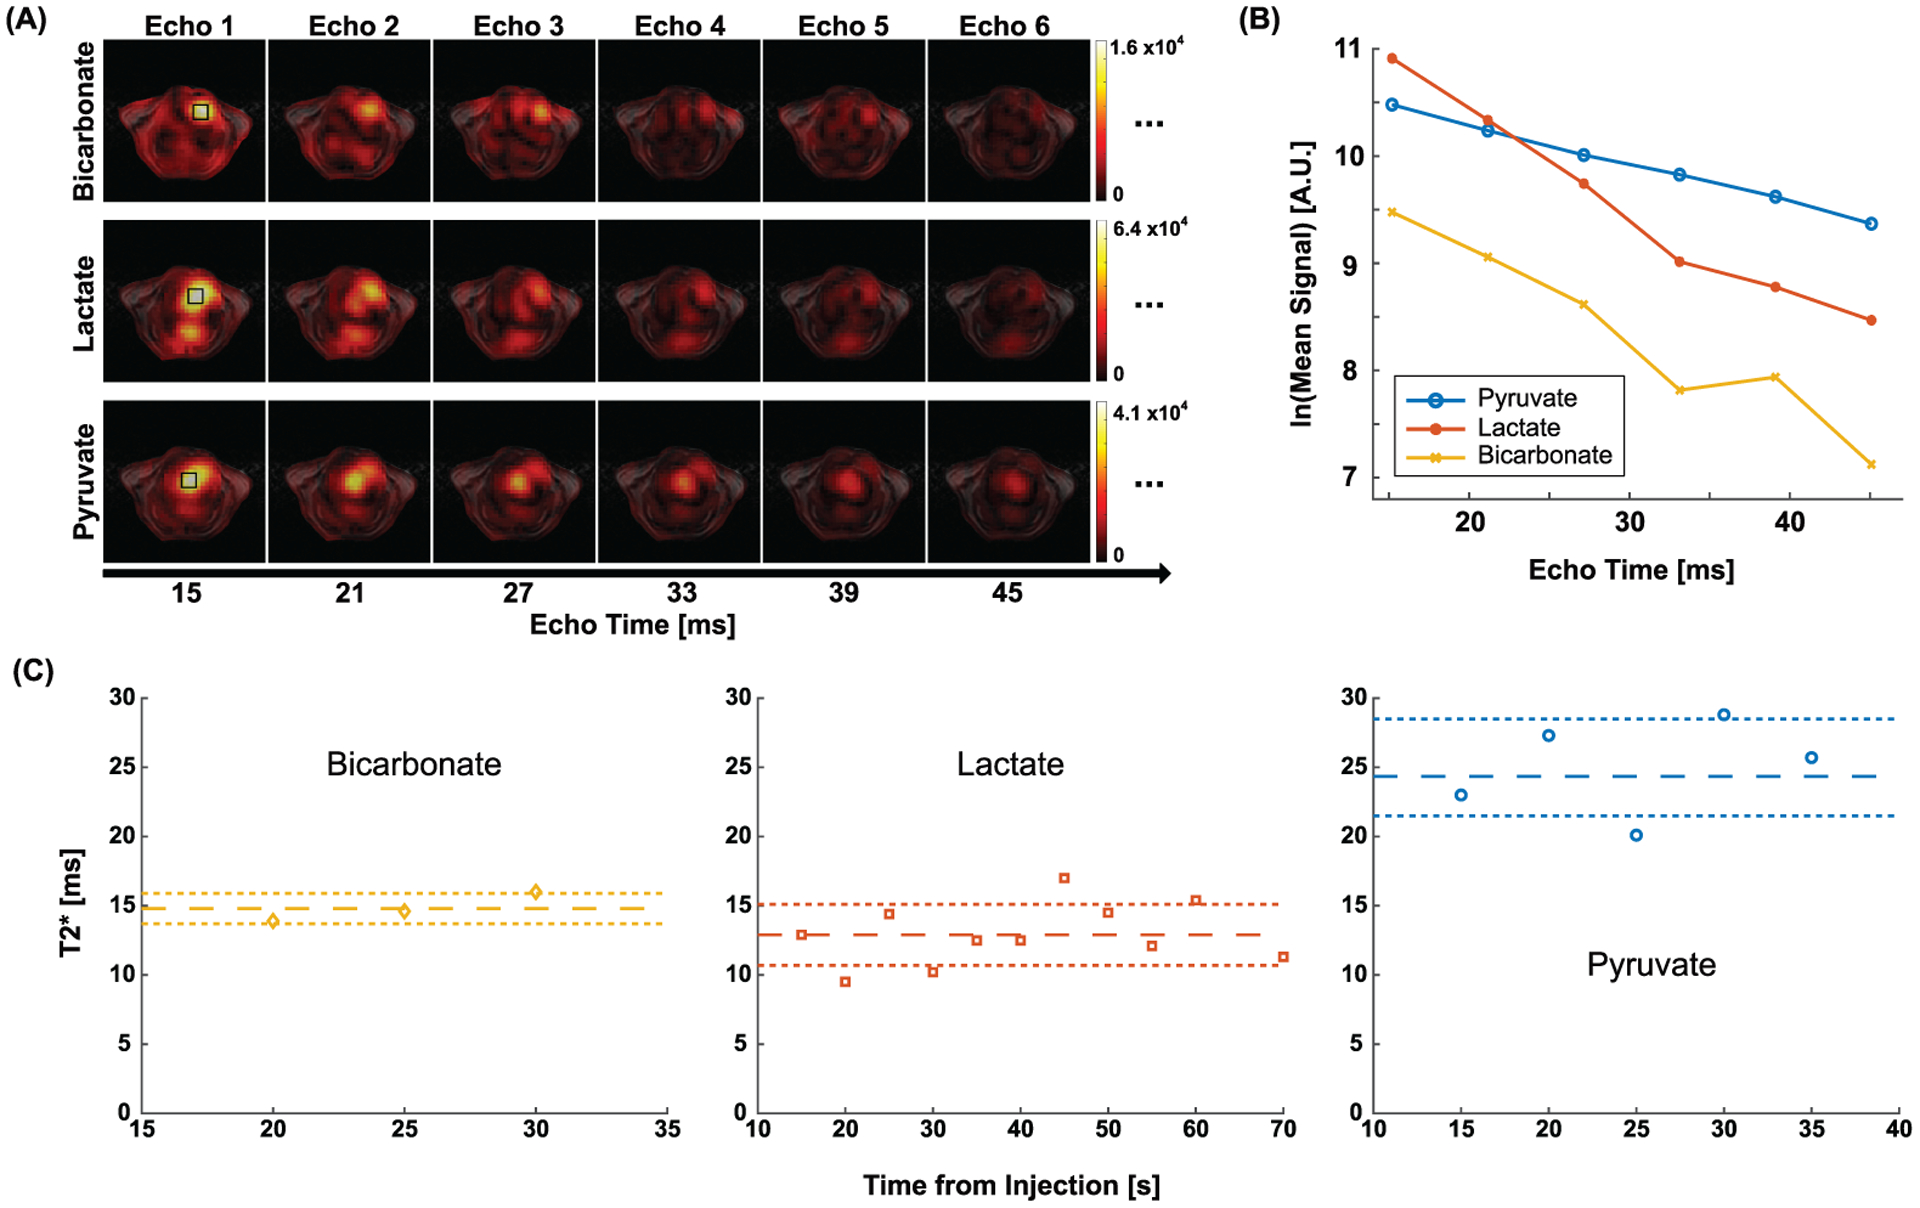
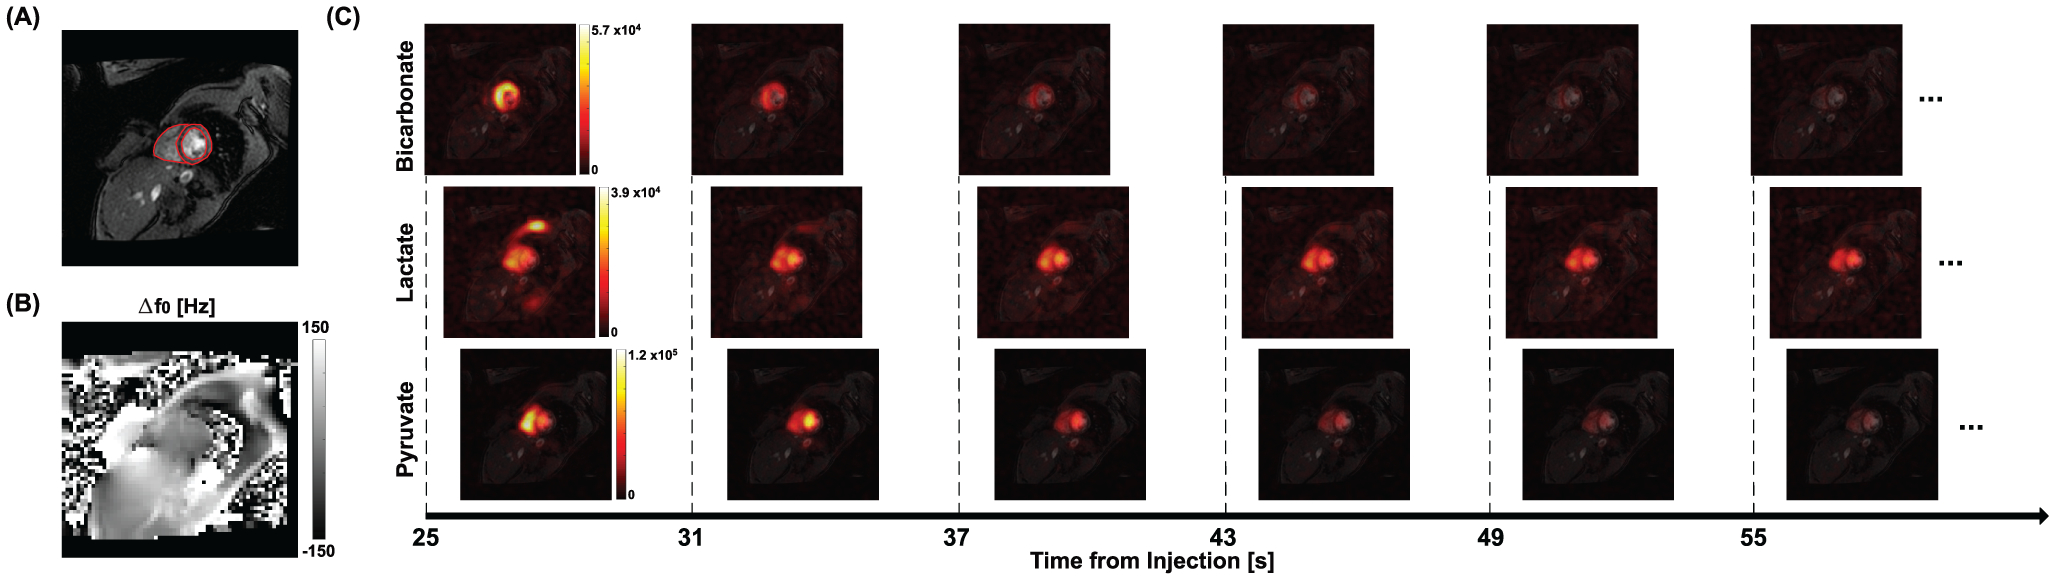
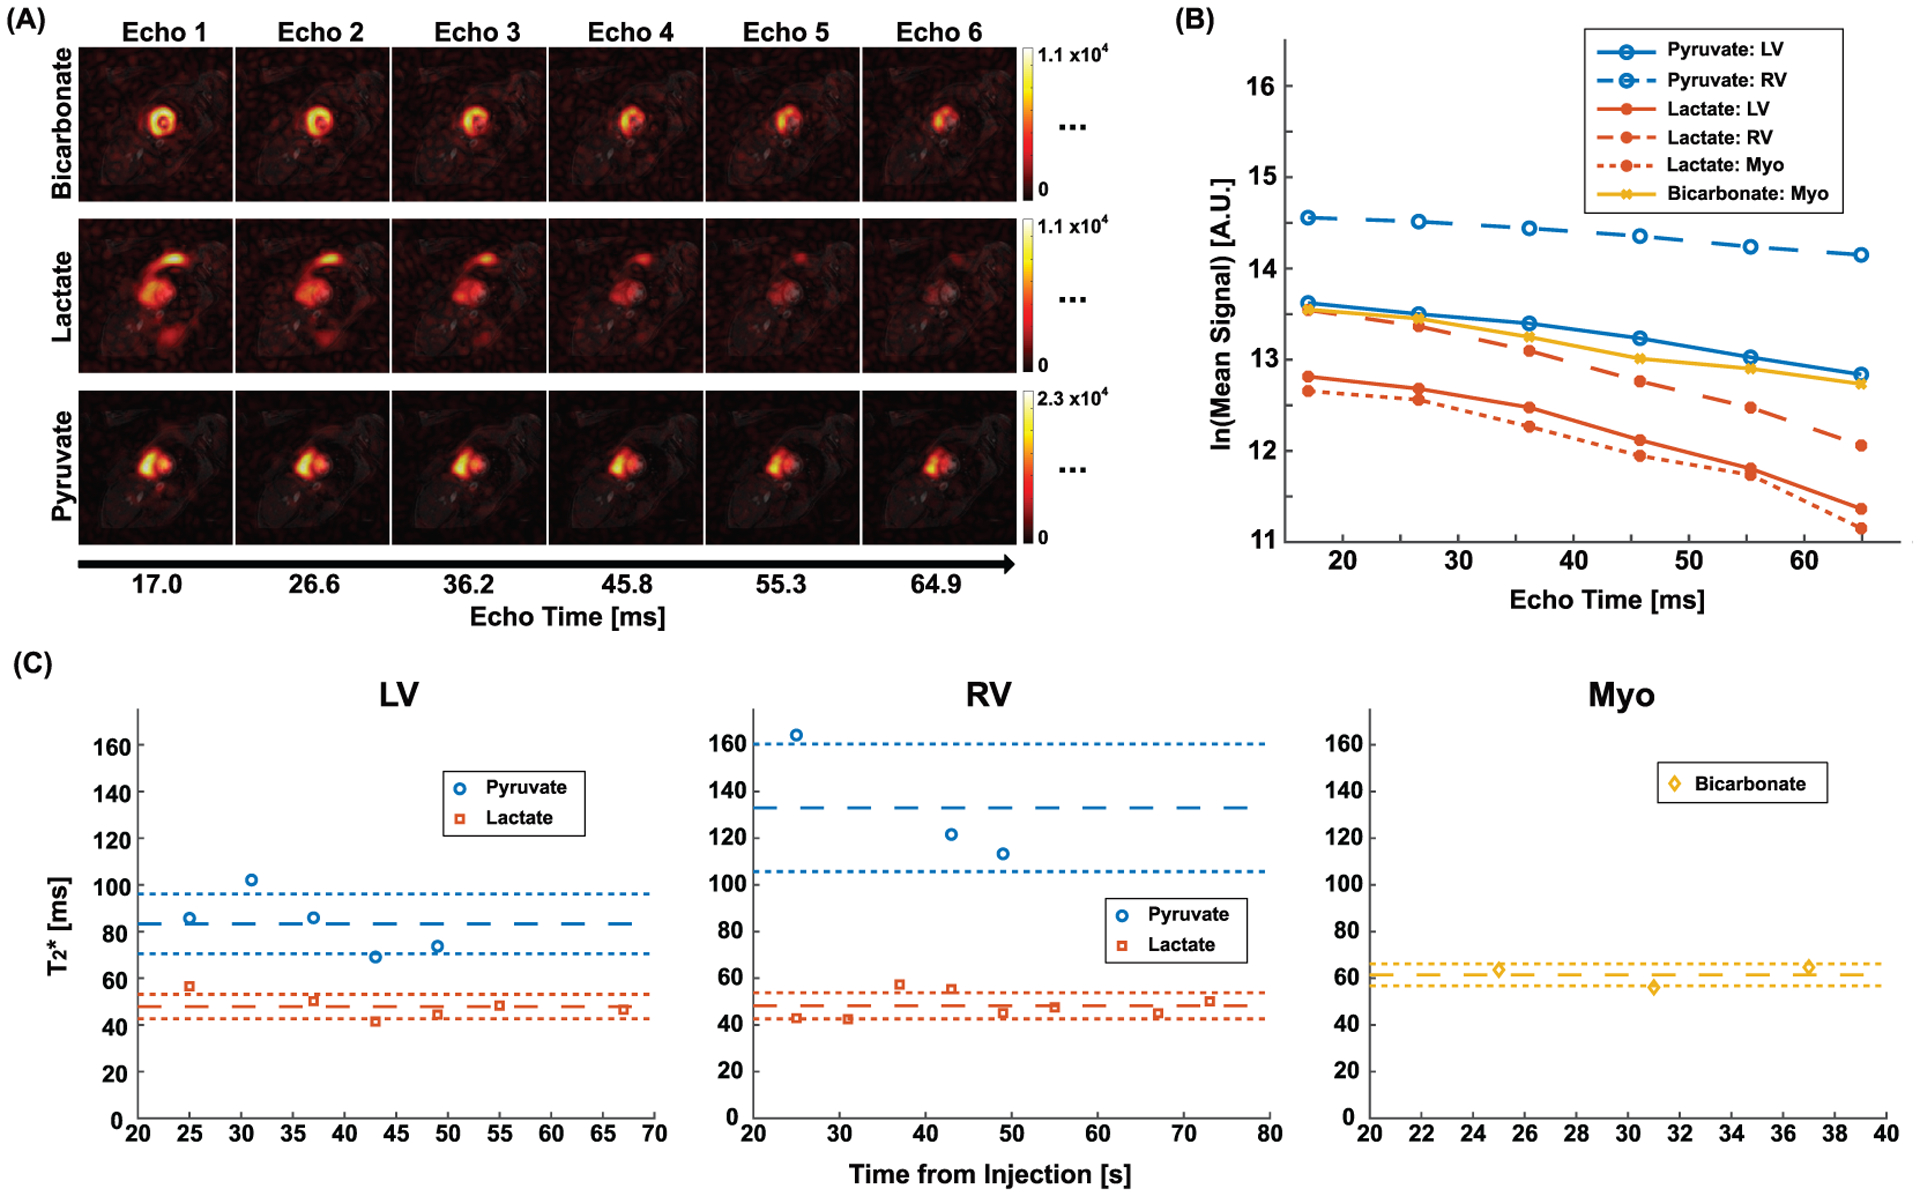
Methods: A dynamic 13 C multi-echo spiral imaging sequence that acquires [13 C]bicarbonate, [1-13 C]lactate, and [1-13 C]pyruvate images in an interleaved manner was implemented for a clinical 3 Tesla system. T2 of each metabolite was calculated from the multi-echo images by fitting the signal decay of each region of interest mono-exponentially. The performance of measuring T2 using the sequence was first validated using a 13 C phantom and then with rodents following a bolus injection of HP [1-13 C]pyruvate. In humans, T2 of each metabolite was calculated for left ventricle, right ventricle, and myocardium.
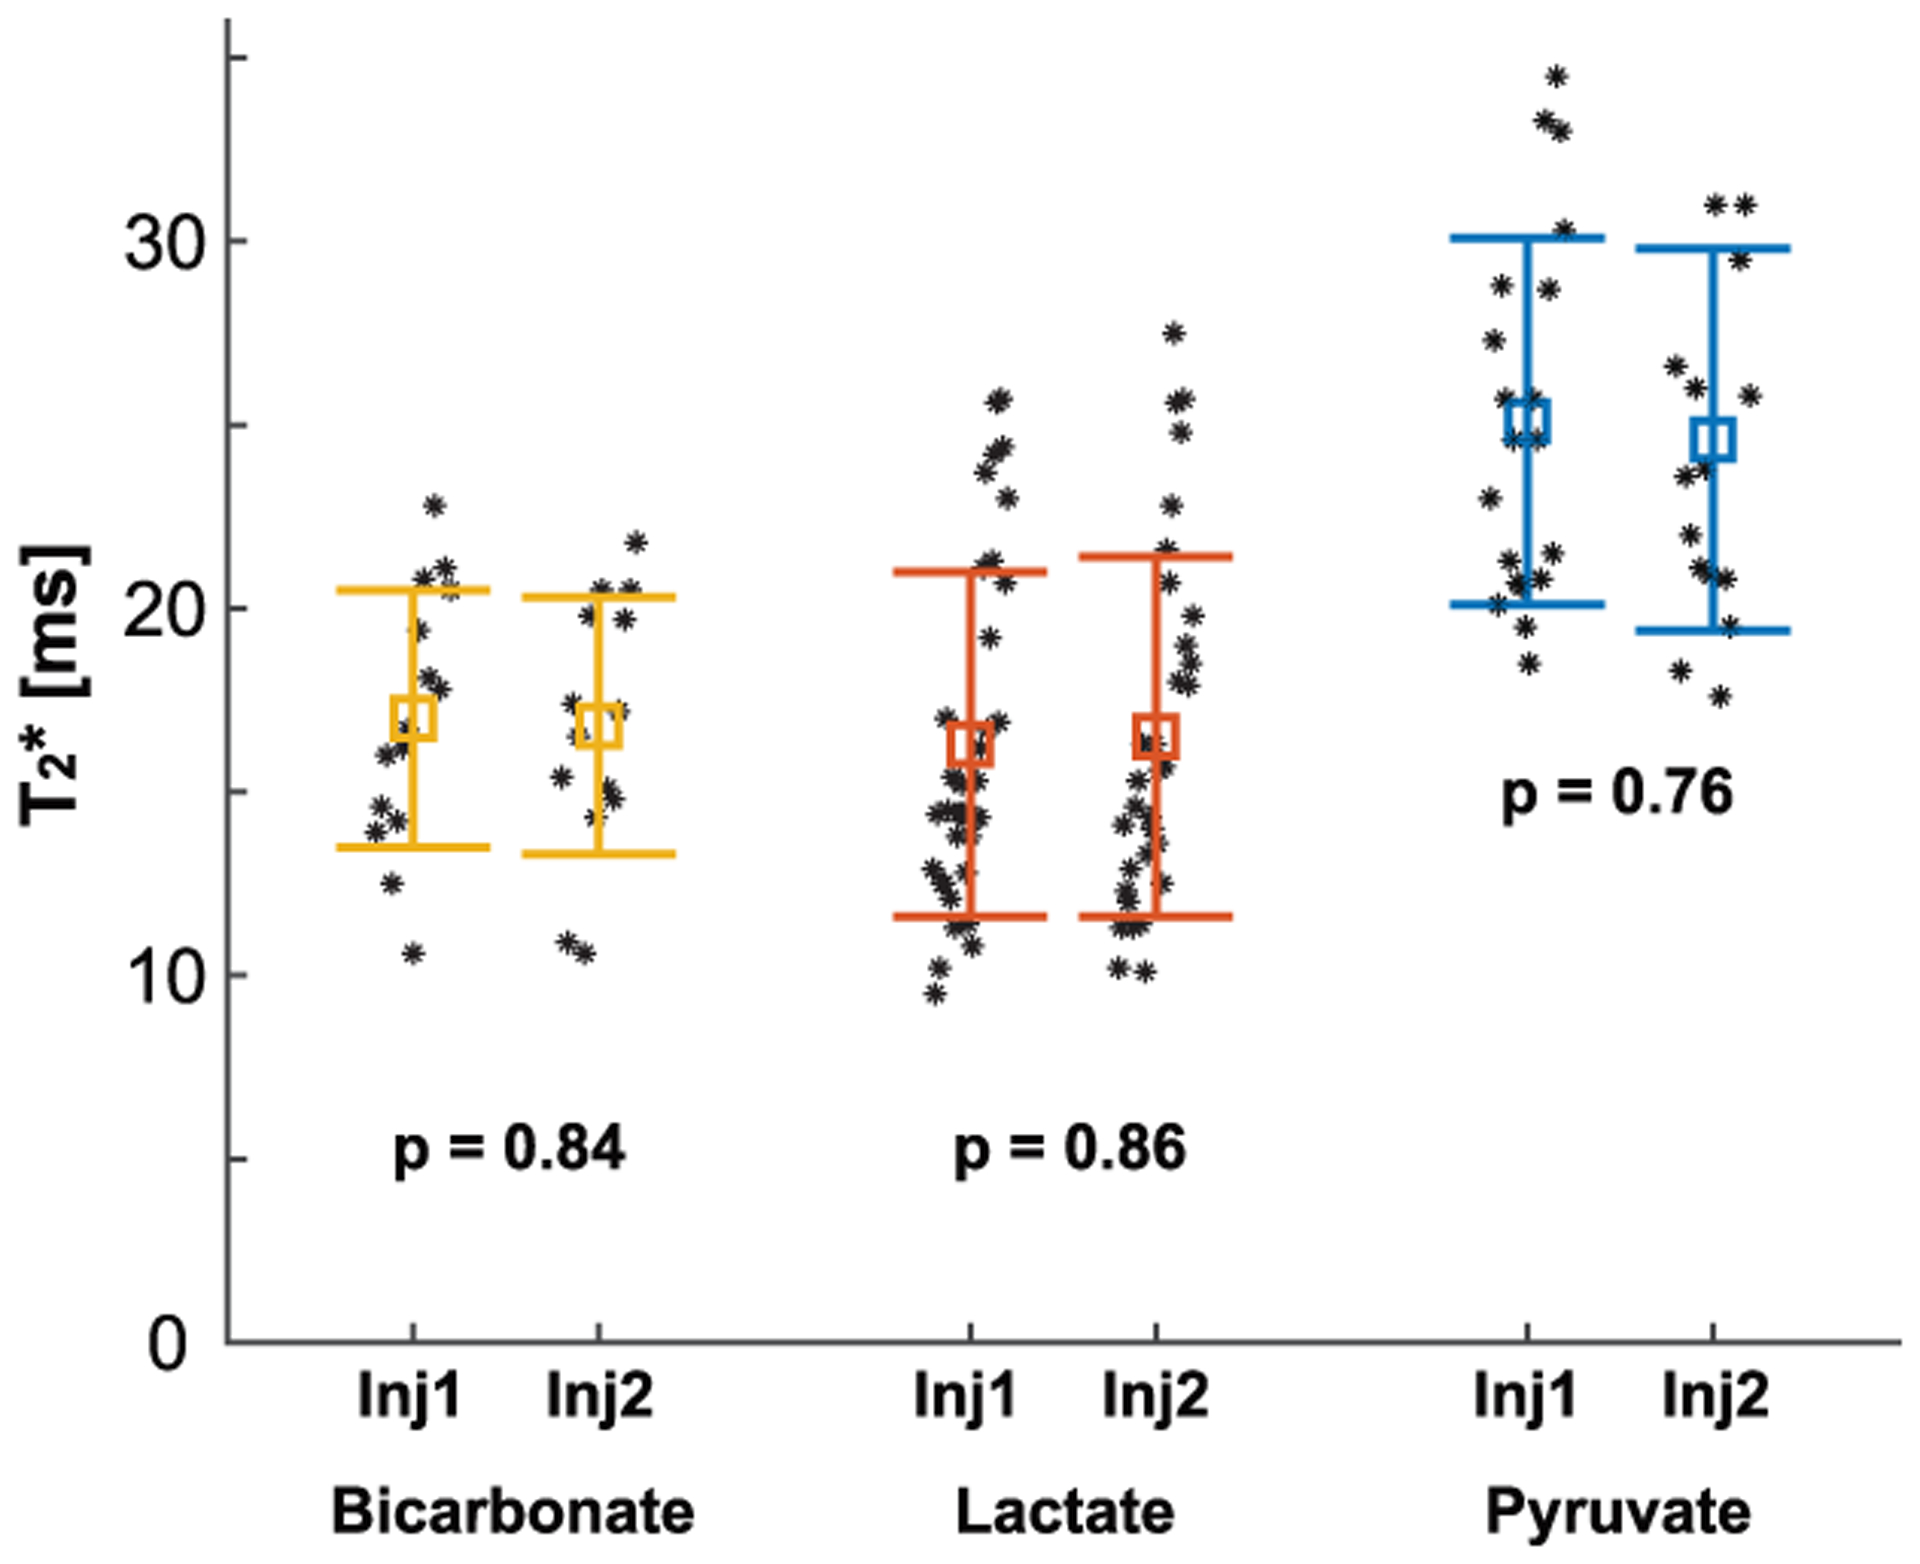
Results: Cardiac T2 s of HP [1-13 C]pyruvate, [1-13 C]lactate, and [13 C]bicarbonate in rodents were measured as 24.9 ± 5.0, 16.4 ± 4.7, and 16.9 ± 3.4 ms, respectively. In humans, T2 of [1-13 C]pyruvate was 108.7 ± 22.6 ms in left ventricle and 129.4 ± 8.9 ms in right ventricle. T2 of [1-13 C]lactate was 40.9 ± 8.3, 44.2 ± 5.5, and 43.7 ± 9.0 ms in left ventricle, right ventricle, and myocardium, respectively. T2 of [13 C]bicarbonate in myocardium was 64.4 ± 2.5 ms. The measurements were reproducible and consistent over time after the pyruvate injection.

Conclusion: The proposed metabolite-selective multi-echo spiral imaging sequence reliably measures in vivo cardiac T2 s of HP [1-13 C]pyruvate and products.

Keywords: T2; dynamic nuclear polarization; heart; hyperpolarized pyruvate; multi-echo spiral imaging.


Figures

Figure 1.
Figure 1.. Metabolite-interleaved 13C multi-echo spiral imaging sequence.
[13C]Bicarbonate, [1-13C]lactate and [1-13C]pyruvate are sequentially excited using a spectral-spatial RF pulse and imaged with multiple single-shot spiral readouts.
Figure 2.
Figure 2.. Spectral-spatial RF pulse and profiles.
(A) Spectral-spatial RF pulse and slice-selective gradient waveforms used for bicarbonate, lactate, and pyruvate excitation, and (B) the simulated (top left) and tested (bottom left) excitation profile. The simulated spectral profile at the center of the slice (horizontal dotted white line in the top left figure) in log scale is shown at the top right, and the simulated slice profile at the center of the passing band (vertical dotted white line in the top left figure) is shown at the bottom right.
Figure 3.
Figure 3.. Phantom evaluation.
(A) Performance evaluation of the pulse sequence using a [13C]bicarbonate phantom. The T2* from the MESI sequence (B) was compared to that from the Lorentzian fit of 13C spectrum (C).
Figure 4.
Figure 4.. Hyperpolarized 13C imaging from a representative rat.
An axial slice that includes the heart was prescribed for both 1H and 13C MRI. (A) T2-weighted image and (B) Δf0 map were acquired in 1H. (C) Multi-echo images (10 echoes) of [1-13C]pyruvate, [1-13C]lactate and [13C]bicarbonate were acquired every 5 s after an injection of HP [1-13C]pyruvate, and combined at each timepoint.
Figure 5.
Figure 5.. In vivo cardiac T2* measurement from the representative rat.
(A) The first six echo images of [1-13C]pyruvate, [1-13C]lactate and [13C]bicarbonate at 20 s. (B) Signal decay of HP 13C metabolites in the ROI (black squares in (C)) along echo time. (C) T2*s of HP signals at different timepoints. The reference lines denote mean ± standard deviation.
Figure 6.
Figure 6.. Reproducibility of T2* measurements in rats.
T2*s of the HP 13C-metabolites measured from two consecutive HP [1-13C]pyruvate injections were consistent (p > 0.05). Each marker represents a T2* measurement from a single timepoint and the error bars denote the mean ± standard deviation.
Figure 7.
Figure 7.. Hyperpolarized 13C imaging from a healthy human subject.
(A) The prescribed SA plane for 13C imaging (shown in 1H MRI). (B) Δf0 map of the corresponding slice. (C) Dynamic 13C images (combination of 6 echoes) of HP [1-13C]pyruvate, [1-13C]lactate and [13C]bicarbonate, acquired after an injection of HP [1-13C]pyruvate.
Figure 8.
Figure 8.. In vivo cardiac T2* measurement from the representative human subject.
(A) Multiple echo images of HP [1-13C]pyruvate, [1-13C]lactate and [13C]bicarbonate at 25 s post-injection. (B) Signal decays of HP signals in LV, RV, and Myo (ROIs are depicted as red contours in Fig. 7 (A)) along the echo time. (C) Dynamic changes of the T2*s in the ROIs. The reference lines denote mean ± standard deviation.

Similar articles

Cited by

References

    1. Golman K, Petersson JS, Magnusson P, et al. Cardiac metabolism measured noninvasively by hyperpolarized 13C MRI. Magn Reson Med. 2008;59:1005–1013. - PubMed
    1. Le Page LM, Rider OJ, Lewis AJ, et al. Increasing pyruvate dehydrogenase flux as a treatment for diabetic cardiomyopathy: a combined 13C hyperpolarized magnetic resonance and echocardiography study. Diabetes. 2015;64:2735–2743. - PMC - PubMed
    1. Agger P, Hyldebrandt JA, Hansen ESS, et al. Magnetic resonance hyperpolarization imaging detects early myocardial dysfunction in a porcine model of right ventricular heart failure. Eur Heart J Cardiovasc Imaging. 2020;21:93–101. - PMC - PubMed
    1. Schroeder MA, Lau AZ, Chen AP, et al. Hyperpolarized 13C magnetic resonance reveals early- and late-onset changes to in vivo pyruvate metabolism in the failing heart. Eur J Heart Fail. 2013;15:130–140. - PMC - PubMed
    1. Cunningham CH, Lau JYC, Chen AP, et al. Hyperpolarized 13C metabolic MRI of the human heart: initial experience. Circ Res. 2016;119:1177–1182. - PMC - PubMed

Publication types