

CASB: a concanavalin A-based sample barcoding strategy for single-cell sequencing
- PMID: 33821571
- PMCID: PMC8022202
- DOI: 10.15252/msb.202010060
CASB: a concanavalin A-based sample barcoding strategy for single-cell sequencing
Abstract
Sample multiplexing facilitates single-cell sequencing by reducing costs, revealing subtle difference between similar samples, and identifying artifacts such as cell doublets. However, universal and cost-effective strategies are rather limited. Here, we reported a concanavalin A-based sample barcoding strategy (CASB), which could be followed by both single-cell mRNA and ATAC (assay for transposase-accessible chromatin) sequencing techniques. The method involves minimal sample processing, thereby preserving intact transcriptomic or epigenomic patterns. We demonstrated its high labeling efficiency, high accuracy in assigning cells/nuclei to samples regardless of cell type and genetic background, and high sensitivity in detecting doublets by three applications: 1) CASB followed by scRNA-seq to track the transcriptomic dynamics of a cancer cell line perturbed by multiple drugs, which revealed compound-specific heterogeneous response; 2) CASB together with both snATAC-seq and scRNA-seq to illustrate the IFN-γ-mediated dynamic changes on epigenome and transcriptome profile, which identified the transcription factor underlying heterogeneous IFN-γ response; and 3) combinatorial indexing by CASB, which demonstrated its high scalability.
Keywords: CASB; combinatorial sample indexing; sample multiplexing; single-cell RNA sequencing; single-nucleus ATAC sequencing.
© 2021 The Authors. Published under the terms of the CC BY 4.0 license.
Conflict of interest statement
The authors declare that they have no conflict of interest.
Figures

An illustration of CASB. Biotinylated ssDNA was immobilized on glycoprotein on cell/nuclear membrane through streptavidin and biotinylated ConA. The ssDNA contains 5′ and 3′ PCR handles that flank an 8 nt random sequence.
mESC were labeled with different quantity of CASB, and the number of ssDNA molecules immobilized on mESC was quantified used qPCR. The amount of ssDNA immobilized on cells increased with the increased usage of ConA‐streptavidin‐ssDNA complex and reach as many as 50,000 molecules per cell. Three independent biological replicates were performed. Error bars represent SD.
CASB‐labeled mCherry+ MEF cells were incubated with unlabeled GFP+ MEF cells. The number of ssDNA molecules immobilized on mCherry+ and GFP+ cells was quantified used qPCR after FACS separation. The ssDNA immobilized on mCherry+ cells was not detectable from GFP+ cells. “n” means number of qPCR reactions. Error bars represent SD.

- A
The number of ssDNA molecules immobilized on mESC nuclei was quantified used qPCR. The amount of ssDNA immobilized on nuclei increased with the increased usage of ConA‐streptavidin‐ssDNA complex and reached at least 120,000 molecules per nucleus. Three independent biological replicates were performed. Error bars represent SD.
- B, C
Image and flow cytometry analysis of cell and nucleus with or without CASB labeling. Both results demonstrated that ConA‐streptavidin‐ssDNA complex did not induce cell or nucleus aggregation. White circles highlight nuclear aggregates.

- A
An illustration of CASB used in scRNA‐seq. A biotinylated barcoding ssDNA with a 5′ PCR handle followed by an 8 nt barcode and a 30 nt poly‐A tail was used to mimic the endogenous transcripts.
- B
The design of the experiment. MDA‐MB‐231 cells were perturbed with 5 different compounds, collected at 3 different time points, CASB‐labeled, and then pooled with 3 other breast cancer cell lines and MEF cells.
- C
Scatter plot depicting the number of UMIs associated with transcripts from human or mouse genome. Cell doublets revealed by CASB were marked in black. Out of 110 mouse‐human doublets, 107 were detected as doublets by CASB barcodes. Three interspecies cell doublets that were not detected by CASB were circled in red. Beside interspecies cell doublets, cell doublets from one species were also detected by CASB.
- D
Transcriptome‐based UMAP of cells captured in scRNA‐seq. Cells were colored according to the CASB barcodes, and doublets were excluded. Different human and mouse cells formed 5 distinct cell clusters, respectively.
- E, F
Transcriptome‐based UMAP of untreated and (E) OSI‐027‐, (F) Niraparib‐ and Rucaparib‐treated MDA‐MB‐231 cells. Three cell populations with distinct transcriptomic responses were observed in each UMAP: Sensitive cell subpopulation was circled in red, while insensitive ones in green and blue, respectively.
- G
Transcriptome‐based UMAP of untreated and OSI‐027‐treated MDA‐MB‐231 cells. Sensitive cell subpopulation was circled in red, while insensitive ones in green and blue, respectively. Relative expression level of VIM, SQSTM1, NPM1, and RACK1 is indicated by color code, which was expressed in untreated insensitive cell populations and induced by OSI‐027 in sensitive cells.

The poly‐A ssDNA molecules immobilized on MEF was detected using RT–qPCR. Both poly‐A ssDNA and ActB transcripts can be efficiently capture by RT primer. As expected, barcoding ssDNA can be detected by qPCR even without RT reaction. Three independent biological replicates were performed. Error bars represent SD.
Heatmap showing the detected relative levels of each CASB barcode in individual cells in scRNA‐seq. A total of 12068 cells with sufficient reads were captured; 3,962 cells that contained at least two major barcodes were assigned as cell doublets; 483 cells were assigned as “unlabeled”, as expected due to the inclusion of unlabeled MDA‐MB‐231 cells.
Boxplot demonstrating the number of UMI derived from both CASB barcode and mRNA transcripts in cell doublets (n = 3,962) and singlets (n = 7,623). Comparing with singlets, more UMI derived from both CASB barcode and mRNA transcripts were detected in doublets. The central band represents the median; the lower and upper hinges of the boxplot correspond to the first and third quartiles, respectively.
Scatterplot illustrating a positive correlation between the number of detected UMI from CASB and endogenous transcripts among individual cells. “R” means Pearson's correlation coefficient. R function “cor.test” was used to obtain the P‐value.
Distribution of normalized CABS UMI counts of singlets and individual cell samples. The CASB barcoding manifested a good uniformity of labeling efficiency (5–95 percentile: 2.1–21.8%) (upper panel); comparing with human cell samples, MEF cells had slightly lower labeling efficiency (lower panel).
Transcriptome‐based UMAP comparing labeled and unlabeled untreated MDA‐MB‐231 cells, in which two cell populations were intermingled.
Scatterplot demonstrating the well‐correlated gene expression profiles between labeled and unlabeled untreated MDA‐MB‐231 cells. “R” means Pearson's correlation coefficient.
t‐SNE projection based on the CASB barcode reads captured in scRNA‐seq. Cells were colored according to the CASB barcodes, and doublets were marked in black. All 20 sample barcodes can be detected.
Transcriptome‐based UMAP of all MDA‐MB‐231 cells captured in scRNA‐seq. Untreated and 24‐h treated cells were highlighted. Cells associated with 24 h‐treatment of Niraparib, Rucaparib, and OSI‐027 could be well distinguished from untreated cells, whereas those with LCL161 and Fludarabine could not.

- A, B
Transcriptome‐based UMAP of untreated and OSI‐027‐treated MDA‐MB‐231 cells. Cells were unsupervised clustered and colored into three distinct groups according to the transcriptomic feature revealed by Louvain algorithm (A). UMI count of individual cells was indicated, and no significant difference in UMI distribution was observed between the three clusters as well as between treated and untreated samples (B).
- C
Neighbor proportion analysis of untreated and OSI‐027‐treated MDA‐MB‐231 cells. In cluster 0, untreated cells were distant from treated cells, while, in cluster 1 and 2, untreated cells were 50% neighbored with treated cells.
- D
Transcriptome‐based UMAP of untreated MDA‐MB‐231 cells. Cells were unsupervised clustered into three distinct groups with Louvain method.
- E
Transcriptome‐based UMAP of untreated and Niraparib‐ and Rucaparib‐treated MDA‐MB‐231 cells. Cells were unsupervised clustered into three distinct groups with Louvain method.
- F
Function enrichment analysis of genes that were regulated by OSI‐027, Niraparib, and Rucaparib. All three compounds induced expression changes of genes that are enriched in cell death and survival pathway. P‐values were calculated using Fisher's exact test.
- G, H
Function enrichment analysis of genes that were commonly up‐ or downregulated in insensitive cell populations. (G) These genes were highly enriched in the cellular compromise and movement pathways. P‐value was calculated using Fisher's exact test. (H) Genes that were upregulated in insensitive cell populations and predicted to promote cell movement, including VIM, SQSTM1, NPM1, and RACK1.


An illustration of CASB used in snATAC‐seq. A biotinylated barcoding ssDNA with S5‐ME and S7‐ME adapter sequences flanking a sequence containing sample barcodes was used to mimic the transposed genomic DNA.
A simplified illustration of INF‐γ signaling pathway. Upon binding of INF‐γ to its receptor, JAK is activated and induces the phosphorylation of STAT. Phosphorylated STAT is then translocated into the nucleus and activates the expression of different sets of target genes by itself or in combination with other transcription factors.
t‐SNE projection based on the CASB barcode reads captured in snATAC‐seq. Cells were colored according to the CASB barcodes, and doublets were marked in black.
ATAC‐based UMAP of all HAP1 cells captured in snATAC‐seq. Cells were colored according to the CASB barcodes, and doublets were excluded. HAP1 cells showed a continuous shift in chromatin profile from 0 to 12 h.
Dot plot revealing the TFs with the most variable activity across all cells including IRF, STAT and NF‐κB.
ATAC‐based UMAP of all HAP1 cells, in which the TF activity was presented by bias‐corrected deviation z‐score across all cells in color code.
Violin plots demonstrating the deviation z‐score of different TFs across different cells at different time points. Each dot represents a cell. While IRF and STAT activity showed continuous upregulation upon IFN‐γ stimulation, the activity of NF‐κB remained unchanged but showed high heterogeneity within HAP1 cells.

The number of ATAC‐barcode molecules immobilized on mESC nuclei was quantified used qPCR. The amount of ssDNA immobilized on nuclei increased with the increased usage of ConA‐streptavidin‐ssDNA complex and could reach at least 80,000 molecules per nucleus. Three independent biological replicates were performed. Error bars represent SD.
Histogram showing the number of CASB barcode reads assigned to individual cells in plate‐based snATAC‐seq. The cutoff was set as 20,000.
ATAC‐based UMAP comparing labeled and unlabeled HAP1 cells, in which two cell populations were intermingled.
Scatterplot demonstrating the correlated epigenomic profiles between labeled and unlabeled as well as those between cells collected in plate 1 and 2. The correlation between the labeled and unlabeled cells was similar as that between the two plates. “R” means Pearson's correlation coefficient. Each dot presents a ATAC peak.
Heatmap showing the detected relative levels of each CASB ATAC‐barcode in individual cells in snATAC‐seq. A total of 3,218 cells were obtained with sufficient reads, 305 of which were identified as cell doublets and 23 cells were unlabeled.
Number of ATAC peaks detected in individual cells from different groups. Each dot represents a cell.
ATAC‐based UMAP of MDA‐MB‐231 and HAP1 cells. Cells were colored according to the cell line specific barcodes. MDA‐MB‐231 cells with its specific CASB barcode presented as an isolated cluster.

Heatmap showing the detected relative levels of each CASB barcode in individual cells in scRNA‐seq. A total of 3,407 cells were captured, 294 of which were identified as cell doublets and 9 cells were unlabeled.
t‐SNE projection based on the CASB barcode reads captured in scRNA‐seq. Cells were colored according to the CASB barcodes, and doublets were marked in black.
Transcriptome‐based UMAP of HAP1 cells, in which the relative expression of CXCL11 was presented with color code. At later time points, CXCL11 were only actively induced in cluster 2 (circled in red).
Gene tracks demonstrate the cumulative ATAC signal around CXCL10 and 11 genes in two cell clusters with different NF‐kB activity at different time points. Detected ATAC peaks were highlighted by red boxes. Comparing with cells with high NF‐kB activity, cells with low NF‐kB activity showed limited changes on chromatin accessibility upon INF‐γ stimulation.
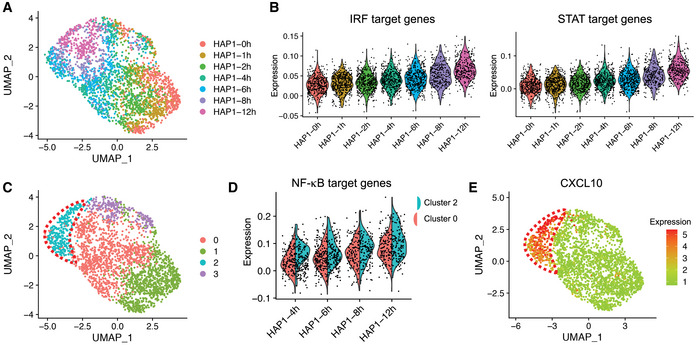
Transcriptome‐based UMAP of HAP1 cells captured in scRNA‐seq, in which cells were colored according to the CASB barcodes. HAP1 cells showed globally a continuous shift from 0 to 12 h.
Violin plots demonstrating the continuous transcriptional activation of predicted IRF and STAT target genes across different time points. Each dot represents a cell, and Y‐axis represents the average relative expression level of TF target genes.
Transcriptome‐based UMAP of HAP1, in which cells were unsupervised clustered and colored according to the transcriptomic feature revealed by Louvain algorithm. Cells were clustered into two populations at 4–12 h, one of which exhibited more divergent transcriptome profile from earlier time points and was highlighted with red dashed line.
Violin plots comparing the expression of predicted NF‐κB target genes between cluster 0 and 2 at 4–12 h. Each dot represents a cell, and Y‐axis represents the average relative expression level of NF‐κB target genes. Predicted target genes were heterogeneously expressed and more actively induced in cluster 2.
Transcriptome‐based UMAP of HAP1 cells, in which the relative expression of CXCL10 were presented with color code and showed activation only in cluster 2 (circled in red) at later time points.

- A
An illustration of the combinatorial indexing experiment. A four‐by‐four combinatorial barcoding strategy was used to index 16 different cell lines, which was followed by one round of four‐group split‐pool barcoding. The same number of unlabeled cells from the 16 cell lines was also added into the sample pool.
- B–E
Transcriptome‐based UMAP of 16 different cell lines, in which cells were unsupervised clustered. (B) Cell doublets were highlighted in red. (C‐E) 12 CASB barcodes were indicated with different colors. Eight barcodes used in four‐by‐four combinatorial labeling were exclusively distributed in distinct cell clusters (C and D), while the four barcodes used in split‐pool labeling distributed evenly among different cell clusters (E).
- F
Cells were colored according to the transcriptomic feature revealed by Louvain algorithm.
- G
Cells were colored according to CASB barcode combinations, which successfully helped assigning cell types into distinct cell clusters.
- H
Labeled and unlabeled cells were marked in red and blue, respectively. They were intermingled within different cell clusters.
- A
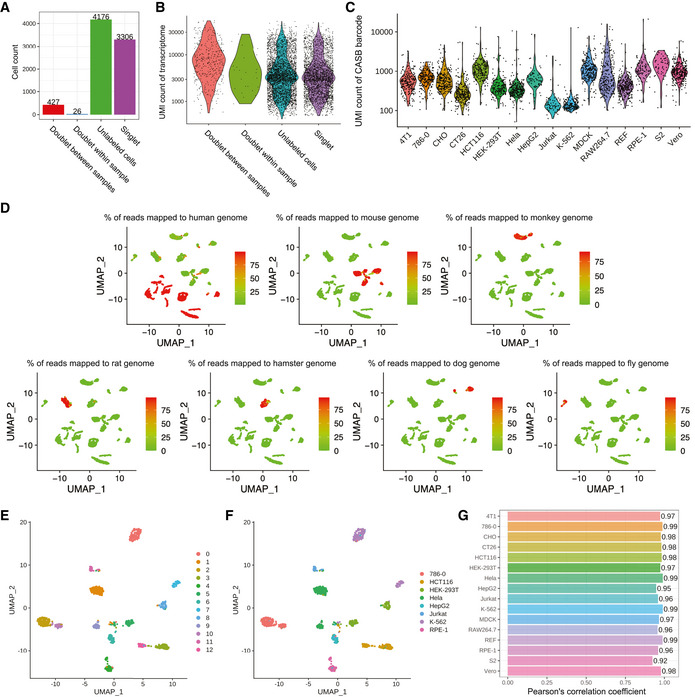
Number of cells assigned into different groups.
- B
Transcriptome UMI count of cells in different groups. Cells assigned as “Doublet” showed relatively higher UMI count. Each dot represents a cell.
- C
UMI count of CASB barcodes in different cell types. Each dot represents a cell. All 16 cell lines were labeled with sufficient amount of total CASB barcode. The median UMI count of CASB barcode across 16 cell lines ranged from 133 (K‐562) to 1,545 (S2), while the variation within individual cell lines ranged from 2.4‐fold (K‐562) to 19.4‐fold (RAW264.7) (5–95 percentile).
- D
Transcriptome‐based UMAP of all cell singlets, in which cells were unsupervised clustered. Cells were colored based on the percentage of reads mapped to indicated genome.
- E, F
Transcriptome‐based UMAP of eight human cell lines, in which cells were unsupervised clustered. Cells were colored according to the transcriptomic feature revealed by Louvain algorithm (E) and CASB barcode combinations (F).
- G
Pearson's correlation coefficient was calculated for cumulative gene expression profiles between labeled and unlabeled cells of different cell types, showing a negligible influence of CASB labeling on transcriptome profile.
References
Publication types
MeSH terms
Substances
LinkOut - more resources
Full Text Sources
Other Literature Sources
Molecular Biology Databases
