. 2021 Jun 22;143(25):2454-2470.
doi: 10.1161/CIRCULATIONAHA.119.043724. Epub 2021 Apr 6.

Systems Approach to Discovery of Therapeutic Targets for Vein Graft Disease: PPARα Pivotally Regulates Metabolism, Activation, and Heterogeneity of Macrophages and Lesion Development

Affiliations

Systems Approach to Discovery of Therapeutic Targets for Vein Graft Disease: PPARα Pivotally Regulates Metabolism, Activation, and Heterogeneity of Macrophages and Lesion Development

Julius L Decano et al. Circulation. .

Abstract

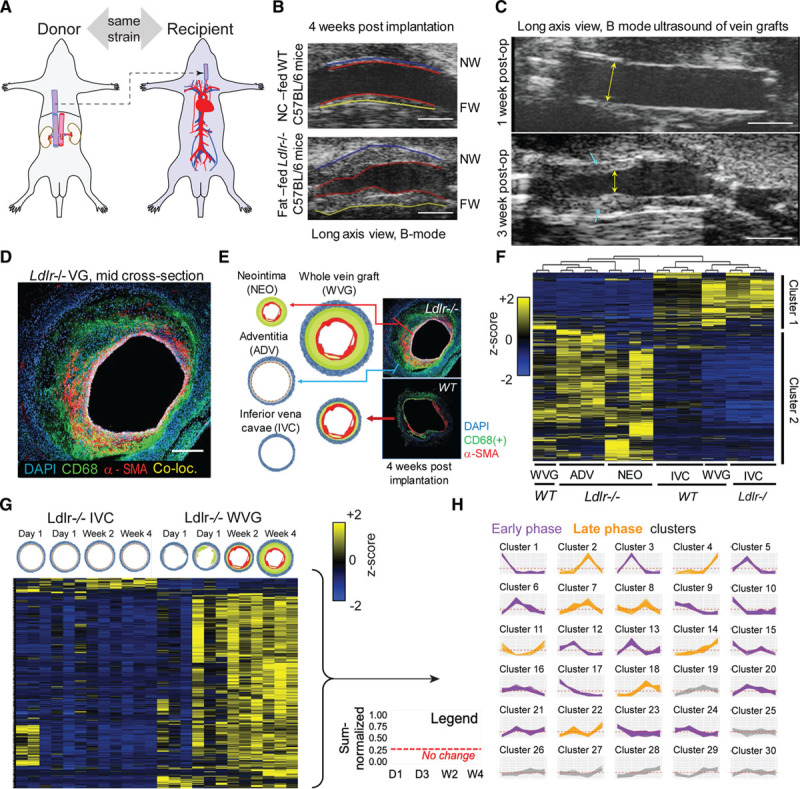
Background: Vein graft failure remains a common clinical challenge. We applied a systems approach in mouse experiments to discover therapeutic targets for vein graft failure.

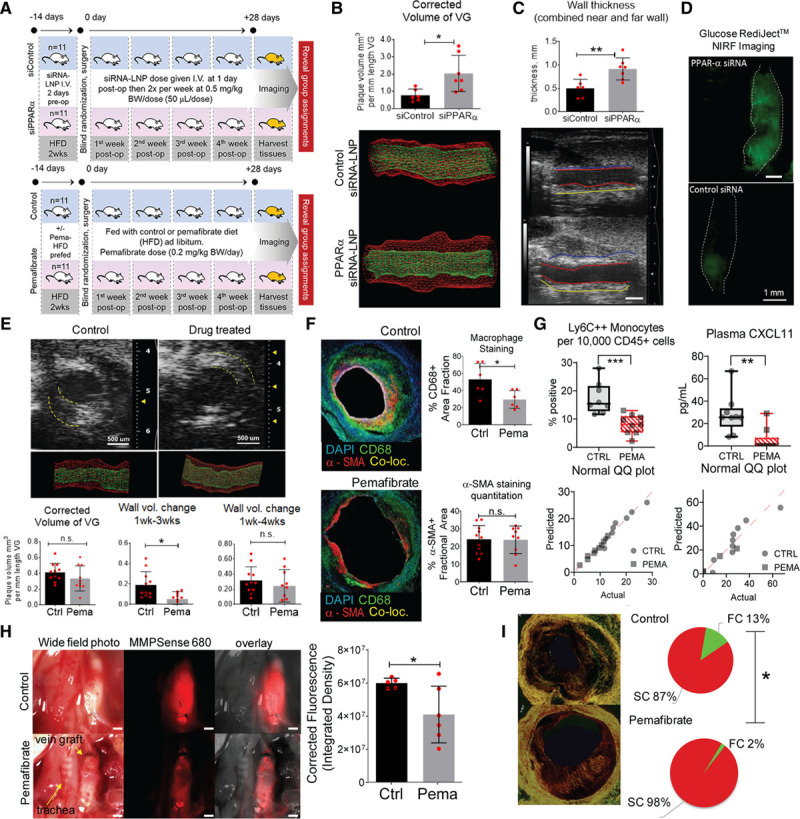
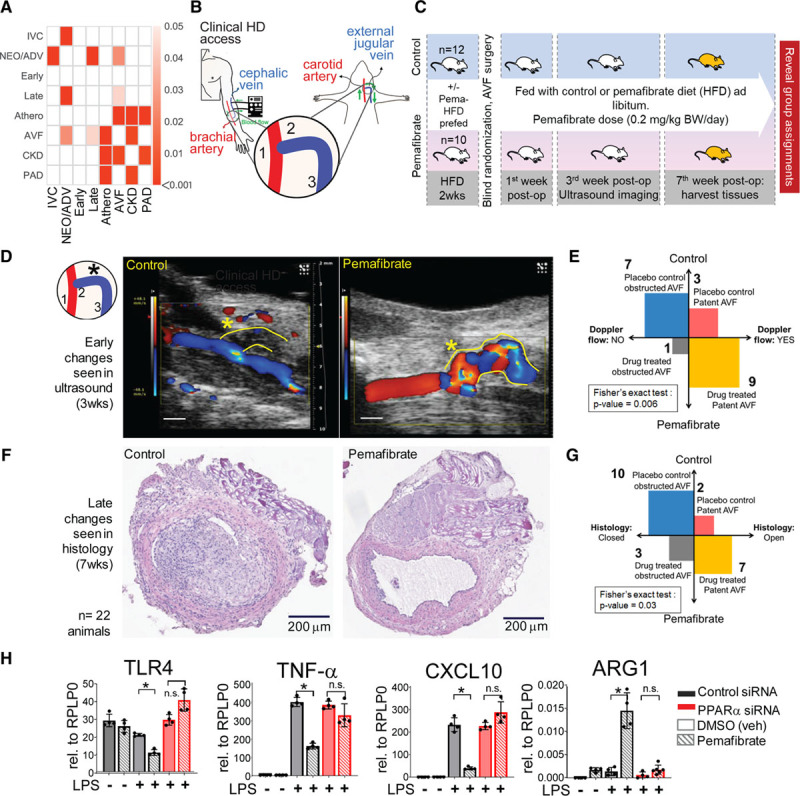
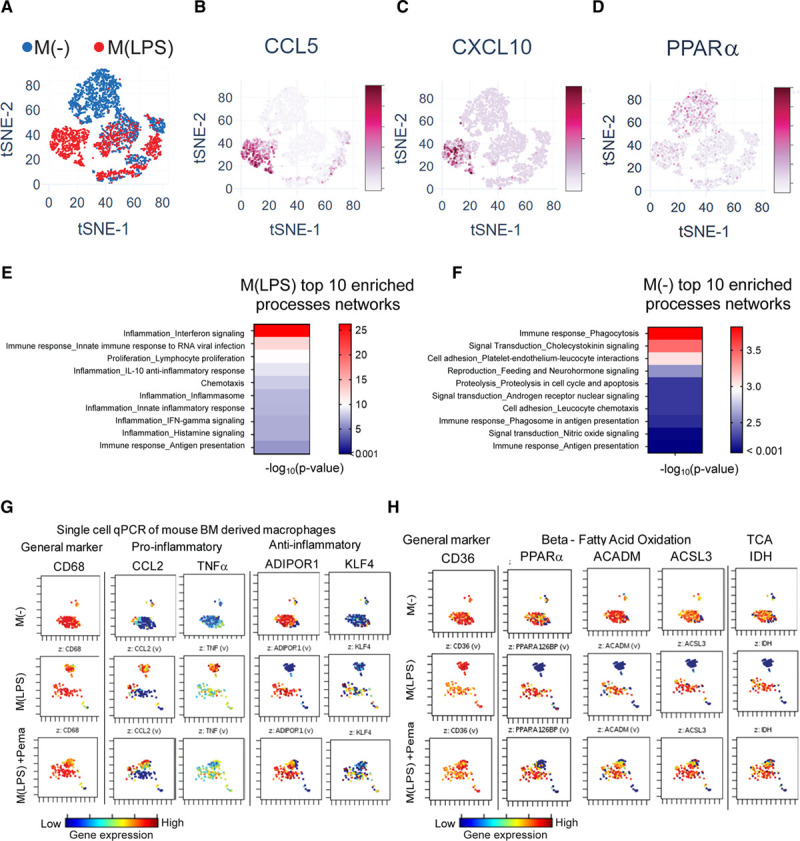
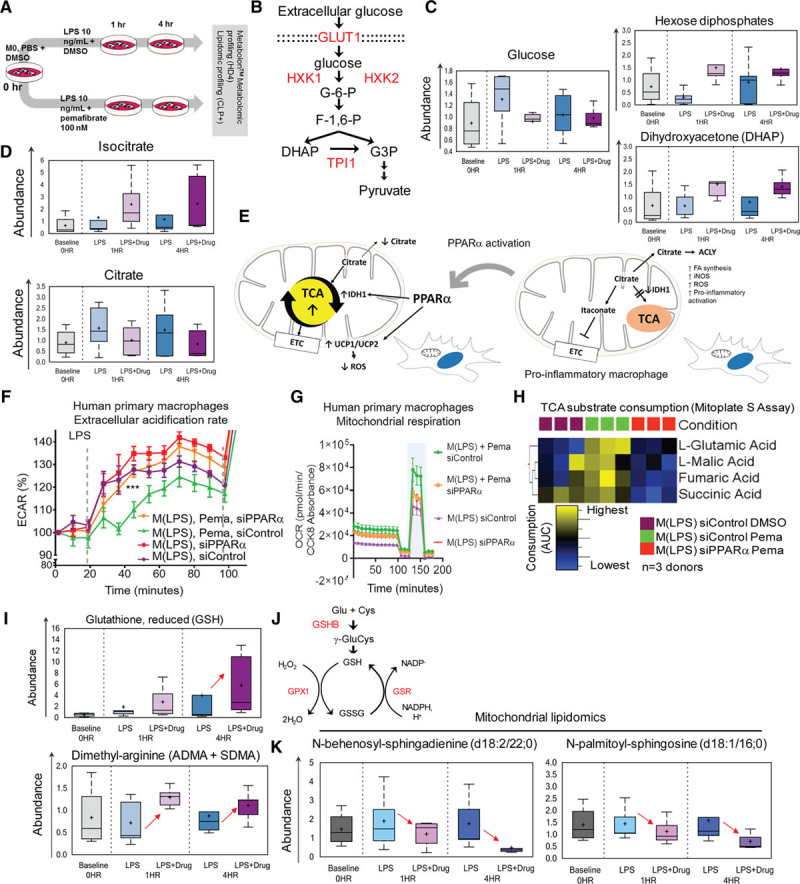
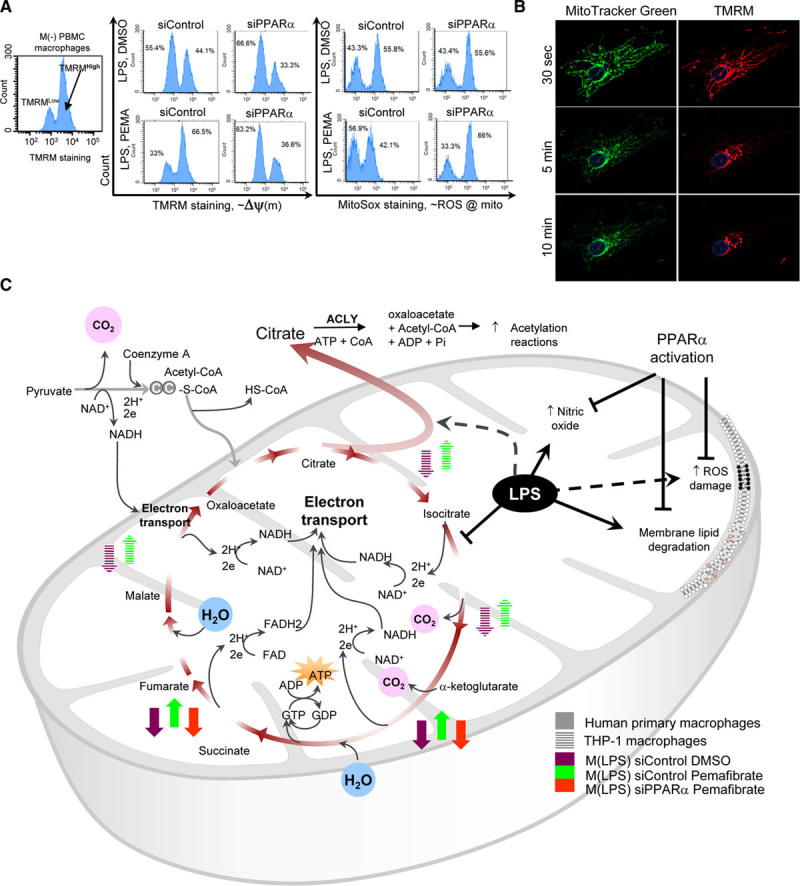
Methods: Global proteomics and high-dimensional clustering on multiple vein graft tissues were used to identify potential pathogenic mechanisms. The PPARs (peroxisome proliferator-activated receptors) pathway served as an example to substantiate our discovery platform. In vivo mouse experiments with macrophage-targeted PPARα small interfering RNA, or the novel, selective activator pemafibrate demonstrate the role of PPARα in the development and inflammation of vein graft lesions. In vitro experiments further included metabolomic profiling, quantitative polymerase chain reaction, flow cytometry, metabolic assays, and single-cell RNA sequencing on primary human and mouse macrophages.

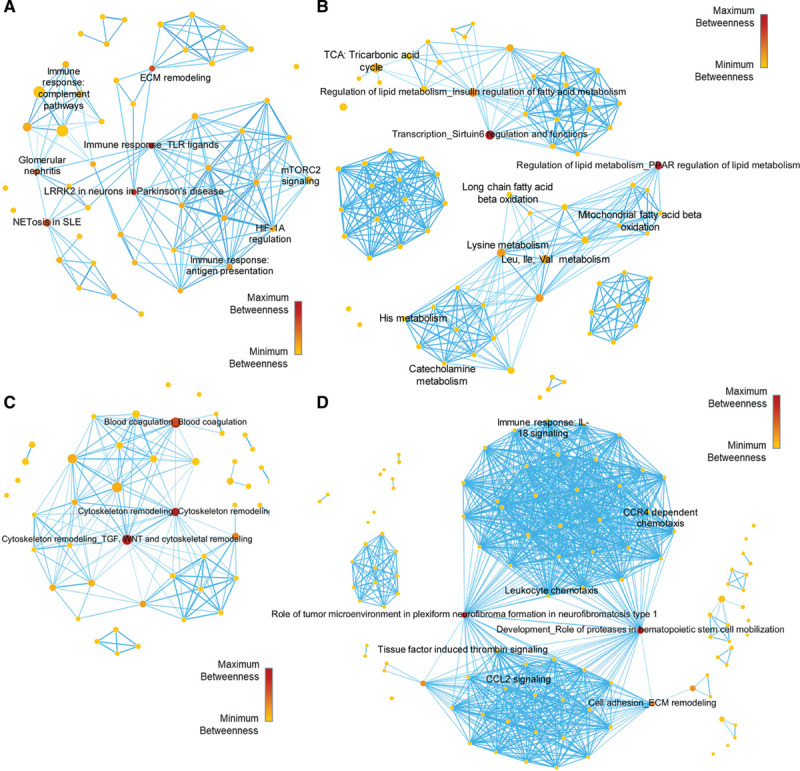
Results: We identified changes in the vein graft proteome associated with immune responses, lipid metabolism regulated by the PPARs, fatty acid metabolism, matrix remodeling, and hematopoietic cell mobilization. PPARα agonism by pemafibrate retarded the development and inflammation of vein graft lesions in mice, whereas gene silencing worsened plaque formation. Pemafibrate also suppressed arteriovenous fistula lesion development. Metabolomics/lipidomics, functional metabolic assays, and single-cell analysis of cultured human macrophages revealed that PPARα modulates macrophage glycolysis, citrate metabolism, mitochondrial membrane sphingolipid metabolism, and heterogeneity.

Conclusions: This study explored potential drivers of vein graft inflammation and identified PPARα as a novel potential pharmacological treatment for this unmet medical need.

Keywords: arteriovenous; fistula; inflammation; macrophage; pemafibrate; proteomics; systems biology; vein graft.


Figures

Figure 1.
Figure 1.
Vein graft target discovery. A, Mouse model: donor’s suprahepatic inferior vena cava (IVC) transplanted into the recipient’s left midcommon carotid artery. B, Normal chow (NC)–fed wild-type (WT) C57BL6 12-week-old male mice and fat-fed (2 weeks prefed) low-density lipoprotein receptor (Ldlr−/−) 12-week-old male mice (C57BL6 background) vein grafts in ultrasound imaging (long-axis view) at week 4 after operation. (n=6 versus n=6). Near wall (ventral) = NW, far wall (dorsal) = FW. Scale =1 mm. C, Long axis view (scale bar 1 mm) of a representative vein graft (VG) lesion showing an increase of lesion size (blue arrowheads) from 1 week to 3 weeks after operation. Luminal stenosis evident at 3 weeks (yellow arrows) D, Immunofluorescence of vein graft at 4 weeks after operation using AF488-anti-CD68 (macrophages, green color), Cy3-α-smooth muscle actin, SMA (vascular smooth muscle cells, VSMCs, red color), and DAPI (4′,6-diamidino-2-phenylindole, nucleus, blue color). Co-loc. indicates co-localization. Scale=100 µm. E, VG tissue layer dissection of neointimal (NEO) and adventitial (ADV) layers of Ldlr−/− VG samples. WT VG samples were not microdissected. IVC was used as controls. Representative immunofluorescence staining of Ldlr−/− versus WT VG tissue (n=2 biological replicates, n=2 technical replicates). F, Tissue layer proteomics (n=2 mice, 2 technical replicates per tissue) by multigroup comparison, false discovery rate ≤0.05. Proteins that are relatively increased in IVC samples and VG of 1 WT animal are also relatively decreased in Ldlr−/− VG tissues in both NEO and ADV layers and in 1 VG of another WT animal, and vice versa. G, Time course proteomics of Ldlr−/− VGs: 1 day (D1), 3 days (D3), 14 days (W2), and 28 days (W4) after VG surgery (n=12 VG donors, 3 biological replicates per time point). Vein grafts were processed as a whole (no layer dissection) and paired with matching IVC controls from the same animals. H, Multiplexed analysis of proteome across time points showing “coabundance” proteins in time (see Expanded Methods in the Data Supplement).
Figure 2.
Figure 2.
Pathways network of static proteomics. A, Low-density lipoprotein receptor (Ldlr−/−) vein graft (VG) neointimal (NEO)/adventitial (ADV) predominant proteins pathways enrichment network. B, Inferior vena cava (IVC) and wild-type (WT) VG predominant proteins pathways enrichment network. C, Ldlr−/− VG early phase predominant proteins pathways enrichment network. D, Ldlr−/− VG late phase predominant proteins pathways enrichment network. Node sizes are proportional to the number of dataset proteins present in that pathway node. Node color and scale bar depict the level of betweenness centrality for that pathway node.
Figure 3.
Figure 3.
In vivo PPARα loss-of-function and gain-of-function studies. A, Study design. Upper, Loss-of-function. Twenty-two low-density lipoprotein receptor (Ldlr−/−) male mice used, aged 12 weeks, prefed with high-fat diet 2 weeks before operation. Randomization in 2 treatment groups: (1) set 1: siRNA control conjugated to C12-200 lipid nanoparticles (LNP); (2) set 2: siRNA PPARα (small interfering RNA or siRNA of PPAR alpha, 1:1 mixture of oligonucleotide 1 and 2 conjugated to C12-200 LNP. A 0.5 mg siRNA-LNP/kg body weight (BW)/dose given intravenously 11 times throughout the study. Dosage schedule: 2 days before operation, right after surgery, then 2 times per week (every 3 days) after surgery for 4 weeks with 1 extra dose 2 to 3 days after day 28. Lower, Pemafibrate (PPARα gain-of-function) study (n=11 versus n=11). B, Three-dimensional ultrasound rendered wall volume comparison of siControl (siControl= non-specific small interfering RNA, siRNA), and siRNA PPARα silenced group at 4 weeks after surgery. C, Vessel wall thickness, long-axis view. siRNA PPARα group had thicker vessel walls than siRNA control group (n=11 versus n=11). Scale=1 mm. D, Glucose uptake by RediJect assay (Perkin Elmer) and intravital fluorescence in the VG. Representative image. E, Gain-of-function study using the highly selective PPARα activator pemafibrate (drug) (n=11 versus n=11, control versus drug-treated) resulted in lesser neointimal plaque up to 3 weeks after surgery. F, Immunofluorescence histology of the midgraft transverse sections using CD68 (green) and α-SMA (red) antibodies (blue=DAPI [4′,6-diamidino-2-phenylindole], nuclear stain). Pemafibrate-treated group had less macrophage accumulation at the lesion than control group. There was no difference in vascular smooth muscle cell content. G, Fluorescence-activated cell sorting analysis showing pemafibrate decreased circulating Ly6C++ monocytes. ELISA of blood plasma shows pemafibrate decreases plasma recruitment chemokine CXCL11 levels. Corresponding normality tests. H, In situ transmitted light and intravital near-infrared fluorescence (NIRF) imaging of vein grafts 12 hours after MMPSense 680 intravenous injection. Red fluorescence indicates intensity of proteases MMP-2, 3, 9, and 13 (activity and relative abundance). I, Picrosirius red staining (PSR) of 4-week vein grafts midcross-section with quantification of red and green birefringence of collagen fibrils. *P<0.05; **P<0.01; ***P<0.001; n.s., P≥0.05. Co-loc indicates colocalization; Ctrl, control; FC, fragmented collagen; HFD, high-fat diet; LNP, lipid nanoparticle; Pema, pemafibrate; post-op, after operation; PPARα, peroxisome proliferator-activated receptor α; QQ or Q-Q, quantile-quantile; SC, stable collagen; siRNA, small interfering RNA; SMA, smooth muscle actin; and VG, vein graft.
Figure 4.
Figure 4.
Experimental AVF failure (disease) and PPARα gain-of-function study. A, Heatmap of associations between modules of proteomics and diseases of interest, measured in terms of network closeness. Empirical P values are calculated by 1000 randomizations and corrected for multiple testing by the Benjamini-Hochberg procedure. Darker shades indicate a higher significance, whereas insignificant associations (empirical P value >0.05) are indicated as blank cells. B, Human AVF access model using low-density lipoprotein receptor (Ldlr−/−) mice with side-to-end anastomosis of the left external jugular vein (EJV, blue, 2, 3) to the midportion of the left common carotid artery (CCA, red, 1). C, In vivo study design with randomization in 2 treatment groups: (1) animals are prefed with HFD only or (2) HFD + pemafibrate ≈ dose of 0.2 mg/kg BW/d, at 2 weeks before surgery and continued to 7 weeks after surgery. Color Doppler ultrasound (Vevo 2100) of AVF at 3 weeks after surgery. At 7 weeks after surgery, AVFs were harvested for histology. D and E, Color Doppler shows better patency (*) and blood flow through AVFs of the pemafibrate-treated group. If there was color Doppler signal in the a-EJV (anastomosis-connected external jugular vein), we called it as “open” or “patent” because of high-velocity turbulent flow of blood as detected by the color Doppler. If there was no color Doppler signal, we called this as “nonpatent” or “closed.” VevoLab software version 1.6.0 build 6078 (Fujifilm) was used in the assessment. F and G, Late change in histology (hematoxylin and eosin [H&E] staining) shows the pemafibrate-treated group had less neointima as measured in the mid CSA portion of the proximal (to the anastomosis) third of the venous limb of the AVF. H, Bulk quantitative polymerase chain reaction of bone marrow–derived mouse macrophages for inflammatory markers with either gain-of-function or loss-of-function of PPARα. *P<0.05; n.s., P≥0.05. Athero indicates atherosclerosis; AVF, arteriovenous fistula; BW, body weight; CKD, chronic kidney disease; Cont., control; CSA, cross-sectional area; DMSO, dimethyl sulfoxide; FDR, false discovery rate; HD, hemodialysis; HFD, high-fat diet; IVC, inferior vena cava predominant proteins; LPS, lipopolysaccharide; NEO/ADV, combined neointimal and adventitial layer predominant proteins; PAD, peripheral artery disease; Pema., pemafibrate; post-op, after operation; PPARα, peroxisome proliferator-activated receptor α; siRNA, small interfering RNA; and veh, vehicle.
Figure 5.
Figure 5.
In vitro validation: single-cell mRNA expression in primary macrophages. A, tSNE of single-cell RNA sequencing data of M(–) and M(LPS) primary human macrophages (2557 cells M(–), 1680 cells M(LPS), single donor). Gene expression projected onto tSNE plot of CCL5 (B), CXCL10 (C), and PPARα (D). E, Top 10 enriched process networks for M(LPS) cluster 1 differentially expressed genes relative to M(–) cluster 1 genes. F, Top 10 enriched process networks for M(–) cluster 1 differentially expressed genes relative to M(LPS) cluster 1 genes. G and H, Single-cell quantitative polymerase chain reaction (qPCR) of human PBMC-derived primary macrophages (from 3 donors) in 3 conditions: (1) M(–): LPS(–), DMSO; (2) M(LPS): LPS(+), DMSO; (3) Pema + M(LPS): LPS(+), pemafibrate. ACADM indicates acyl-CoA dehydrogenase, medium-chain; ACSL3, acyl-CoA synthetase long-chain family member 3; ADIPOR1, adiponectin receptor 1; BM, bone marrow; CCL2, C-C motif chemokine ligand 2; DMSO, dimethyl sulfoxide; IDH, isocitrate dehydrogenase; IFN, interferon; KLF4, Krüppel-like factor 4; LPS, lipopolysaccharide; M(–), unstimulated or baseline macrophage; M(LPS), LPS-stimulated macrophage; PBMC, peripheral blood mononuclear cell; PBS, phosphate-buffered solution; PPARα, peroxisome proliferator-activated receptor α; siRNA, small interfering RNA; TCA, tricarbonic acid cycle; and TNF, tumor necrosis factor.
Figure 6.
Figure 6.
Whole-cell metabolomics and metabolic function of PBMC-derived macrophages. A, Human PBMC-derived macrophages—metabolomic profiling study (Metabolon, see Expanded Methods in the Data Supplement). n=5 donors per time point; samples were processed for (1) whole cell lysate and (2) isolated mitochondria lysate metabolomic and lipidomic screening. B, Glycolysis pathway. PPARα transcription-regulated enzymes (red). C, Glucose, hexose diphosphates, and DHAP metabolite levels. D, Isocitrate and citrate metabolite levels E, PPARα activation may release the TCA block in M(LPS) cells. F, Silencing PPARα of M(LPS) + Pema raises ECAR to M(LPS) levels. siControl (M(LPS) + Pema) have lower ECAR and G, higher OXPHOS rate (increase in OCR) and maximal respiratory reserve (blue band). H, TCA substrate consumption as measured by Mitoplate S assay (Biolog). I, Reduced form of glutathione is relatively increased in M(LPS +Pema) at the 4-hour time point. Glutathione pathway/cycle. PPARα transcription regulated enzymes (red). J, Asymmetrical and symmetrical dimethylarginine metabolites (ADMA, SDMA, whole-cell lysate) levels. K, Ceramides: N-behenoyl-sphingadenine (d18:2/22:0) and N-palmitoyl-sphingosine (d18:1/16:0) mitochondria levels. ACLY indicates Adenosine triphosphate-Citrate Synthase; ADMA, asymmetrical dimethylarginine; AUC, area under the curge; DHAP, dihydroxyacetone phosphate; DMSO, dimethyl sulfoxide; ECAR, extracellular acidification rate; ETC, electron transport chain; FA, fatty acid; GSHB, glutathione synthetase; GSR, glutathione reductase; GSH, glutathione reduced form; GSSG, glutathione disulfide oxidized form; iNOS, inducible nitric oxide synthase; LPS, lipopolysaccharide; M0, unstimulated or baseline macrophage state or M(-); M(LPS), LPS-stimulated macrophage; NADP–, nicotinamide adenine dinucleotide phosphate; NADPH, nicotinamide adenine dinucleotide phosphate, reduced form; OCR, oxidative consumption rate; OXPHOS, oxidative phosphorylation; PBMC, peripheral blood mononuclear cell; Pema, pemafibrate 100 nmol/L; ROS, reactive oxygen species; SDMA, symmetrical dimethylarginine; siControl, control non-specific small interfering RNA; TCA, tricarboxylic acid; and UCP, uncoupling protein.
Figure 7.
Figure 7.
Effects of peroxisome proliferator-activated receptor α (PPARα) on the mitochondria. A, Baseline PBMC macrophages, M(–) with high TMRM staining indicates cells with high mitochondrial membrane potential. In M(LPS), low TMRM staining fraction increases, but pemafibrate promotes preservation of high TMRM fraction (high membrane gradient potential). Silencing PPARα abolishes this effect. Mitochondrial ROS damage ≈ high MitoSox staining (fluorescence-activated cell sorting). B, LPS-stimulated RAW264.7 cells show a decrease in mitochondrial TMRM staining, implying “leaky” membrane. Ten-minute time-lapse fluorescence C, Summary of TCA substrate consumption and mitochondrial membrane damage during LPS stimulation and how PPARα affects these changes. ACLY indicates adenosine triphosphate citrate lyase; FAD, flavin adenine dinucleotide oxidized; HS-CoA, free coenzyme A, hydrogen-sulfur; LPS, lipopolysaccharide; mito, mitochondria; M(–), unstimulated or baseline macrophage; M(LPS), LPS-stimulated macrophage; NAD, nicotinamide adenine dinucleotide oxidized form; NADH, nicotinamide adenine dinucleotide reduced form; PBMC, peripheral blood mononuclear cell; ROS, reactive oxygen species; siControl, control non-specific small interfering RNA; TCA, tricarboxylic acid; TMRM, tetramethylrhodamine methyl ester; and Δψ(m), mitochondrial membrane potential.

Comment in

References

    1. Fowkes FG, Rudan D, Rudan I, Aboyans V, Denenberg JO, McDermott MM, Norman PE, Sampson UK, Williams LJ, Mensah GA, et al. Comparison of global estimates of prevalence and risk factors for peripheral artery disease in 2000 and 2010: a systematic review and analysis. Lancet. 2013;382:1329–1340. doi: 10.1016/S0140-6736(13)61249-0 - PubMed
    1. Bonaca MP, Nault P, Giugliano RP, Keech AC, Pineda AL, Kanevsky E, Kuder J, Murphy SA, Jukema JW, Lewis BS, et al. Low-density lipoprotein cholesterol lowering with evolocumab and outcomes in patients with peripheral artery disease: insights from the FOURIER Trial (Further Cardiovascular Outcomes Research With PCSK9 Inhibition in Subjects With Elevated Risk). Circulation. 2018;137:338–350. doi: 10.1161/CIRCULATIONAHA.117.032235 - PubMed
    1. Klingelhoefer E, Bergert H, Kersting S, Ludwig S, Weiss N, Schönleben F, Grützmann R, Gäbel G. Predictive factors for better bypass patency and limb salvage after prosthetic above-knee bypass reconstruction. J Vasc Surg. 2016;64:380–388.e1. doi: 10.1016/j.jvs.2016.02.059 - PubMed
    1. Rosenfield K, Matsumura JS, Chaturvedi S, Riles T, Ansel GM, Metzger DC, Wechsler L, Jaff MR, Gray W; ACT I Investigators. Randomized trial of stent versus surgery for asymptomatic carotid stenosis. N Engl J Med. 2016;374:1011–1020. doi: 10.1056/NEJMoa1515706 - PubMed
    1. Conte MS. Bypass versus Angioplasty in Severe Ischaemia of the Leg (BASIL) and the (hoped for) dawn of evidence-based treatment for advanced limb ischemia. J Vasc Surg. 2010;51(5 suppl):69S–75S. doi: 10.1016/j.jvs.2010.02.001 - PubMed

Publication types