Comparative Study
. 2021 Apr 6:10:e66128.
doi: 10.7554/eLife.66128.

High social status males experience accelerated epigenetic aging in wild baboons

Affiliations
Comparative Study

High social status males experience accelerated epigenetic aging in wild baboons

Jordan A Anderson et al. Elife. .

Abstract

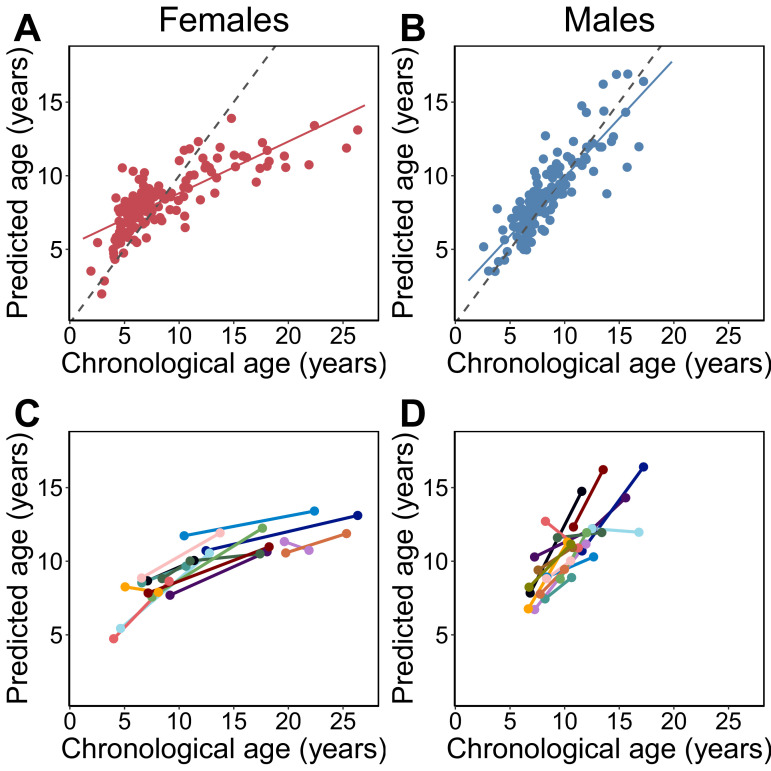
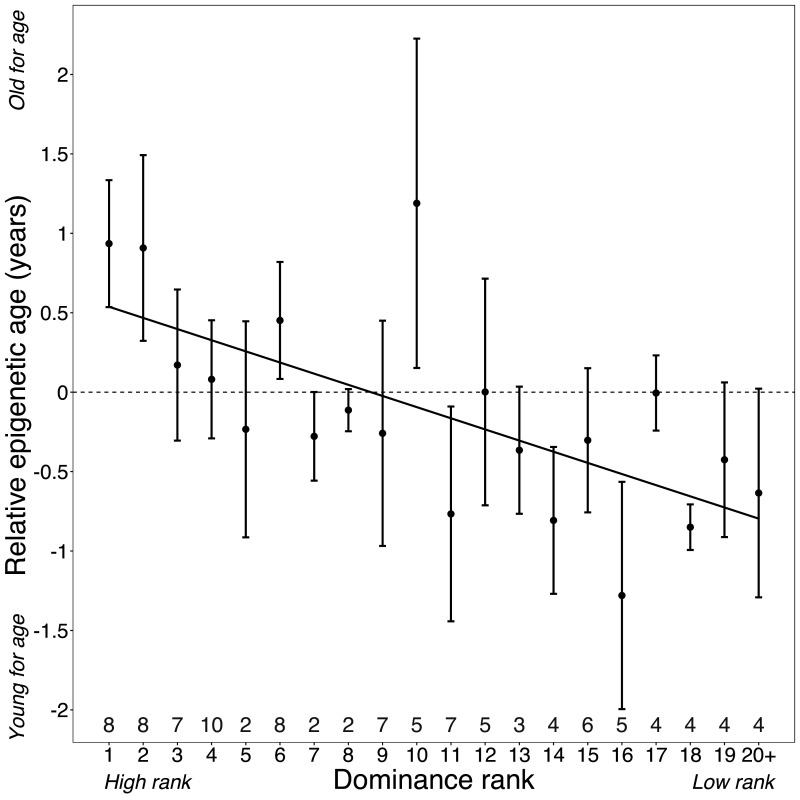
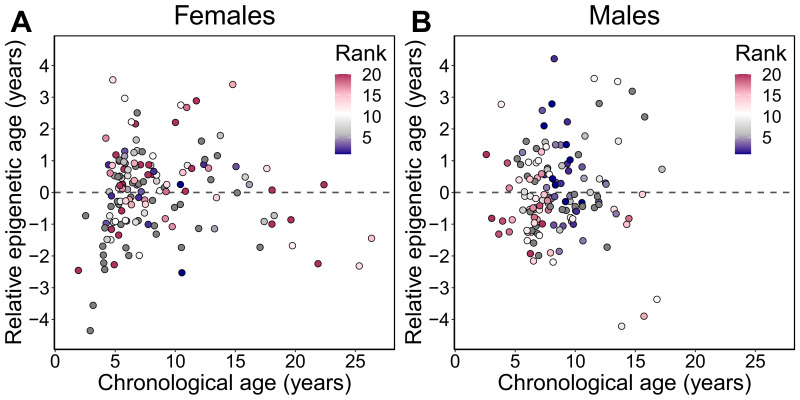
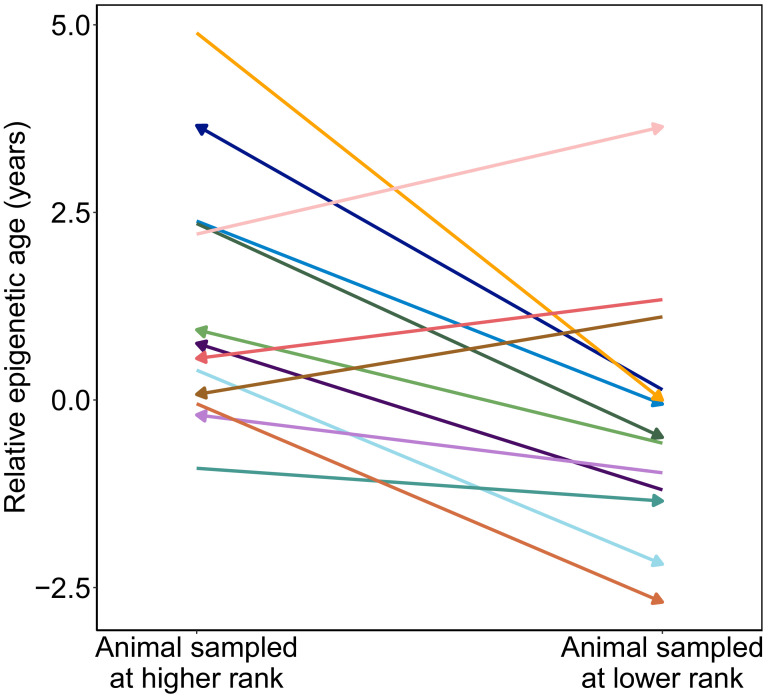
Aging, for virtually all life, is inescapable. However, within populations, biological aging rates vary. Understanding sources of variation in this process is central to understanding the biodemography of natural populations. We constructed a DNA methylation-based age predictor for an intensively studied wild baboon population in Kenya. Consistent with findings in humans, the resulting 'epigenetic clock' closely tracks chronological age, but individuals are predicted to be somewhat older or younger than their known ages. Surprisingly, these deviations are not explained by the strongest predictors of lifespan in this population, early adversity and social integration. Instead, they are best predicted by male dominance rank: high-ranking males are predicted to be older than their true ages, and epigenetic age tracks changes in rank over time. Our results argue that achieving high rank for male baboons - the best predictor of reproductive success - imposes costs consistent with a 'live fast, die young' life-history strategy.

Keywords: DNA methylation; P. cynocephalus; biological age; dominance rank; epigenetic clock; evolutionary biology; genetics; genomics; primates.

Plain language summary

For most animals, age is one of the strongest predictors of health and survival, but not all individuals age at the same rate. In fact, animals of the same species can have different 'biological ages' even when they have lived the same number of years. In humans and other mammals this variation in aging shows up in chemical modifications known as DNA methylation marks. Some researchers call these marks 'epigenetic', which literally means 'upon the genes'. And some DNA methylation marks change with age, so their combined pattern of change is often called the ‘epigenetic clock’. Environmental stressors, such as smoking or lack of physical activity, can make the epigenetic clock ‘tick’ faster, making the DNA of some individuals appear older than expected based on their actual age in years. These ‘biologically older’ individuals may also experience a higher risk of age-related disease. Studies in humans have revealed some of the reasons behind this fast biological aging, but it is unclear whether these results apply in the wild. It is possible that early life events trigger changes in the epigenetic clock, affecting health in adulthood. In primates, for example, adversity in early life has known effects on fertility and survival. Low social status also has a negative effect on health. To find out whether early experiences and the social environment affect the epigenetic clock, Anderson, Johnston et al. tracked DNA methylation marks in baboons. This revealed that epigenetic clocks are strong predictors of age in wild primates, but neither early adversity nor the strength of social bonds affected the rate at which the clocks ticked. In fact, it was competition for social status that had the most dramatic effect on the clock’s speed. Samples of males taken at different times during their lives showed that their epigenetic clocks sped up or slowed down as they moved up or down the social ladder, reflecting recent social experiences, rather than events early in their lives. On average, epigenetic clock measurements overestimated the age in years of alpha males by almost a year, showing that fighting to be on top comes at a cost. This study highlights one way in which the social environment can influence aging. The next step is to understand how health is affected by the ways that animals attain social status. This could help researchers who study evolution understand how social interactions and environmental conditions affect survival and reproduction. It could also provide insight into the effects of social status on human health and aging.


Conflict of interest statement

JA, RJ, AL, FC, TV, MA, SA, EA No competing interests declared, JT Reviewing editor, eLife

Figures

Figure 1.
Figure 1.. Epigenetic clock age predictions in the Amboseli baboons.
Predicted ages are shown relative to true chronological ages for (A) females (Pearson’s r = 0.78, p=6.78×10⁻³⁰, N = 142 samples) and (B) males (r = 0.86, p=5.49×10−41, N = 135 samples). Solid lines represent the best-fit line; dashed lines show the line for y = x. (C, D) Predictions for individuals with at least two samples in the data set (N = 30; 14 females and 16 males). In 26 of 30 cases (87%), samples collected later were correctly predicted to be from an older animal.
Figure 1—figure supplement 1.
Figure 1—figure supplement 1.. Characteristics of the RRBS data set.
(A) Proportion of the 458,504 evaluated CpG sites that overlapped annotated features of the Panu2 genome. (B) Proportion of annotated features in the Panu2 genome that overlapped at least one of the 458,504 evaluated CpG sites. (C) Distribution of mean DNA methylation levels for CpG sites within annotated features of the Panu2 genome. Each white box represents the interquartile range, with the median value depicted as a black horizontal bar. Whiskers extend to the most extreme values within 1.5× the interquartile range. As expected, CpG sites tended to be highly methylated genome-wide and have lower average methylation in promoters, enhancers, and CpG islands.
Figure 1—figure supplement 2.
Figure 1—figure supplement 2.. Comparison of clock performance across alternative values of alpha.
Alpha was set via grid search across possible values from 0.1 to 1, in steps of 0.1, and chosen based on the highest R2 value between predicted age and known chronological age (red lines). The blue lines show the median absolute difference between predicted and true age (lower is better) and exhibits roughly inverse behavior to R2. (A) For each clock generated with a different alpha value, the total number of CpG sites included in the clock is shown on top, and the number of clock sites that overlap the final clock used in this study (N = 573 sites, alpha = 0.1) is given in parentheses immediately below. (B, C) As in (A), but with results shown specifically for males (B) versus females (C).
Figure 1—figure supplement 3.
Figure 1—figure supplement 3.. Enrichment of the epigenetic clock CpG sites by genomic compartment.
The log2(odds ratio) of CpG sites in the epigenetic clock, relative to all 458,504 CpG sites initially evaluated, in (A) annotated genomic regions and (B) in loci with putative regulatory activity or in or near genes that are responsive to age or immune stimulation. Regions of regulatory activity were identified with the massively parallel reporter assay, mSTARR-Seq (Lea et al., 2018a), following a liftover from the human genome to the baboon genome to identify putatively orthologous coordinates. Age differentially methylated regions (DMR) and genes responsive to lipopolysaccharide (LPS) were previously identified from blood samples from the same baboon population (Lea et al., 2015a; Lea et al., 2018b). Two-sided Fisher’s exact tests were performed separately for epigenetic clock sites that increased (positive clock sites: N = 459) or decreased (negative clock sites: N = 134) in DNA methylation levels with age. See Supplementary file 2 for a complete list of the genomic locations of the 573 epigenetic clock sites. *p<0.05, ***p<0.005.
Figure 1—figure supplement 4.
Figure 1—figure supplement 4.. Association between age and DNA methylation level for individual clock CpG sites.
(A) Volcano plot of the effect size (βage) versus the –log10(p-value) of age effects on DNA methylation for males (blue) and females (red), based on estimates from a binomial mixed-effects model designed for bisulfite sequencing data (Lea et al., 2015a). Results for the 534 sites that could be modeled using this approach are shown. Other predictor variables in the model included a fixed effect for sample batch and a random effect that controlled for kinship (estimated via Queller and Goodnight’s r and multilocus microsatellite genotype data in the program coancestry Wang, 2011). Dashed line corresponds to a nominal p-value of 0.01. (B) Age effects on DNA methylation estimated separately in males and females are highly correlated (R2 = 0.83, p=3.35×10−204). The dashed line indicates the y = x line. The solid black line indicates the best-fit line.
Figure 1—figure supplement 5.
Figure 1—figure supplement 5.. Comparison of the performance of the epigenetic clock to other predictors of chronological age.
Performance measures of age predictors are presented separately for females (A, C, E) and males (B, D, F) except for differential white blood cell counts (blood smears), where males and females were combined. Predictors are ordered in the same fashion in all panels (epigenetic clock to the left, and then following highest to lowest R2 in females). The breakpoint to define youthful versus aged animal BMI was 10 and 8 years old for females and males, respectively. (A, B) Adjusted R2 between predicted age and true chronological age. (C, D) Absolute difference between the y = x line (slope of one) and the slope of the best-fit line of predicted age as a function of true chronological age. This metric captures bias in age prediction estimates (values that are lower on the reverse-coded y-axis are more biased). (E, F) Median absolute difference (MAD) between each individual’s predicted age and true chronological age (values that are lower on the reverse-coded y-axis have higher MAD).
Figure 2.
Figure 2.. Dominance rank predicts relative epigenetic age in male baboons.
High rank is associated with elevated values of Δage (β = −0.0785, p=7.39×10⁻⁴, N = 105). The y-axis shows relative epigenetic age, a measure of epigenetic aging similar to Δage that is based on the sample-specific residuals from the relationship between predicted age and true chronological age. Positive (negative) values correspond to predicted ages that are older (younger) than expected for that chronological age. Dominance rank is measured using ordinal values, such that smaller values indicate higher rank. Dots and error bars represent the means and standard errors, respectively. Gray values above the x-axis indicate sample sizes for each rank.
Figure 2—figure supplement 1.
Figure 2—figure supplement 1.. Methylation levels of clock CpG sites across different genomic compartments.
Each circle represents a sample, with chronological age of the animal at time of sampling shown on the x-axis. The y-axis represents the average methylation level for that sample across CpG clock sites that overlap the annotated genomic region shown in the panel label, stratified by sites that increased (denoted ‘hyper’) or decreased (denoted ‘hypo’) methylation levels with age. Number of clock sites overlapping each annotated region is given in each panel title; a clock site can overlap multiple annotated regions and can therefore be represented in more than one plot. Red and blue lines represent best-fit lines for female and male samples, respectively. All best-fit lines are significant (p<1×10⁻⁴).
Figure 2—figure supplement 2.
Figure 2—figure supplement 2.. The relationship between age and body mass index in the Amboseli baboons.
Chronological age in years at the time of sampling versus body mass index (kilograms/meters2) for males and females in our sample. Two distinct patterns are observable for both sexes: a stage when animals are still growing (prior to ~7–8 years old) and a stage in which animals vary in BMI as adults. BMI in baboons is measured using the distance between the crown of the head and the rump as the ‘height’ measure and so differs in scale from humans, where BMI is calculated using standing height. Dashed gray line at BMI = 41 shows the cut-off for the analysis in which only males with BMI > 41 were retained for modeling Δage.
Figure 2—figure supplement 3.
Figure 2—figure supplement 3.. Relative epigenetic age versus chronological age.
Each circle represents a baboon, colored by the animal’s dominance rank at the time of sampling. The y-axis shows relative epigenetic age, a measure of epigenetic aging similar to Δage that is based on the sample-specific residuals from the relationship between predicted age and true chronological age. Positive (negative) values correspond to predicted ages that are older (younger) than expected for that chronological age. Dominance rank is measured using ordinal values, such that smaller values indicate higher rank.
Figure 2—figure supplement 4.
Figure 2—figure supplement 4.. Male dominance rank versus chronological age.
Each circle represents a male baboon at the time of sampling. Nearly all males in the top four rank positions are between ages 7 and 12 years (but not all 7–12 year olds are also high ranking: range of rank positions = 1–20), whereas both young and old males tend to be lower ranking. The quadratic curve represents the model with dominance rank as the response variable and age and age2 as the predictor variables. Rank-for-age was defined as the residuals of this model.
Figure 3.
Figure 3.. Male baboons exhibit higher relative epigenetic age when they occupy higher ranks.
Relative epigenetic age for males in which multiple samples were collected when they occupied different ordinal rank values. Arrow indicates the temporal direction of rank changes: left-facing arrows represent cases in which the later sample was collected when males were higher ranking, and right-facing arrows represent cases in which the later sample was collected when males were lower ranking.
Author response image 1.
Author response image 2.
Author response image 2.. Results of the full male dataset are qualitatively the same as results when excluding low BMI/young males.
(A,C) Chronological age in years at the time of sampling versus body mass index (kilograms/meters2) for (A) all males in our sample or (C) only males with BMI > 41 (i.e., only males above the dashed line in (A). (B,D) Results from the analysis including (B) all males in our sample (as presented in our main model) or (D) only males with BMI > 41.
Author response image 3.
Author response image 3.. (A) Age-adjusted BMI (as reported in the manuscript and provided in Supplementary Table 1) does not predict the difference between predicted age and chronological age (p=0.
18). (B) We found that Reviewer 1’s correlation, as shown in the review, can be recreated (C) only by adding raw BMI to our age-adjusted BMI values, which essentially removes the age-adjustment.
Author response image 4.
Author response image 4.. (A) Our simulation (based on sampling from the multivariate normal) produces the same correlation between the simulated variable and chronological age as observed for chronological age and the BMI in the real data (r = 0.60).
(B) The simulated variable significantly predicts Δage (predicted epigenetic age-chronological age) due to its correlation with chronological age. (C) Correcting for the chronological age compression effect (“residual epigenetic age”), as performed in the main manuscript, eliminates this artifactual correlation.
Author response image 5.
Author response image 5.. (A) 1000 simulations of this random variable consistently result in a negative correlation with Δage.
(B) The spurious negative correlation is consistently eliminated by using residual epigenetic age. Histogram shows data from the same 1000 simulations, except with Δage corrected for the compression effect shown in main manuscript Figure 1. Histograms are colored based on the significance of the correlation between the simulated variable and either Δage or residual epigenetic age (p < 0.05 in blue, 0.05 0.10 in grey).

Comment in

  • The temporary cost of dominance.
    Ryan CP, Kuzawa CW. Ryan CP, et al. Elife. 2021 Apr 30;10:e68790. doi: 10.7554/eLife.68790. Elife. 2021. PMID: 33929318 Free PMC article.

References

    1. Alberts SC, Watts HE, Altmann J. Queuing and queue-jumping: long-term patterns of reproductive skew in male savannah baboons, Papio cynocephalus. Animal Behaviour. 2003;65:821–840. doi: 10.1006/anbe.2003.2106. - DOI
    1. Alberts SC, Buchan JC, Altmann J. Sexual selection in wild baboons: from mating opportunities to paternity success. Animal Behaviour. 2006;72:1177–1196. doi: 10.1016/j.anbehav.2006.05.001. - DOI
    1. Alberts SC, Altmann J. Balancing costs and opportunities: dispersal in male baboons. The American Naturalist. 1995a;145:279–306. doi: 10.1086/285740. - DOI
    1. Alberts SC, Altmann J. Preparation and activation: determinants of age at reproductive maturity in male baboons. Behavioral Ecology and Sociobiology. 1995b;36:397–406. doi: 10.1007/BF00177335. - DOI
    1. Alberts SC, Altmann J. Immigration and hybridization patterns of yellow and anubis baboons in and around Amboseli, Kenya. American Journal of Primatology. 2001;53:139–154. doi: 10.1002/ajp.1. - DOI - PubMed

Publication types