Comparative Study
. 2021 Jul 1;181(7):913-921.
doi: 10.1001/jamainternmed.2021.1644.

Comparison of Estimated Effectiveness of Case-Based and Population-Based Interventions on COVID-19 Containment in Taiwan

Affiliations
Comparative Study

Comparison of Estimated Effectiveness of Case-Based and Population-Based Interventions on COVID-19 Containment in Taiwan

Ta-Chou Ng et al. JAMA Intern Med. .

Abstract

Importance: Taiwan is one of the few countries with initial success in COVID-19 control without strict lockdown or school closure. The reasons remain to be fully elucidated.

Objective: To compare and evaluate the effectiveness of case-based (including contact tracing and quarantine) and population-based (including social distancing and facial masking) interventions for COVID-19 in Taiwan.

Design, setting, and participants: This comparative effectiveness study used a stochastic branching process model using COVID-19 epidemic data from Taiwan, an island nation of 23.6 million people, with no locally acquired cases of COVID-19 reported for 253 days between April and December 2020.

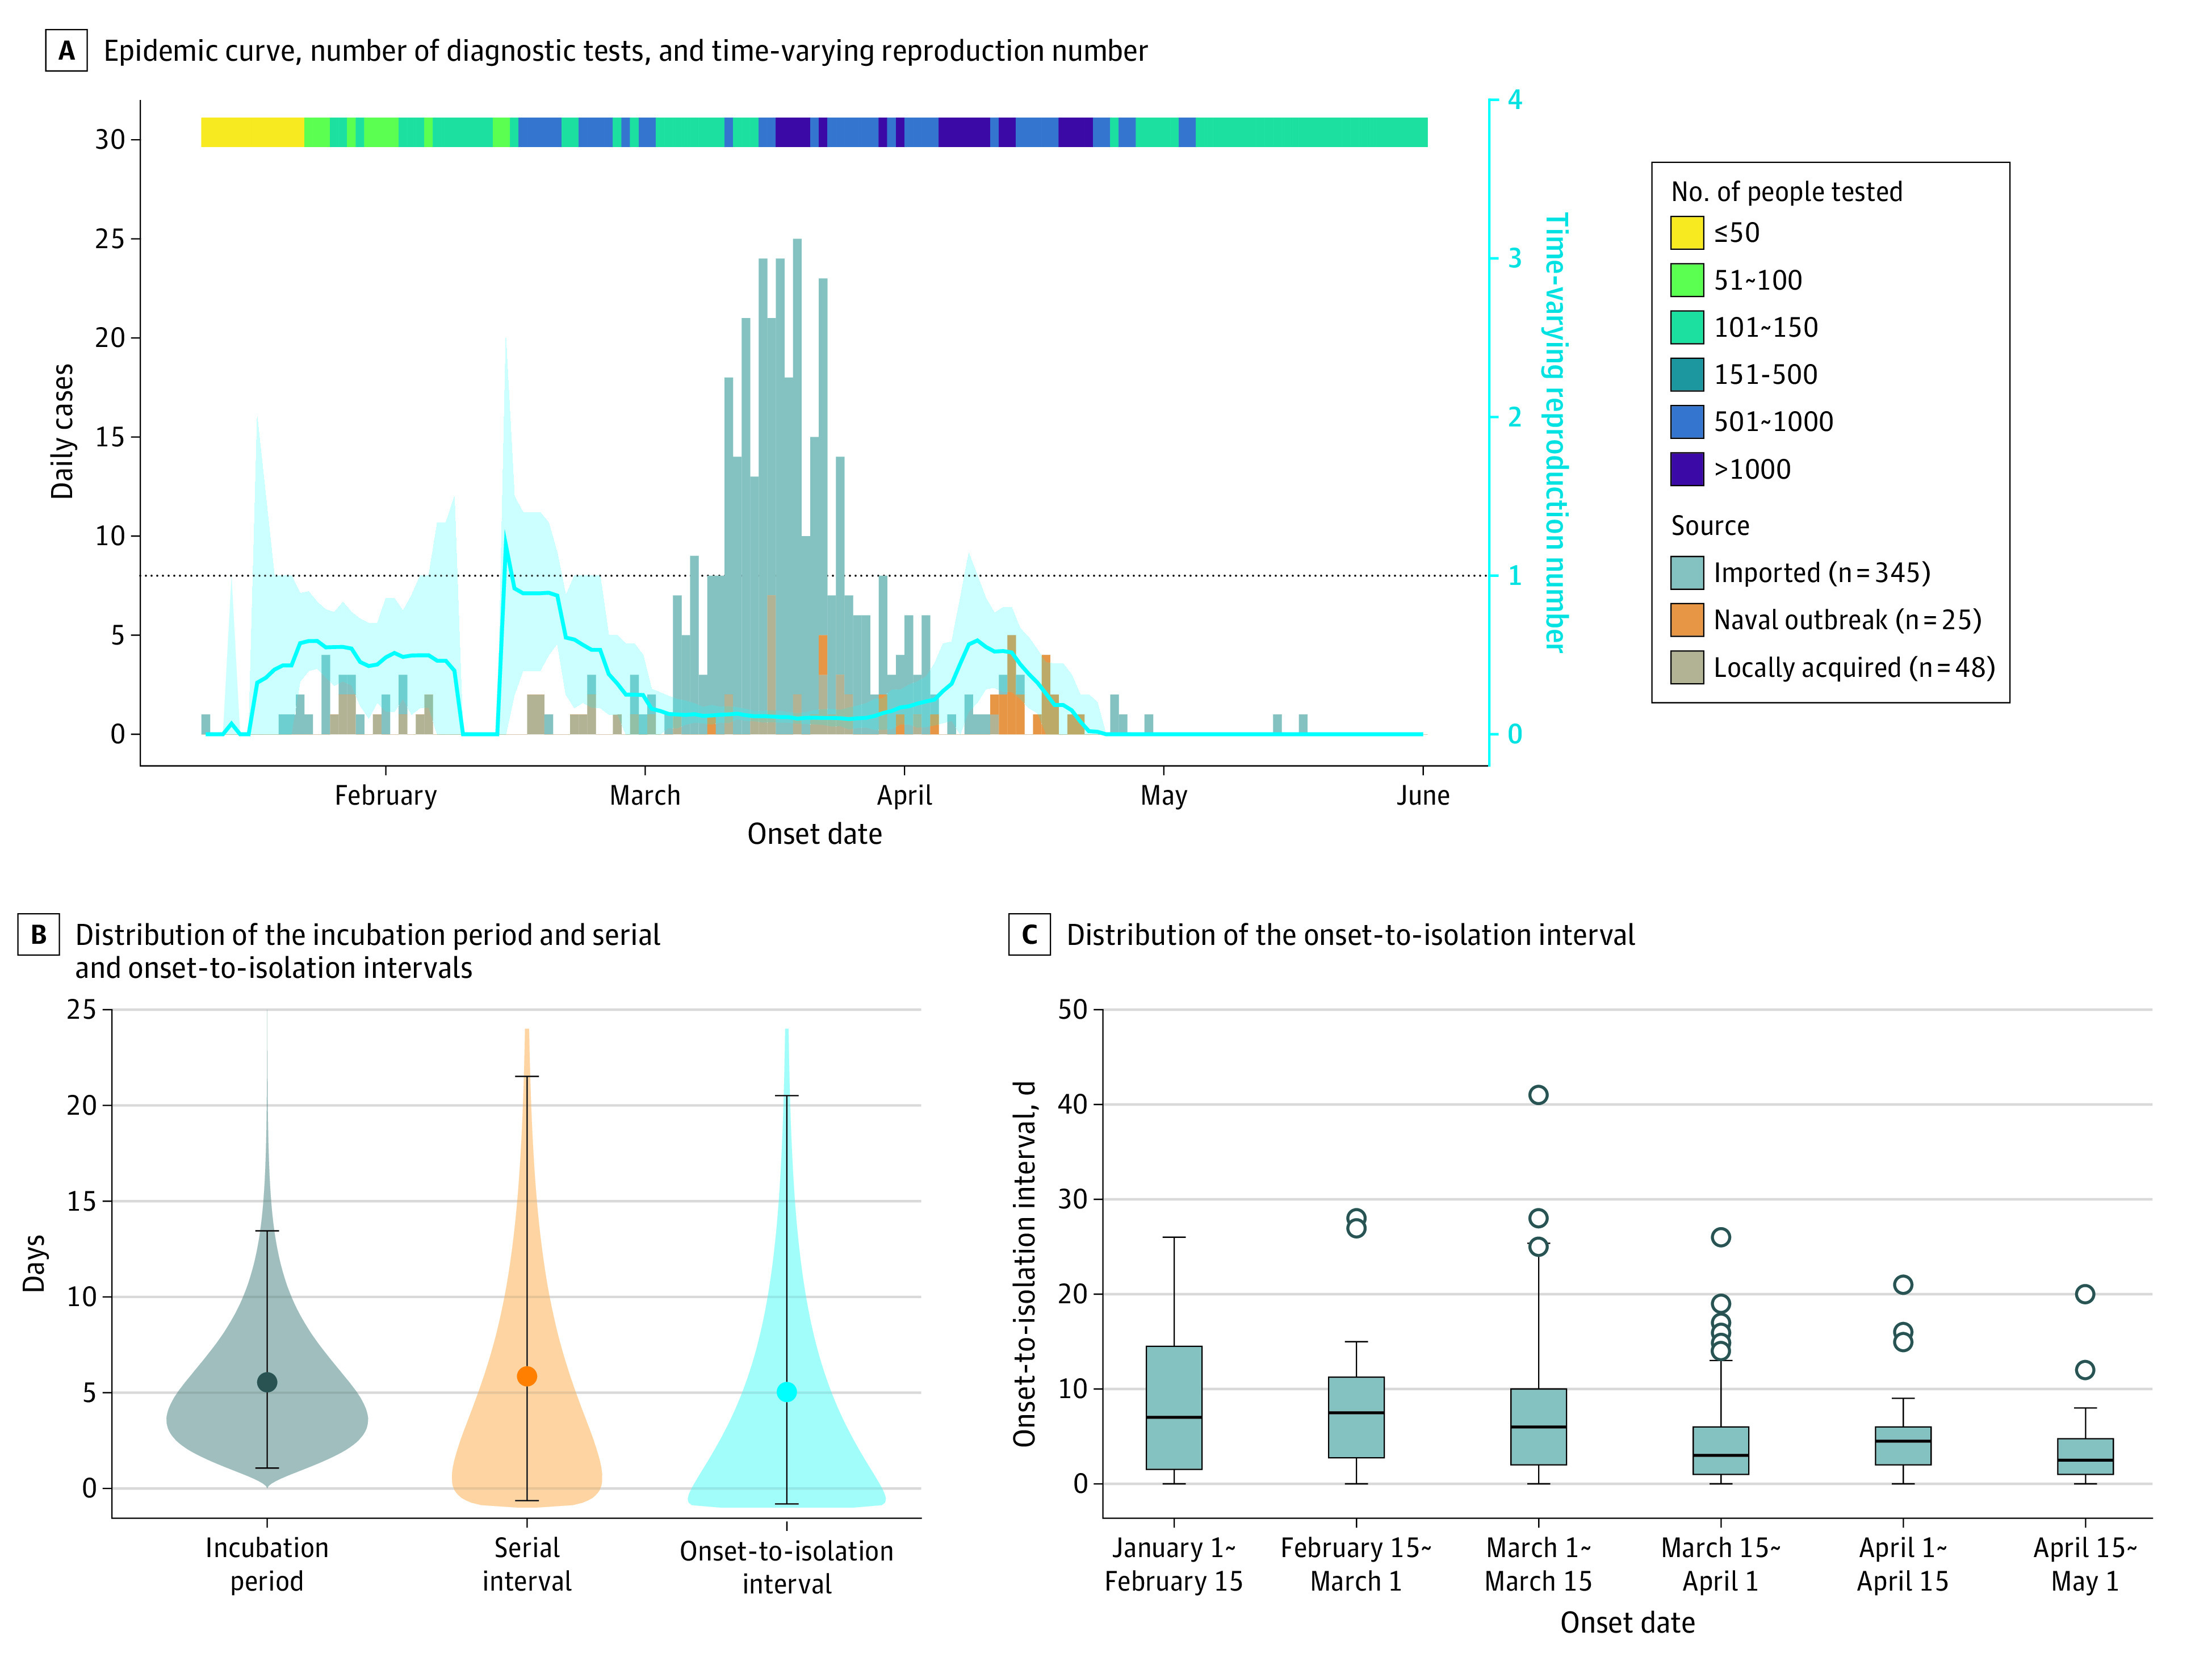
Main outcomes and measures: Effective reproduction number of COVID-19 cases (the number of secondary cases generated by 1 primary case) and the probability of outbreak extinction (0 new cases within 20 generations). For model development and calibration, an estimation of the incubation period (interval from exposure to symptom onset), serial interval (time between symptom onset in an infector-infectee pair), and the statistical distribution of the number of any subsequent infections generated by 1 primary case was calculated.

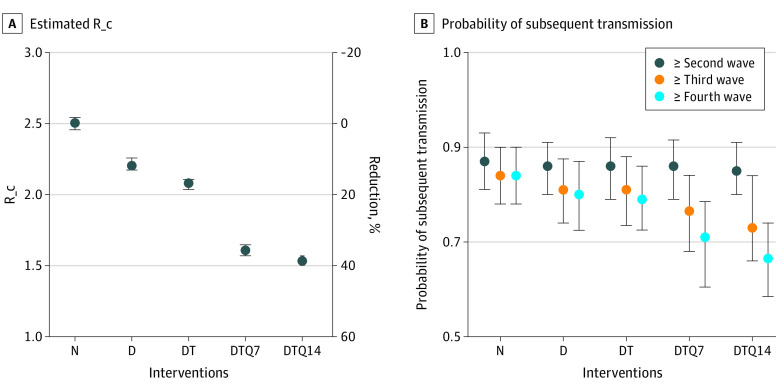
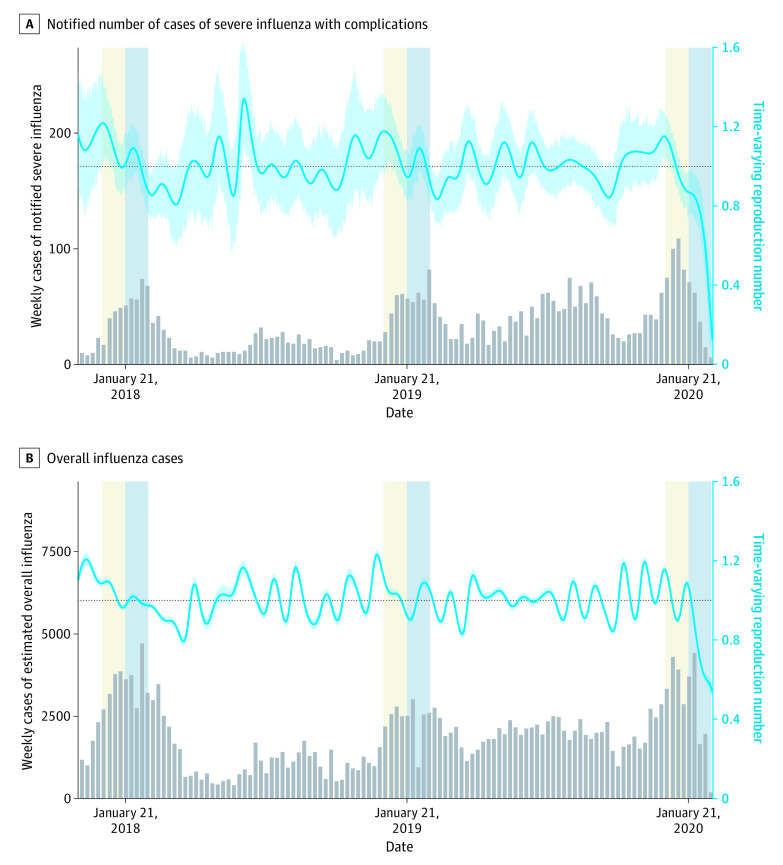
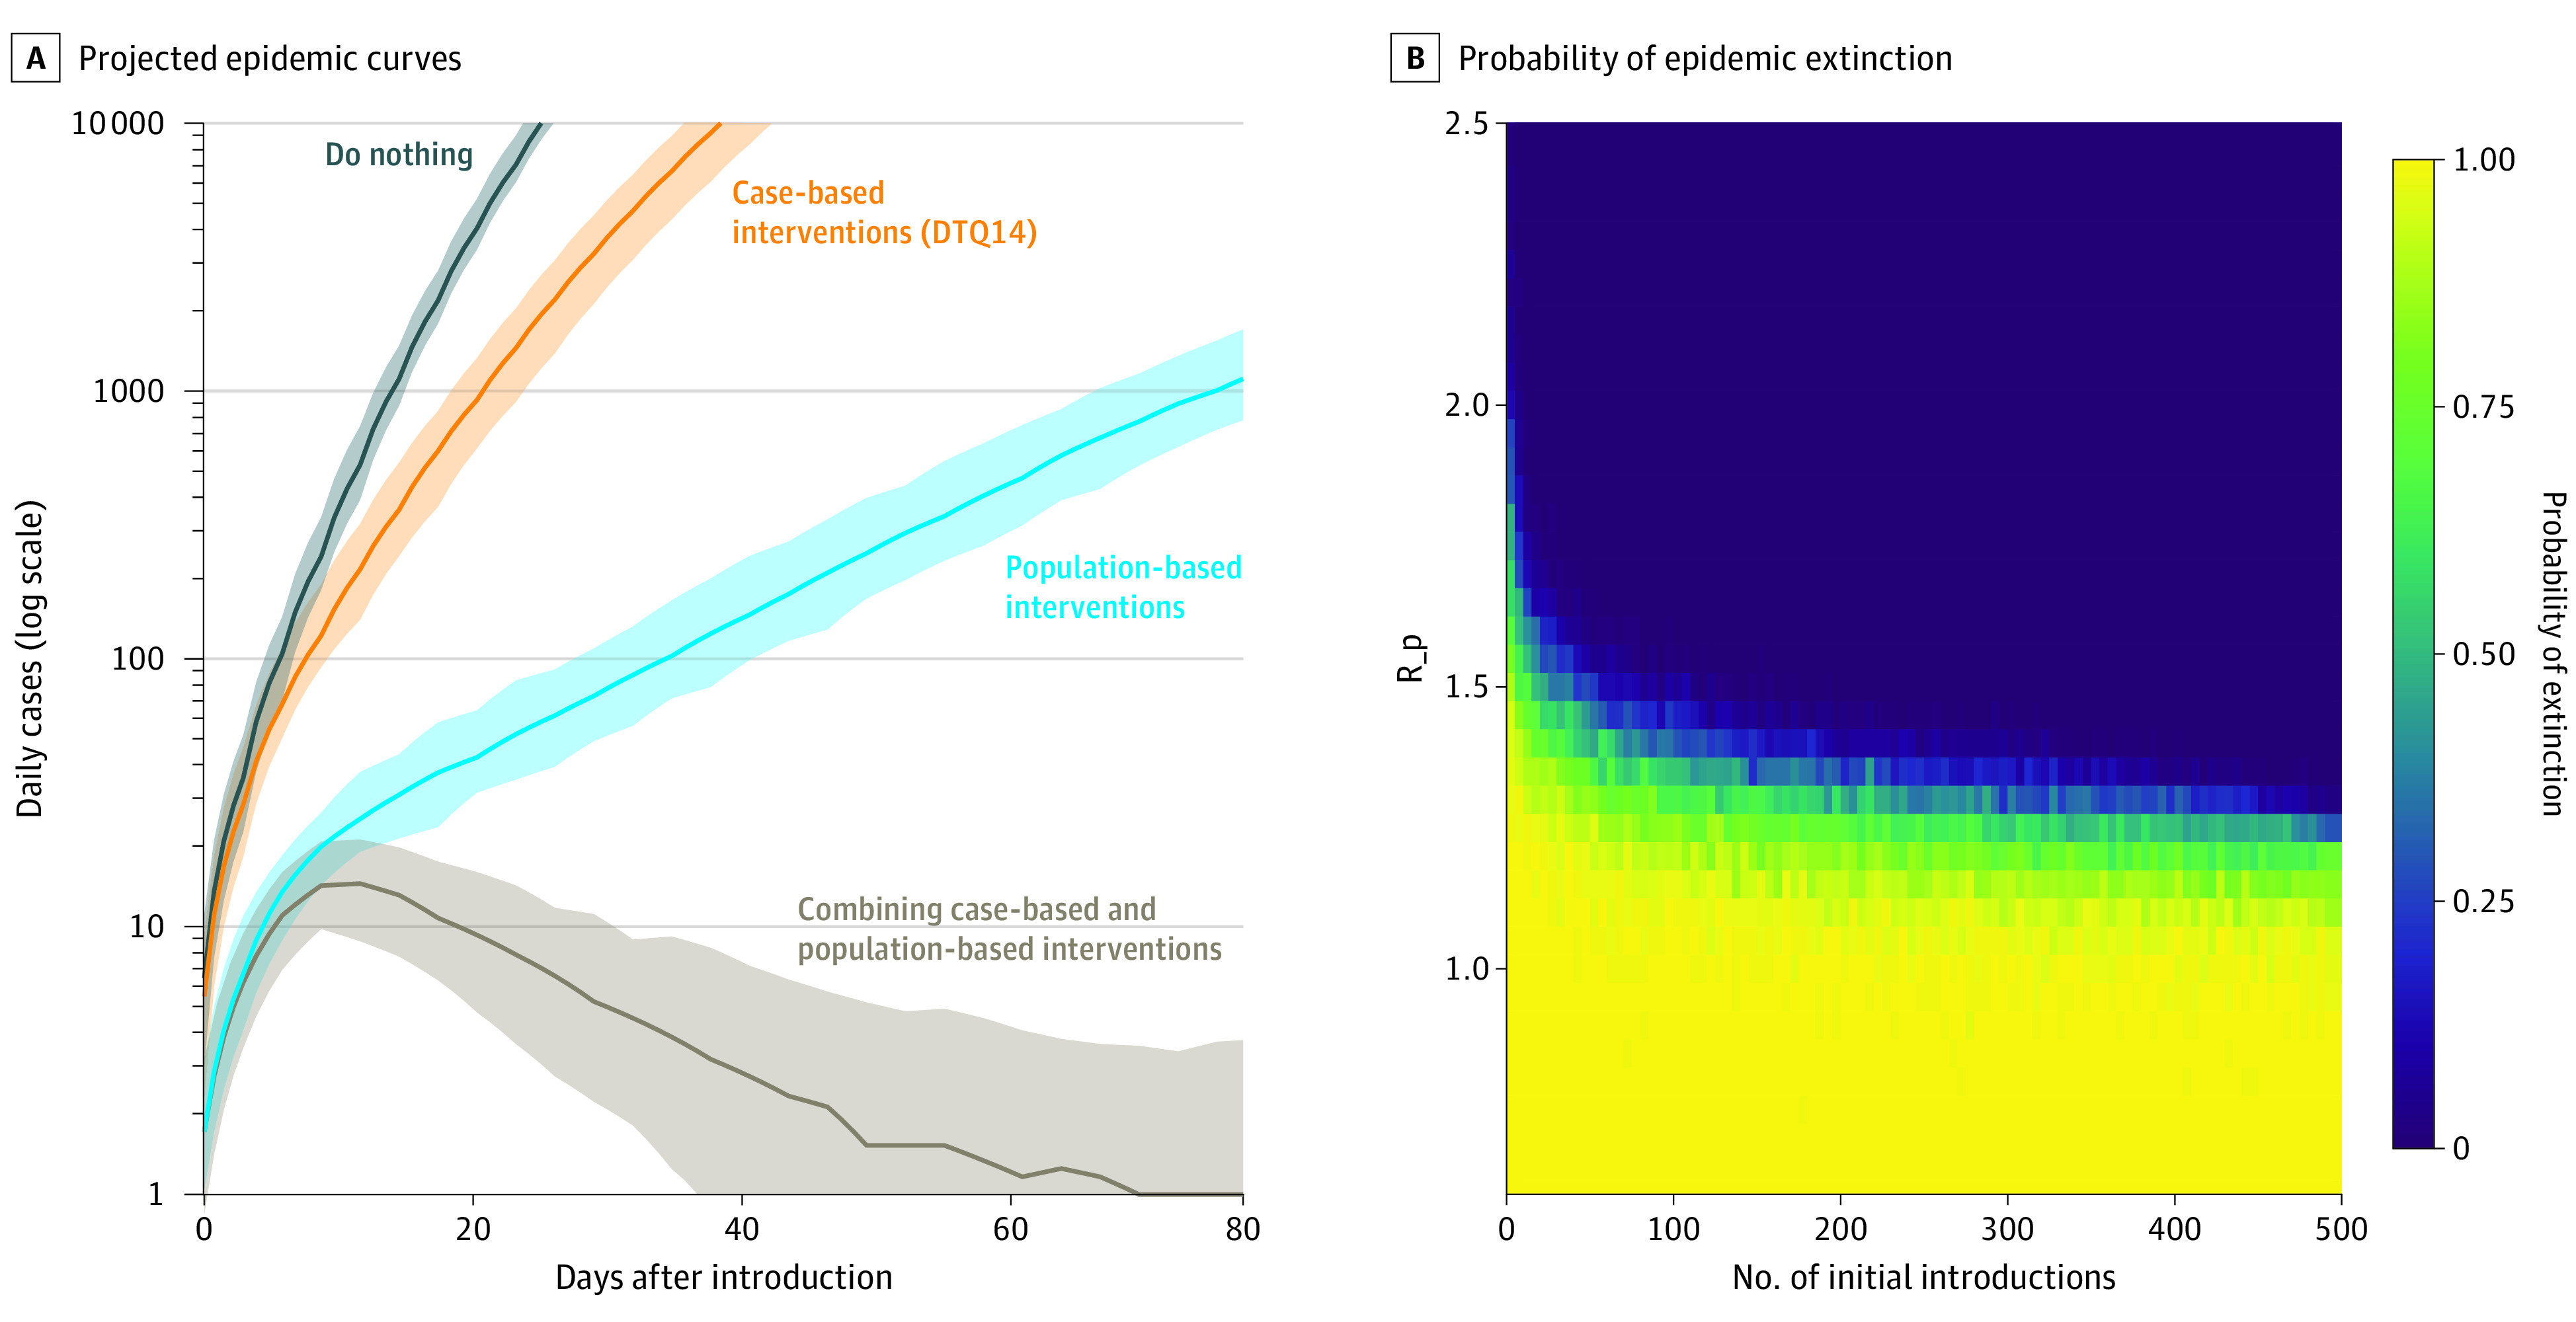
Results: This study analyzed data from 158 confirmed COVID-19 cases (median age, 45 years; interquartile range, 25-55 years; 84 men [53%]). An estimated 55% (95% credible interval [CrI], 41%-68%) of transmission events occurred during the presymptomatic stage. In our estimated analysis, case detection, contact tracing, and 14-day quarantine of close contacts (regardless of symptoms) was estimated to decrease the reproduction number from the counterfactual value of 2.50 to 1.53 (95% CrI, 1.50-1.57), which would not be sufficient for epidemic control, which requires a value of less than 1. In our estimated analysis, voluntary population-based interventions, if used alone, were estimated to have reduced the reproduction number to 1.30 (95% CrI, 1.03-1.58). Combined case-based and population-based interventions were estimated to reduce the reproduction number to below unity (0.85; 95% CrI, 0.78-0.89). Results were similar for additional analyses with influenza data and sensitivity analyses.

Conclusions and relevance: In this comparative effectiveness research study, the combination of case-based and population-based interventions (with wide adherence) may explain the success of COVID-19 control in Taiwan in 2020. Either category of interventions alone would have been insufficient, even in a country with an effective public health system and comprehensive contact tracing program. Mitigating the COVID-19 pandemic requires the collaborative effort of public health professionals and the general public.


Conflict of interest statement

Conflict of Interest Disclosures: Dr Cohen reported grants from the National Institutes of Health outside the submitted work. No other disclosures were reported.

Figures

Figure 1.
Figure 1.. Epidemiological Characteristics and Parameters of the COVID-19 Cases in Taiwan From January 10 to June 1, 2020
A, The epidemic curve, number of diagnostic tests by day, and the time-varying reproduction number. The blue line and the light blue shading represent the point estimate and 95% confidence interval of time-varying reproduction number of COVID-19. B, Distribution of the incubation period, serial interval, and onset-to-isolation interval. The points and the intervals represent the mean estimates and the 2.5 and 97.5 percentiles of the estimated distribution. The shaded areas represent the mean estimation of the interval distribution. C, Distribution of the onset-to-isolation interval by onset date. The central lines indicate the median, boxes indicate interquartile ranges, whiskers indicate the upper and lower adjacent values (within 1.5-fold of the interquartile range), and isolated points indicate outliers.
Figure 2.
Figure 2.. Effective Reproduction Number (R_c) of COVID-19 Cases Under Different Combination of Case-Based Interventions Based on the Fitted Transmission Model
Results were based on 1000 stochastic simulations under the counterfactual R0 value of 2.5 and 100 introductions. Whiskers indicate 95% credible intervals. A, Estimated R_c and the proportional reduction of R_c from the counterfactual value of 2.5. B, The probability of subsequent transmission from an index case. D indicates case detection; N, none of the case-based interventions are implemented; T, contact tracing; Q7/Q14, quarantine of contacts for 7 or 14 days.
Figure 3.
Figure 3.. Incidence and Time-Varying Reproduction Number of Influenza in Taiwan, 2018 to 2020
A, Estimates from the notified number of cases of severe influenza with complications. B, Estimates from the overall influenza cases derived from the frequency of consulting physicians about influenza-like illness and the positive rate from laboratory testing for influenza. The gray bars represent the number of weekly incident cases and the blue curves represent the time-varying reduction number with 95% CIs in the shaded area. The thirty-day windows before and after January 21 of the 3 illustrated years are highlighted (yellow and blue background). January 21, 2020, was the date of the first confirmed SARS-CoV-2 infection in Taiwan.
Figure 4.
Figure 4.. Projections on Epidemic Trajectory and Probability of Epidemic Extinction Under Joint Case-Based and Population-Based Interventions
A, The projected epidemic curves with 100 initial introductions under different scenarios regarding the intervention being implemented. The 4 scenarios included (1) no intervention, (2) case-based interventions only, (3) population-based interventions only, and (4) combining case-based and population-based interventions. We assumed a sensitivity of 95% for case detection, an ascertainment probability for contact tracing of 90%, and a 48% reduction in background input basic reproduction number (R0) by population-based interventions (R0, 2.5; R_p, 1.3). The uncertainty intervals were calculated by the 2.5th and 97.5th percentiles from 1000 replicate simulations. B, The probability of epidemic extinction using case-based interventions (detection, contact tracing, and 14-day quarantine of close contacts) under different levels of population-based interventions (R_p) and initial numbers of introductions. Each cell presents the estimated probability of extinction based on 100 replicate simulations using the transmission model. D indicates case detection; T, contact tracing; Q14, quarantine of contacts for 14 days.

Comment in

References

    1. Lai S, Ruktanonchai NW, Zhou L, et al. . Effect of non-pharmaceutical interventions to contain COVID-19 in China. Nature. 2020;585(7825):410-413. doi:10.1038/s41586-020-2293-x - DOI - PMC - PubMed
    1. Flaxman S, Mishra S, Gandy A, et al. ; Imperial College COVID-19 Response Team . Estimating the effects of non-pharmaceutical interventions on COVID-19 in Europe. Nature. 2020;584(7820):257-261. doi:10.1038/s41586-020-2405-7 - DOI - PubMed
    1. Davies NG, Kucharski AJ, Eggo RM, Gimma A, Edmunds WJ; Centre for the Mathematical Modelling of Infectious Diseases COVID-19 working group . Effects of non-pharmaceutical interventions on COVID-19 cases, deaths, and demand for hospital services in the UK: a modelling study. Lancet Public Health. 2020;5(7):e375-e385. doi:10.1016/S2468-2667(20)30133-X - DOI - PMC - PubMed
    1. Hao X, Cheng S, Wu D, Wu T, Lin X, Wang C. Reconstruction of the full transmission dynamics of COVID-19 in Wuhan. Nature. 2020;584(7821):420-424. doi:10.1038/s41586-020-2554-8 - DOI - PubMed
    1. Chinazzi M, Davis JT, Ajelli M, et al. . The effect of travel restrictions on the spread of the 2019 novel coronavirus (COVID-19) outbreak. Science. 2020;368(6489):395-400. doi:10.1126/science.aba9757 - DOI - PMC - PubMed