. 2021 May 31;30(11):996-1005.
doi: 10.1093/hmg/ddab095.

FOXO1 controls protein synthesis and transcript abundance of mutant polyglutamine proteins, preventing protein aggregation

Affiliations

FOXO1 controls protein synthesis and transcript abundance of mutant polyglutamine proteins, preventing protein aggregation

Gabriel Vasata Furtado et al. Hum Mol Genet. .

Abstract

FOXO1, a transcription factor downstream of the insulin/insulin like growth factor axis, has been linked to protein degradation. Elevated expression of FOXO orthologs can also prevent the aggregation of cytosine adenine guanine (CAG)-repeat disease causing polyglutamine (polyQ) proteins but whether FOXO1 targets mutant proteins for degradation is unclear. Here, we show that increased expression of FOXO1 prevents toxic polyQ aggregation in human cells while reducing FOXO1 levels has the opposite effect and accelerates it. Although FOXO1 indeed stimulates autophagy, its effect on polyQ aggregation is independent of autophagy, ubiquitin-proteasome system (UPS) mediated protein degradation and is not due to a change in mutant polyQ protein turnover. Instead, FOXO1 specifically downregulates protein synthesis rates from expanded pathogenic CAG repeat transcripts. FOXO1 orchestrates a change in the composition of proteins that occupy mutant expanded CAG transcripts, including the recruitment of IGF2BP3. This mRNA binding protein enables a FOXO1 driven decrease in pathogenic expanded CAG transcript- and protein levels, thereby reducing the initiation of amyloidogenesis. Our data thus demonstrate that FOXO1 not only preserves protein homeostasis at multiple levels, but also reduces the accumulation of aberrant RNA species that may co-contribute to the toxicity in CAG-repeat diseases.


Figures

Figure 1
Figure 1
FOXO1 reduces mutant HTT aggregation. (A–D) Filter trap analysis of different mutant HTT constructs in presence or absence of Flag-FOXO1. HEK293T cells expressing HTTQ43GFP, HA-HTTQ43, HTTQ71GFP or HTTQ119YFP with (black bar) or without (grey bar) Flag-FOXO1. Insoluble HTTQ43GFP (A) HA-HTTQ43 (B), HTTQ71GFP (C) or HTTQ119YFP (D) aggregation was detected by filter trap and quantified. Lower panels depict filter trap blots probed with GFP antibody. Upper panel shows a graph that depicts the mean and standard error of mean (SEM) of 3 replicates. P-values were derived from two-tailed Student’s t test. (E) Representative IF staining of HEK293T cells co-expressing HTTQ119YFP with or without Flag-FOXO1 (lower and upper row). First column depicts HTTQ119YFP (green), the second column depicts Flag-FOXO (red), the third column depicts DAPI (in blue) and the fourth column shows the merge. Inlay depicts the localization of Flag-FOXO in relation to the nucleus. Bar = 100 μm. (F) Quantification of cells treated as in E. Graph showing the mean and standard deviation (SD) of three independent replicates. (G–I) Western blot analysis of HEK293T cells expressing HTTQ43GFP (G), HTTQ71GFP (H) or GFP (I) is shown. Lower panels western blots using the indicated antibodies are shown. Upper panels graphs depicting the mean and SD of 3 independent experiments is shown. All panels, P-values were derived from two-tailed Student’s t test. (J) Filter trap analysis of HEK293 cells expressing HTTQ71GFP, treated with the indicated siRNA. Lower panels depict filter trap blots probed with GFP antibody. Upper panel shows a graph that depicts the mean and SEM of 4 replicates.
Figure 2
Figure 2
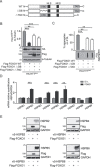
HSPBs protein expression is not significantly changed by FOXO1. (A) Schematic representation of FOXO1 and truncation mutants used. (B) Western blot analysis of cells expressing HA-HTTQ43 (grey bar) and Flag-FOXO1 (black bar) or its truncated mutants (white bars). Lower panel depicts immunoblots against the indicated antibodies. Upper panel graph depicts the mean and SEM of 3 independent experiments. (C) Filter trap analysis of cells treated as in B. Lower panel filter trap probed with HA antibody is shown. Upper panel graph depicts the mean and SEM of 3 independent experiments. **P < 0.001; ***P < 0.0001. (D) qPCR analysis of HEK293T cells transfected with (black bars) or without (grey bars) Flag-FOXO1. Graph depicts the relative levels of the indicated genes. All data were normalized to GAPDH and were corrected to EV. (E) Analysis of protein expression levels induced by Flag-FOXO1 expression. HEK293T cells were transfected with EV, Flag-FOXO1 or a V5 tagged HSPB (as an antibody control). Representative western blots using antibodies against HSPB2, HSPB4, HSPB5, HSPB6, Flag and GAPDH are shown. **P < 0.001; ***P < 0.0001.
Figure 3
Figure 3
The effects of FOXO1 on mutant HTT aggregation are unrelated to protein degradation. (A) FTA of HEK293T cells expressing HA-HTTQ43 with or without Flag-FOXO1 and treated with autophagy inhibitors or not. Autophagy inhibitors were added 18 h after transfection. Lower panel depicts a filter trap blot probed with HA antibodies. Upper panel depicts the graph with the quantification. Mean and SEM of three independent experiments are shown. (B) Western blot analysis of HEK293T cells receiving the same treatment as in A. Lower panel: western blots using the indicated antibodies are shown. Upper panel: graph with quantification of soluble HA signal normalized against α-tubulin is shown. Mean and SEM of three independent experiments are shown. (C) Protein fractionation analysis of Atg5 (+/+) and Atg5 (−/−) MEFs expressing HA-HTTQ43 with (black bar) or without (grey bar) Flag-FOXO1, or MYC-BAG3 (white bar). Lower panel: soluble and insoluble HA-HTTQ43 were detected by western blotting using the indicated antibodies. Upper panels graphs depicting the quantification of insoluble (up) or soluble (below) HA-HTTQ43. The mean and SEM of 3 independent experiments are shown. (D) Western blot analysis of HEK293T cells expressing HA-HTTQ43 with or without FOXO1, followed by proteasome inhibitor treatments (Bortezomib or MG132) for 6 h. Lower panel a filter trap probed against HA antibodies is shown. Upper panel depicts the graph with the Mean and SEM of three independent experiments. (E) Filter trap analysis of cells treated as in D. Lower panel, western blots using the indicated antibodies are shown. Upper panel, graph depicting the mean and SEM of three independent experiments is shown. (F) Pulse chase analysis of HTTQ43GFP. HEK293T cells expressing HTTQ43GFP with or without Flag-FOXO1 were pulse labelled with cys/met-35S for 40 min followed by a cold chase for the indicated time. At each time point cells were lysed and HTTQ43GFP was immunoprecipitated using GFP-trap®. Autoradiography (AR indicating the 35S signal) and western blot using GFP are shown. EV stands for empty vector. The data of the control (EV) have been published before as these experiments were conducted together (10). (G) Quantification of percentage of 35S incorporated in HTTQ43GFP with (black squares) or without (grey circle) FOXO1 over time, normalized to total GFP and to time point 0.5 h. The mean and SEM of 3 independent experiments are shown. All panels: P-values were derived from two-tailed Student’s t test. *P < 0.05; ***P < 0.0001.
Figure 4
Figure 4
FOXO1 specifically reduces mRNA levels of HTT transcripts with pathological CAG length. (A) Pulse labelling analysis of HTTQ43GFP. HEK293T cells expressing HTTQ43GFP with or without Flag-FOXO1 were pulse labelled with cys/met-35S for the indicated times. At each time point cells were lysed and HTTQ43GFP was immunoprecipitated using GFP-trap®. AR (AR indicating the 35S signal) and western blot using GFP are shown. EV stands for empty vector. The data of the control (EV) have been published before as these experiments were conducted together (García-Huerta et al. 2020). (B) Quantification of pulse labelling in A. Graph depicts the percentage of 35S incorporated over times in HTTQ43GFP with (black squares) or without (grey circle) expression of Flag-FOXO1, normalized to total GFP and to time point zero. Mean and SEM of 3 independent experiments are shown. (C) qPCR analysis of HEK293T cells expressing different HTTCAG sizes with (black bars) or without (grey bars) Flag-FOXO1 using primers detecting GFP. All data were normalized to GAPDH and were corrected to EV Graph depicting the mean and SEM of 3 independent experiments is shown. All panels: P-values were derived from two-tailed Student’s t test. (D) Relative quantification of endogenous HTTCAGnon-expanded expression with (black bars) or without (grey bars) Flag-FOXO1 and different sizes of exogenous HTTCAG by qPCR. All data were normalized by GAPDH as reference and were corrected to EV All images show typical experiments; all experiments were repeated three times. P-values were derived from two-tailed Student’s t test. *P < 0.05; **P < 0.001; ***P < 0.0001.
Figure 5
Figure 5
FOXO1 requires mRNA binding proteins to affect polyQ levels. (A) GO analysis (using DAVID 6.8) of proteins bound to GFP-HTTCAG47mRNA with (black bars) or without (grey bars) Flag-FOXO1 overexpression. (B) qPCR analysis of STAU1, IGF2BP3, FUS, DDX18, DDX41 and TAF15 in cells that express Flag-FOXO1 or not, and in presence or absence of HTTQ71GFP. All data were normalized to GAPDH as reference and were corrected to EV. (C) Representative immunofluorescence pictures detecting p-bodies (using DDX6 antibodies). HEK293T cells expressing HTTQ25GFP (Left panel) or HTTQ71GFP (Right panel) with and without Flag-FOXO1 (lower and upper row) were stained with a DDX6 antibody (red). Nucleus stained with Hoechst (blue). (D) Graph depicting quantification of the number of p-bodies per cell of cells treated as in C. (E) Graph depicting p-bodies intensity of cells treated as in C. (D and E) Mean and SEM of three independent experiments are shown. P-values were derived from two-tailed Student’s t test. (F) Filter trap analysis of cells expressing HTTQ71GFP, Flag-FOXO1 (or not) after knock down of STAU1, IGF2BP3 or DDX18 using CRISPRi. Lower panel depicts a filter trap probed with GFP antibodies. Upper panel depicts the graph with the mean and SEM of three independent experiments. (G) qPCR analysis of cells treated as in F. Relative quantification of HTTCAG71GFP mRNA expression normalized to GAPDH and corrected to EV. P-values were derived from 1 way analysis of variance with the Bonferroni correction. *P < 0.05; **P < 0.001; ***P < 0.0001

Similar articles

Cited by

References

    1. Kuiper, E.F.E., de Mattos, E.P., Jardim, L.B. et al. (2017) Chaperones in polyglutamine aggregation: beyond the Q-stretch. Front. Neurosci., 11, 45. - PMC - PubMed
    1. Lieberman, A.P., Shakkottai, V.G. and Albin, R.L. (2019) Polyglutamine repeats in neurodegenerative diseases. Annu. Rev. Pathol. Mech. Dis., 14, 1–27. - PMC - PubMed
    1. Balch, W.E., Morimoto, R.I., Dillin, A. et al. (2008) Adapting proteostasis for disease intervention. Science (80-.)., 319, 916–919. - PubMed
    1. Kampinga, H.H. and Bergink, S. (2016) Heat shock proteins as potential targets for protective strategies in neurodegeneration. Lancet Neurol., 15, 748–759. - PubMed
    1. Weber, J.J., Sowa, A.S., Binder, T. et al. (2014) From pathways to targets: understanding the mechanisms behind polyglutamine disease. From pathways to targets: understanding the mechanisms behind polyglutamine disease. Biomed. Res. Int., 2014, 701758. - PMC - PubMed

Publication types

MeSH terms