

Improved postprandial glucose metabolism in type 2 diabetes by the dual glucagon-like peptide-1/glucagon receptor agonist SAR425899 in comparison with liraglutide
- PMID: 33822469
- PMCID: PMC8359969
- DOI: 10.1111/dom.14394
Improved postprandial glucose metabolism in type 2 diabetes by the dual glucagon-like peptide-1/glucagon receptor agonist SAR425899 in comparison with liraglutide
Abstract
Aim: To gain further insights into the efficacy of SAR425899, a dual glucagon-like peptide-1/glucagon receptor agonist, by providing direct comparison with the glucagon-like peptide-1 receptor agonist, liraglutide, in terms of key outcomes of glucose metabolism.
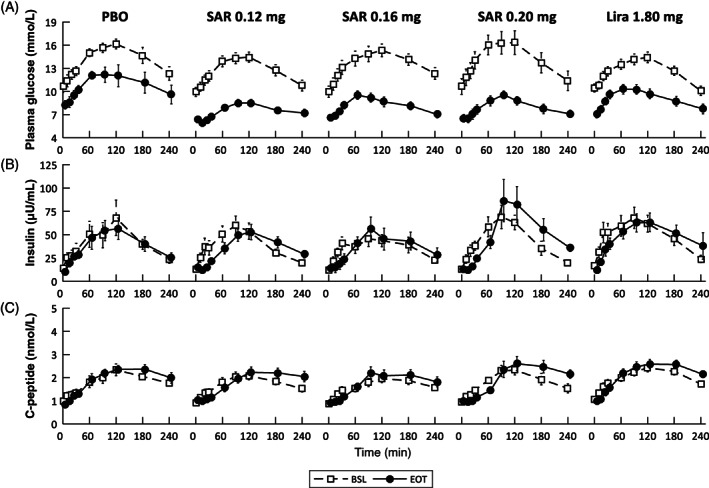
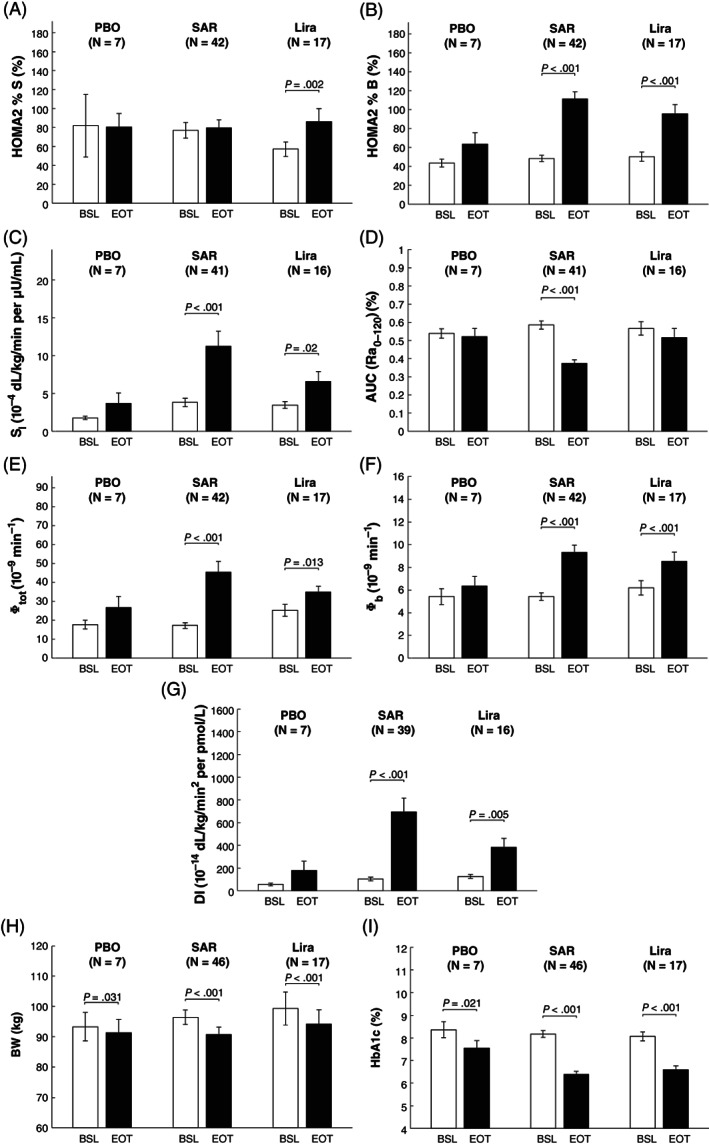
Research design and methods: Seventy overweight to obese subjects with type 2 diabetes (T2D) were randomized to receive once-daily subcutaneous administrations of SAR425899 (0.12, 0.16 or 0.20 mg), liraglutide (1.80 mg) or placebo for 26 weeks. Mixed meal tolerance tests were conducted at baseline (BSL) and at the end of treatment (EOT). Metabolic indices of insulin action and secretion were assessed via Homeostasis Model Assessment (HOMA2) and oral minimal model (OMM) methods.
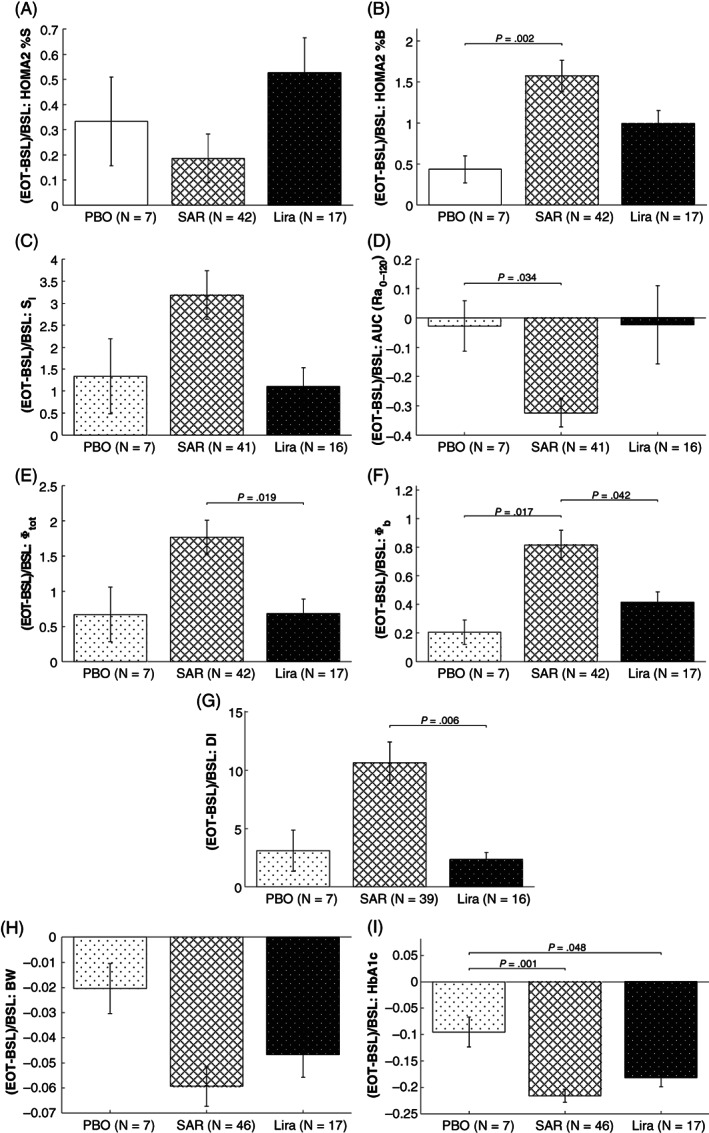
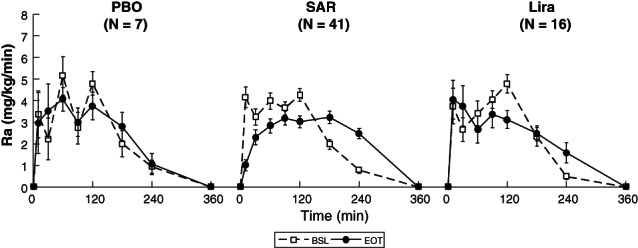
Results: From BSL to EOT (median [25th, 75th] percentile), HOMA2 quantified a significant improvement in basal insulin action in liraglutide (35% [21%, 74%]), while secretion enhanced both in SAR425899 (125% [63%, 228%]) and liraglutide (73% [43%, 147%]). OMM quantified, both in SAR425899 and liraglutide, a significant improvement in insulin sensitivity (203% [58%, 440%] and 36% [21%, 197%]), basal beta-cell responsiveness (67% [34%, 112%] and 40% [16%, 59%]), and above-basal beta-cell responsiveness (139% [64%, 261%] and 69% [-15%, 120%]). A significant delay in glucose absorption was highlighted in SAR425899 (37% [52%,18%]).
Conclusions: SAR425899 and liraglutide improved postprandial glucose control in overweight to obese subjects with T2D. A significantly higher enhancement in beta-cell function was shown by SAR425899 than liraglutide.
Trial registration: ClinicalTrials.gov NCT02973321.
Keywords: beta-cell function; disposition index; dual agonist; glucagon; glucagon-like peptide-1; insulin sensitivity; liraglutide; mixed meal tolerance test; oral minimal model.
© 2021 The Authors. Diabetes, Obesity and Metabolism published by John Wiley & Sons Ltd.
Conflict of interest statement
BG, TK and MR are Sanofi employees. No other potential conflicts of interest relevant to this article are reported.
Figures
References
-
- Holt RIG, Cockram CS, Flyvbjerg A, Goldstein BJ. Textbook of Diabetes. 4th ed.Oxford, UK: Blackwell Publishing Ltd; 2010.
-
- Stumvoll M, Goldstein BJ, van Haeften TW. Type 2 diabetes: principles of pathogenesis and therapy. Lancet. 2005;9467:1333‐1346. - PubMed
-
- Wild S, Roglic G, Green A, Sicree R, King H. Global prevalence of diabetes: estimates for the year 2000 and projections for 2030. Diabetes Care. 2004;27:1047‐1053. - PubMed
-
- Hossain P, Kawar B, El Nahas M. Obesity and diabetes in the developing world – a growing challenge. N Engl J Med. 2007;356:213‐215. - PubMed
-
- Ma R, Chan J. Metabolic complications of obesity. In: Williams G, Fruhbeck G, eds. Obesity: Science to Practice. John Wiley & Sons Ltd; 2009:235‐270.
Publication types
MeSH terms
Substances
Associated data
Grants and funding
LinkOut - more resources
Full Text Sources
Other Literature Sources
Medical
