. 2021 May 17;131(10):e145546.
doi: 10.1172/JCI145546.

FGF21 is required for the metabolic benefits of IKKε/TBK1 inhibition

Affiliations

FGF21 is required for the metabolic benefits of IKKε/TBK1 inhibition

Shannon M Reilly et al. J Clin Invest. .

Abstract

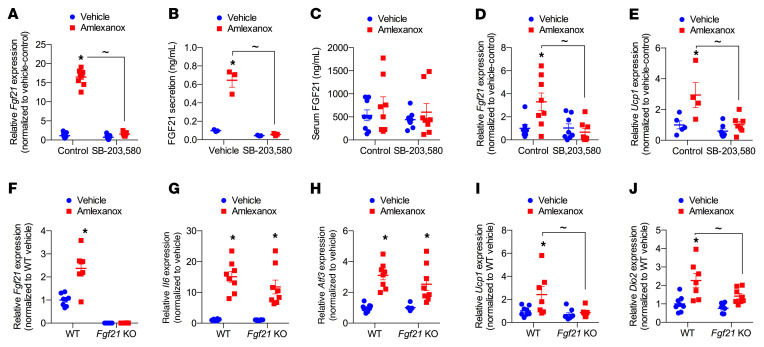
The protein kinases IKKε and TBK1 are activated in liver and fat in mouse models of obesity. We have previously demonstrated that treatment with the IKKε/TBK1 inhibitor amlexanox produces weight loss and relieves insulin resistance in obese animals and patients. While amlexanox treatment caused a transient reduction in food intake, long-term weight loss was attributable to increased energy expenditure via FGF21-dependent beiging of white adipose tissue (WAT). Amlexanox increased FGF21 synthesis and secretion in several tissues. Interestingly, although hepatic secretion determined circulating levels, it was dispensable for regulating energy expenditure. In contrast, adipocyte-secreted FGF21 may have acted as an autocrine factor that led to adipose tissue browning and weight loss in obese mice. Moreover, increased energy expenditure was an important determinant of improved insulin sensitivity by amlexanox. Conversely, the immediate reductions in fasting blood glucose observed with acute amlexanox treatment were mediated by the suppression of hepatic glucose production via activation of STAT3 by adipocyte-secreted IL-6. These findings demonstrate that amlexanox improved metabolic health via FGF21 action in adipocytes to increase energy expenditure via WAT beiging and that adipocyte-derived IL-6 has an endocrine role in decreasing gluconeogenesis via hepatic STAT3 activation, thereby producing a coordinated improvement in metabolic parameters.

Keywords: Adipose tissue; Diabetes; Metabolism; Obesity.


Conflict of interest statement

Conflict of interest: ARS is a founder of Elgia Therapeutics and is a named inventor on the following patents related to amlexanox: US Patent 8,946,424, “Deuterated amlexanox” and US Patent 10,245,255, “Composition and methods for the treatment of obesity and related disorders.”

Figures

Figure 1
Figure 1. Amlexanox transiently reduces food intake.
(A) Weekly body weights of obese mice treated with 25 mg/kg amlexanox or vehicle control. n = 7 vehicle-treated mice and n = 8 amlexanox-treated mice. (BF) Metabolic cage experiment. n = 8 animals per treatment group. Vertical lines indicate treatment initiation and, in B and D, the time of daily treatment administration administration (day –1 vehicle control was administered to all). The dark cycle (6 pm to 6 am) is indicated in B and D by gray shading. (B) Oxygen consumption rate (VO2). (C) Average oxygen consumption rate during the light or dark cycle. (D) Carbon dioxide production rate (VCO2). (E) Average carbon dioxide production rate during the light or dark cycle. (F) Daily food intake. (G) Food intake 24–48 hours after treatment initiation for obese Il6-KO mice and littermate WT controls. WT versus Il6-KO values within treatment groups were not significantly different. n = 5 animals per genotype in each treatment group. (HK) Daily food intake and body weights of obese mice treated with 25 mg/kg amlexanox or vehicle control. n = 9 vehicle-treated mice and n = 10 amlexanox-treated mice. (H) Body weight–normalized food intake. (I) Total food intake per mouse. (J) Body weight. (K) Body weight as a percentage of baseline body weight. *P < 0.05, by Holm-Šidák post hoc test after significant 2-way ANOVA. #P < 0.05, by Student’s t test, not corrected for multiple comparisons. Data are presented as the mean ± SEM.
Figure 2
Figure 2. Amlexanox increases energy expenditure relative to pair-fed vehicle controls.
Metabolic cage experiment in mice treated with amlexanox and pair-fed vehicle controls. Vertical lines indicate treatment administration. n = 6 animals per treatment group. (A) Food intake. (B) Z-axis activity. (C) Total z-axis activity during the dark cycle. (D) X axis ambulatory activity. (E) Total x-axis ambulatory activity during each light or dark cycle. (F) Oxygen consumption rate. (G) Carbon dioxide production rate. (H) Average oxygen consumption rate during the light or dark cycle. (I) Average carbon dioxide production rate during the light or dark cycle. (J) Body weights before and after the pair-fed metabolic cage experiment. (K) Tissue weights after the pair-fed metabolic cage experiment. *P < 0.05, by Holm-Šidák post hoc test after significant 2-way ANOVA; #P < 0.05, by Student’s t test, not corrected for multiple comparisons. Data are presented as the mean ± SEM.
Figure 3
Figure 3. FGF21 is required for adipose tissue beiging and weight loss in response to amlexanox.
(A) Weekly body weights of obese Ucp1-KO mice and WT littermates treated with 25 mg/kg amlexanox by daily oral gavage, expressed as a percentage of baseline body weight. n = 6 animals per genotype in each treatment group. (BH) Obese Fgf21-KO and WT littermates were treated with 25 mg/kg amlexanox by daily oral gavage. (B) Body weight expressed as a percentage of baseline body weight. n = 5 WT and 6 KO animals per treatment group. (C) Body weight–normalized food intake for the mice in B. (D) Oxygen consumption and (E) carbon dioxide production rates measured by metabolic cages for the mice in B, starting on day 11 of treatment. (F) Ucp1 expression in iWAT after 4 weeks of treatment. n = 6 animals per genotype in each treatment group. veh, vehicle. (G) Dio2 expression in iWAT after 4 weeks of treatment. n = 5 animals per genotype in each treatment group. (H) Representative H&E-stained sections after 4 weeks of treatment. Scale bars: 100 μm (iWAT), 100 μm (eWAT), and 50 μm (BAT). Statistical significance was determined by Holm-Šidák post hoc test after significant 2-way ANOVA. *P < 0.05 for vehicle versus amlexanox treatment. #P < 0.05 for vehicle versus amlexanox in both WT and KO mice. ~P < 0.05 for WT versus KO mice in the amlexanox-treated group. Data are presented as the mean ± SEM.
Figure 4
Figure 4. Amlexanox increases thermogenesis.
(AD) Obese mice were treated with 25 mg/kg amlexanox or vehicle control daily. Amlexanox- and vehicle-treated animals were fed ad libitum, whereas pair-fed, vehicle-treated animals were provided the averaged amount of food consumed by the amlexanox-treated group. n = 6–7 mice per treatment group. (A) Food intake, (B) body weight, and (C) rectal temperatures (temp) were measured daily 5 hours into the light cycle, just before daily treatment administration. (D) Total fat and lean mass measured by MRI after 26 days of treatment. (E) Rectal temperatures of obese WT and Fgf21-KO mice treated with 25 mg/kg amlexanox and of pair-fed, vehicle-treated controls after 24 hours of treatment. Statistical significance was determined by Holm-Šidák post hoc test after significant 2-way ANOVA. *P < 0.05 for vehicle- versus amlexanox-treated mice. ~P < 0.05 for amlexanox- versus pair-fed, vehicle-treated mice (AD) and WT versus KO mice in the amlexanox-treated group (E). #P < 0.05 for vehicle- versus pair-fed, vehicle-treated groups. Data are presented as the mean ± SEM.
Figure 5
Figure 5. Hepatic FGF21 secretion determines circulating FGF21 levels but not beiging of WAT.
(A) Serum FGF21 levels after treatment with 25 mg/kg amlexanox or vehicle control. n = 2 animals per treatment per time point. (B and C) Amlexanox induced Fgf21 expression in various tissues relative to vehicle control treatment. (B) Fgf21 expression after 4 hours of treatment. n = 7 animals per treatment group. (C) Fgf21 expression after 24 hours of treatment. n = 5 animals per treatment. (DI) FLKO and WT littermate control animals were treated with 25 mg/kg amlexanox or vehicle. (D) Serum FGF21 levels after 24 hours of treatment. n = 3 vehicle-treated and n = 4 amlexanox-treated animals per genotype. (E) Serum IL-6 levels after 24 hours of treatment. n = 3 animals per genotype per treatment. (F) Weight as a percentage of baseline body weight. n = 8 WT and n = 6 FLKO animals per treatment. (G) Serum insulin levels after 4 weeks of treatment. n = 8 WT and n = 6 FLKO animals per treatment. Expression of (H) Ucp1 and (I) Dio2 in eWAT tissue after 5 weeks of treatment. n = 6 animals per genotype per treatment. *P < 0.05, by Holm-Šidák post hoc test after significant 2-way ANOVA for the vehicle- versus amlexanox-treated groups. §P < 0.05, by Holm-Šidák post hoc test after significant 2-way ANOVA for the vehicle- versus amlexanox-treated in both WT and KO groups. ~P < 0.05 for WT versus KO animals in the amlexanox-treated group. #P < 0.05, by Student’s t test, not corrected for multiple comparisons. Data are presented as the mean ± SEM.
Figure 6
Figure 6. Adipocyte-secreted FGF21 promotes adipocyte Ucp1 expression.
(A and B) PPDIVs were treated with 1 mg/mL SB-203,850 or control for 30 minutes before vehicle or 100 μM amlexanox treatment. (A) Fgf21 expression after a 2-hour treatment. n = 9 wells per condition. (B) FGF21 secretion into the media after a 4-hour treatment. n = 3 wells per condition. (CE) Obese mice were pretreated with 20 mg/kg SB-203,850 or control for 30 minutes before treatment with vehicle or 25 mg/kg amlexanox for 4 hours. n = 8 mice per treatment condition. (C) FGF21 serum levels. (D) Fgf21 expression in iWAT. (E) Ucp1 expression in iWAT. Expression of (F) Fgf21, (G) Il6, (H) Atf3, (I) Ucp1, and (J) Dio2 in Fgf21-KO and WT control PPDIVs treated with vehicle or 100 μM amlexanox for 4 hours. *P < 0.05, by Holm-Šidák post hoc test after significant 2-way ANOVA for vehicle versus amlexanox treatment. ~P < 0.05 for WT versus KO or control versus SB-203,850 in the amlexanox-treated group. Data are presented as the mean ± SEM.
Figure 7
Figure 7. Effects of amlexanox in adipose- and liver-specific Fgf21–KO mice.
(AD) Obese FAKO and WT littermate control animals were treated with 25 mg/kg amlexanox or vehicle. n = 8 vehicle- and n = 7 amlexanox-treated animals per genotype. (A) Serum FGF21 levels. (B) Ucp1 expression in iWAT. (C) Dio2 expression in iWAT. (D) Weight loss, presented as a percentage of baseline body weight. (EH) Quantification of FGF21 protein levels normalized to HSP90 protein detected by Western blotting 24 hours after treatment (see also Supplemental Figure 4). (E) FGF21 levels in WT iWAT. (F) FGF21 levels in WT liver. (G) FGF21 levels in WT and FLKO iWAT. (H) FGF21 levels in WT and FLKO eWAT. n = 3 animals per treatment per genotype. *P < 0.05, by Holm-Šidák post hoc test after significant 2-way ANOVA for the vehicle- versus amlexanox-treated groups. ~P < 0.05 for WT versus KO animals in the amlexanox-treated group. Data are presented as the mean ± SEM
Figure 8
Figure 8. Mechanism of improved glucose handling and insulin sensitivity.
(A) Day 3 fasting blood glucose levels in obese Il6-KO and WT littermate control mice. n = 5 animals per treatment per genotype. (BF, H, and I) Obese SLKO and WT mice. (B) Day 3 weight loss. n = 10 vehicle-treated mice and n = 9 amlexanox-treated mice per genotype. (C) Day 3 fasting blood glucose levels. n = 6 vehicle-treated WT mice, n = 7 amlexanox-treated WT mice, n = 11 vehicle-treated SLKO mice, and n = 12 amlexanox-treated SLKO mice. Day 3 liver expression of (D) Socs3 and (E) G6pc. n = 5 animals per genotype per treatment. (F) Pyruvate tolerance test after 3 days of treatment. n = 6 vehicle-treated WT mice, n = 7 amlexanox-treated WT mice, n = 11 vehicle-treated SLKO mice, and n = 12 amlexanox-treated SLKO mice. (G) Day 3 fasting blood glucose levels in obese FAKO and WT littermate control animals. n = 9 vehicle-treated mice and n = 8 amlexanox-treated mice per genotype. (H) Insulin tolerance test after 4 weeks of treatment. n = 8 vehicle-treated mice and n = 7 amlexanox-treated mice per genotype. (I) Weight loss after 4 weeks of treatment. n = 9 mice per treatment per genotype. (J and K) Fasting serum insulin levels in obese mice after 4 weeks of treatment. (J) Serum insulin levels in WT and Fgf21-KO mice. n = 9 WT mice per treatment, n = 8 vehicle-treated Fgf21-KO mice, and n = 6 amlexanox-treated Fgf21-KO mice. (K) Serum insulin levels in WT and Ucp1-KO mice. n = 6 mice per treatment per genotype. (L) Insulin tolerance test after 4 weeks of treatment in obese Fgf21-KO and WT littermate control mice. n = 10 vehicle-treated mice per genotype, n = 9 WT mice, and n = 8 amlexanox-treated Fgf21-KO mice. (M) Insulin tolerance test after 4 weeks of treatment in obese Ucp1-KO and WT littermate control mice. n = 10 vehicle-treated mice per genotype, n = 9 WT mice, and n = 8 amlexanox-treated Ucp1-KO mice. *P < 0.05, by Holm-Šidák post hoc test after significant 2-way ANOVA for the vehicle versus amlexanox treatment groups. #P < 0.05, by Holm-Šidák post hoc test after significant 2-way ANOVA for vehicle versus amlexanox treatment in both the WT and KO groups. ~P < 0.05, by Holm-Šidák post hoc test after significant 2-way ANOVA for WT versus KO animals within the amlexanox treatment group. Data are presented as the mean ± SEM.

References

    1. James PT, et al. The worldwide obesity epidemic. Obes Res. 2001;9(Suppl 4):228S–233S. - PubMed
    1. No authors listed. Obesity: preventing and managing the global epidemic. Report of a WHO consultation. World Health Organ Tech Rep Ser. 2000;894:1–253. - PubMed
    1. Swinburn BA, et al. The global obesity pandemic: shaped by global drivers and local environments. Lancet. 2011;378(9793):804–814. doi: 10.1016/S0140-6736(11)60813-1. - DOI - PubMed
    1. Knowler WC, et al. Diabetes mellitus in the Pima Indians: incidence, risk factors and pathogenesis. Diabetes Metab Rev. 1990;6(1):1–27. doi: 10.1002/dmr.5610060101. - DOI - PubMed
    1. Zimmet P. Epidemiology of diabetes and its macrovascular manifestations in Pacific populations: the medical effects of social progress. Diabetes Care. 1979;2(2):144–153. doi: 10.2337/diacare.2.2.144. - DOI - PubMed

Publication types

MeSH terms

LinkOut - more resources