. 2021 Jun 7;218(6):e20210313.
doi: 10.1084/jem.20210313.

An APP ectodomain mutation outside of the Aβ domain promotes Aβ production in vitro and deposition in vivo

Affiliations

An APP ectodomain mutation outside of the Aβ domain promotes Aβ production in vitro and deposition in vivo

Xulun Zhang et al. J Exp Med. .

Abstract

Familial Alzheimer's disease (FAD)-linked mutations in the APP gene occur either within the Aβ-coding region or immediately proximal and are located in exons 16 and 17, which encode Aβ peptides. We have identified an extremely rare, partially penetrant, single nucleotide variant (SNV), rs145081708, in APP that corresponds to a Ser198Pro substitution in exon 5. We now report that in stably transfected cells, expression of APP harboring the S198P mutation (APPS198P) leads to elevated production of Aβ peptides by an unconventional mechanism in which the folding and exit of APPS198P from the endoplasmic reticulum is accelerated. More importantly, coexpression of APP S198P and the FAD-linked PS1ΔE9 variant in the brains of male and female transgenic mice leads to elevated steady-state Aβ peptide levels and acceleration of Aβ deposition compared with age- and gender-matched mice expressing APP and PS1ΔE9. This is the first AD-linked mutation in APP present outside of exons 16 and 17 that enhances Aβ production and deposition.


Conflict of interest statement

Disclosures: The authors declare no competing interests exist.

Figures
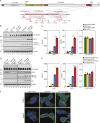
Figure 1.
Figure 1.
Impact of S198P on Aβ production in HEK293 cells. (A) Domain organization of APP-770, positions of FAD-linked mutations and Serine 198. Shown are the domains of APP and positions of the FAD-linked mutations in exons 16 and 17. The S198 mutation is in the linker between the E1 domain and acidic-rich domain. (B and D) Western blot analysis of full-length APP and APP CTFs in cell lysates and soluble APP and Aβ in CM of the HEK293 cell pools (B) and cell lines (D) stably expressing WT APP, WT APP695/S198P, APP695Swe, and APP695Swe/S198P, and the lysates and CM were prepared from triplicate wells of culture plates. Equal amounts of cell lysates and normalized volumes of CM based on the protein concentrations of the cell lysates were used for the analysis. Small arrows in vector transfected cells (B) indicate the migration of endogenous full-length APP. (C and E) MSD analysis of Aβ levels in the CM of the stable cell pools (C) and cell lines (E). Levels of Aβ species were normalized to the protein concentrations of the cell lysates. The results are represented by mean ± SEM, and the error bars represent SEM, n = 3. One-way ANOVA with a Tukey’s multiple comparisons post hoc test was used to establish statistical significance. *, P < 0.05; **, P < 0.005; ****, P < 0.0001. (F) Subcellular distribution of β-CTF in APPSwe no. 12 and APPSwe/S198P no. 1 cells. Immunofluorescence images of 3D6-immunoreactive β-CTF (green) and colabeled Golgi-specific GM130 (red). DAPI is in blue. Each column contains two images acquired from different fields (top and bottom) of the same dish. KPI, Kunitz protease inhibitor.
Figure 2.
Figure 2.
Pulse-chase analysis of HEK293 cells stably expressing APP695Swe and APP695Swe/S198P. (A) Pulse-chase analysis of HEK293 cell lines APPSwe no. 12 (Swe) and APPSwe/S198P no. 1 (Swe/S198P). Following pulse-labeling and chase or 4-h continuous labeling, APP metabolites immunoprecipitated with CTM1 antibody from cell lysates and with P2-1 antibody from CM were resolved on a Tris-Tricine gel (top and middle) and an SDS-PAGE (bottom), respectively. Black arrows indicate early secretion of SAPPβ from APPSwe/S198P cells. (B and C) Immunoprecipitated Aβ and P3 from the CM of 4-h continuously labeled cells. (D) Pulse-chase analysis of HEK293 cell lines APP695Swe no. 12 (Swe) and APP695Swe/S198P no. 1 (Swe/S198P) with a 5-min pulse and chase. CTM1-immunoprecipitated (IP) APP metabolites from cell lysates were resolved on Tris-Tricine gels under both reducing and nonreducing conditions. In the nonreducing panel, the brackets mark heterogeneous, mature full-length APP that represents transient folding intermediates, and the black arrows indicate elevated mature APPSwe/S198P species; in the reducing panel, the black arrows indicate mature full-length APPSwe/S198P. (E) Pulse-chase analysis of HEK293 stable pools expressing APP695Swe (Swe) and APP695Swe/S198P (Swe/S198P) with a 5-min pulse and chase. CTM1-immunoprecipitated APP metabolites from cell lysates were resolved on Tris-Tricine gels under both reducing and nonreducing conditions. The red arrowheads represent mature, full-length APP695Swe/S198P in the presence of reducing reagent, while the red brackets represent heterogeneous species under nonreducing conditions that are present in APPswe/S198P pools and represent transient folding intermediates. Green arrowheads indicate immature form of APP695Swe and APP695Swe/S198P, and the black arrow indicates the endogenous APP. imm, immature; mat, mature.
Figure 3.
Figure 3.
Analysis of the metabolism of APPSwe and APPSwe/S198P with a sulfhydryl, confirmation-specific antibody, mAbP2-1. (A) Validation of P2-1 antibody specificity in extracts from stably transfected cells and transgenic brain. Cell lysates of HEK293 cell pools stably expressing either APPSwe (lanes 1 and 5) or APPSwe/S198P (lanes 2 and 6), and brain lysates of transgenic mice expressing a chimeric mouse/human APPswe (lanes 3 and 7) or APPswe/S198P (lanes 4 and 8) were subject to reducing conditions with β-ME (lanes 1–4) or not (lanes 5–8) before electrophoresis. Upper two panels: P2-1 Western blots; lower two panels: 22C11 Western blots. P2-1 only recognizes nonreduced human APPSwe or APPSwe/S198P. (B) P2-1 immunoprecipitates (IP) from lysates of the stable cell lines APPSwe no. 12 (lanes 1–7) and APPswe/S198P no. 1 (lanes 8–14) pulse-labeled for 5 min and chased. The black arrow in lane 9 indicates the early-appearing, correctly folded, and mature full-length APPSwe/S198P. (C) Pulse-chase analysis of HEK293 cell pools stably expressing APP695Swe (Swe) and APP695Swe/S198P (Swe/S198P) and immunoprecipitation with P2-1. Black arrow indicates endogenous immature APP; green arrow indicates immature APPSwe and APPSwe/S198P; red arrowheads indicate immature, folded full-length APP695Swe/S198P that appears early in the chase period. Ab, antibody; BME, β-mercaptoethanol.
Figure 4.
Figure 4.
Expression, purification, and CD spectroscopy, and DSF assays of sAPP695α and sAPP695α/S198P fragments. (A) Ammonium sulfate fractionation of sAPP695α and sAPP695α/S198P fragments from CM. (B) Purification of soluble APP fragments by DEAE chromatography. (C) Purification of soluble APP fragments by Ni-NTA affinity resin. (D) Silver staining of purified soluble APP fragments. (E) CD spectra of purified sAPP695α and sAPP695α/S198P; the spectra of both purified fragments completely coincided. (F) DSF assay of purified sAPP695α and sAPP695α/S198P; both fragments showed the same thermostability. sup, supernatant.
Figure 5.
Figure 5.
Characterization of APP695Swe/S198P transgenic mice. (A) Western blotting analysis of brain lysates from APP695Swe and APP695Swe/S198P transgenic lines. ceAPPSwe/PS1ΔE9 was used as positive control, and nontransgenic littermate of line 15214 was used as negative control. Human APP-specific antibody 6E10 revealed high-level expression of APP695Swe/S198P in lines 15219 and 15222. (B and C) Immunoprecipitation (IP)–Western blotting (WB) analysis and density quantification with ImageJ software of the expression levels of APP695Swe/S198P (line 19) and APPSwe in ceAPPSwe/PS1ΔE9 transgenic mice. Both sets of immunoprecipitation–Western blotting were used for density quantification, and the results were represented by mean ± SEM, with the error bars representing SEM. F, female; M, male.
Figure 6.
Figure 6.
Western blotting analysis of APP processing and Aβ production in brain lysates of 4-mo-old, 6-mo-old, and 9-mo-old transgenic mice. (A–F) TBS-soluble, detergent-soluble, and FA-soluble fractions of brain lysates were subject to Western blot analysis, PS1ΔE9 animals were used as negative controls of exogenous APP expression, APP695Swe/S198P animals were used as negative controls of PS1ΔE9 expression, and ceAPPSwe/PS1ΔE9 animals were used as positive controls of APP processing and Aβ production. 4-mo-old animals (A and B), 6-mo-old animals (C and D), and 9-mo-old animals (E and F). Ab, antibody; FL, full-length.
Figure 7.
Figure 7.
Quantification of TBS-soluble and FA-soluble Aβ by MSD and amyloid burden analysis in the brains of 4-mo-old, 6-mo-old, and 9-mo-old PS1ΔE9, APP695Swe/S198P, APP695Swe/S198P/PS1ΔE9, and ceAPPSwe/PS1ΔE9 mice. (A) Quantification of TBS-soluble and FA-soluble Aβ in the brain lysates of PS1ΔE9, APP695Swe/S198P, APP695Swe/S198P/PS1ΔE9, and ceAPPSwe/PS1ΔE9 mice. The levels of Aβ were normalized to the expression levels of full-length APP695Swe/S198P in APP695Swe/S198P/PS1ΔE9 mice and full-length APPSwe in ceAPPSwe/PS1ΔE9 mice. The results are represented by mean ± SEM, and the error bars represent SEM, n = 6 animals. Two-way ANOVA with a two-stage linear step-up procedure of Benjamini, Krieger, and Yekutieli multiple comparisons post hoc tests was used to establish statistical significance. *, P < 0.05; **, P < 0.01; ***, P < 0.001. (B) Immunohistochemistry staining of amyloid plaques with Aβ 1–5-specific mAb3D6 in coronal brain sections of PS1ΔE9, APP695Swe/S198P, APP695Swe/S198P/PS1ΔE9, and ceAPPSwe/PS1ΔE9 mice. No amyloid plaques were detected on the sections of PS1ΔE9 and APP695Swe/S198P animals regardless of age (left two columns). Elevated level of amyloid plaques was detected on the sections of APP695Swe/S198P/PS1ΔE9 mice compared with that on the sections of age-matching ceAPPSwe/PS1ΔE9 mice. Scale bar, 1,000 µm. (C) Quantification of amyloid burden in APP695Swe/S198P/PS1ΔE9 and ceAPPSwe/PS1ΔE9 mice. Amyloid plaques on the brain sections of APP695Swe/S198P/PS1ΔE9 and ceAPPSwe/PS1ΔE9 animals stained with 3D6 were quantified with Fiji (ImageJ) software, and the results are represented by mean ± SEM, with the error bars representing SEM, n = 5 animals. Two-way ANOVA with a two-stage linear step-up procedure of Benjamini, Krieger, and Yekutieli multiple comparisons post hoc tests was used to establish statistical significance. *, P < 0.05; **, P < 0.01; ****, P < 0.0001. (D) Analysis of plaque size on the sections stained with 3D6. The results are represented by mean ± SEM, with the error bars representing SEM, n = 5 animals. Two-way ANOVA with a Tukey’s multiple comparisons post hoc test was used to establish statistical significance. *, P < 0.05; **, P < 0.01; ***, P < 0.001.
Figure 8.
Figure 8.
Immunohistochemistry staining of brains sections of APP695Swe/S198P/PS1ΔE9 and ceAPPSwe/PS1ΔE9 mice. (A) Brain sections were costained with anti-Iba1 (red), 3D6 (green), and DAPI (blue). (B) Brain sections were costained with 3D6 (red) and Thioflavin S. (C) Brain sections were costained with 3D6 (red) and Methoxy-X04 (blue). Scale bar, 20 µm.

Comment in

  • Alzheimer mutant speeds APP transport.
    Gandy S, Ehrlich ME. Gandy S, et al. J Exp Med. 2021 Jun 7;218(6):e20210511. doi: 10.1084/jem.20210511. Epub 2021 May 14. J Exp Med. 2021. PMID: 33988687 Free PMC article.

References

    1. Ahmed, Z., Shaw G., Sharma V.P., Yang C., McGowan E., and Dickson D.W.. 2007. Actin-binding proteins coronin-1a and IBA-1 are effective microglial markers for immunohistochemistry. J. Histochem. Cytochem. 55:687–700. 10.1369/jhc.6A7156.2007 - DOI - PubMed
    1. Bacskai, B.J., Kajdasz S.T., Christie R.H., Carter C., Games D., Seubert P., Schenk D., and Hyman B.T.. 2001. Imaging of amyloid-beta deposits in brains of living mice permits direct observation of clearance of plaques with immunotherapy. Nat. Med. 7:369–372. 10.1038/85525 - DOI - PubMed
    1. Baghallab, I., Reyes-Ruiz J.M., Abulnaja K., Huwait E., and Glabe C.. 2018. Epitomic Characterization of the Specificity of the Anti-Amyloid Aβ Monoclonal Antibodies 6E10 and 4G8. J. Alzheimers Dis. 66:1235–1244. 10.3233/JAD-180582 - DOI - PMC - PubMed
    1. Beecham, G.W., Bis J.C., Martin E.R., Choi S.H., DeStefano A.L., van Duijn C.M., Fornage M., Gabriel S.B., Koboldt D.C., Larson D.E., et al. . 2017. The Alzheimer’s Disease Sequencing Project: Study design and sample selection. Neurol. Genet. 3:e194. 10.1212/NXG.0000000000000194 - DOI - PMC - PubMed
    1. Blacker, D., Haines J.L., Rodes L., Terwedow H., Go R.C., Harrell L.E., Perry R.T., Bassett S.S., Chase G., Meyers D., et al. . 1997. ApoE-4 and age at onset of Alzheimer’s disease: the NIMH genetics initiative. Neurology. 48:139–147. 10.1212/WNL.48.1.139 - DOI - PubMed

Publication types

Substances