. 2021 Jun 7;218(6):e20202530.
doi: 10.1084/jem.20202530.

Blood leukocytes recapitulate diabetogenic peptide-MHC-II complexes displayed in the pancreatic islets

Affiliations

Blood leukocytes recapitulate diabetogenic peptide-MHC-II complexes displayed in the pancreatic islets

Anthony N Vomund et al. J Exp Med. .

Abstract

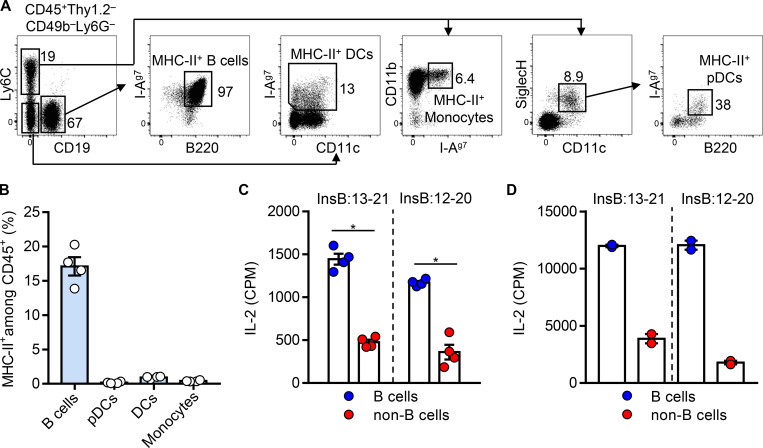
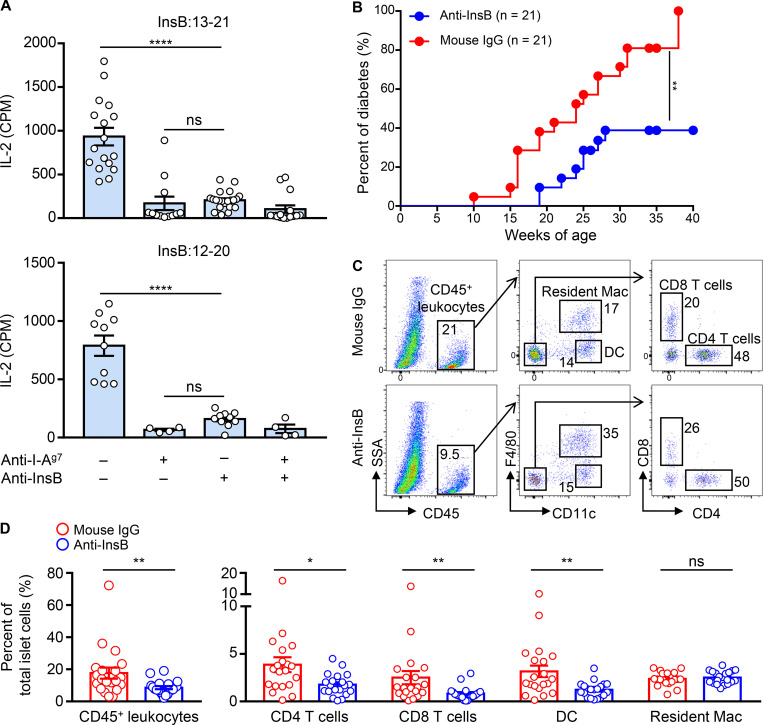
Assessing the self-peptides presented by susceptible major histocompatibility complex (MHC) molecules is crucial for evaluating the pathogenesis and therapeutics of tissue-specific autoimmune diseases. However, direct examination of such MHC-bound peptides displayed in the target organ remains largely impractical. Here, we demonstrate that the blood leukocytes from the nonobese diabetic (NOD) mice presented peptide epitopes to autoreactive CD4 T cells. These peptides were bound to the autoimmune class II MHC molecule (MHC-II) I-Ag7 and originated from insulin B-chain and C-peptide. The presentation required a glucose challenge, which stimulated the release of the insulin peptides from the pancreatic islets. The circulating leukocytes, especially the B cells, promptly captured and presented these peptides. Mass spectrometry analysis of the leukocyte MHC-II peptidome revealed a series of β cell-derived peptides, with identical sequences to those previously identified in the islet MHC-II peptidome. Thus, the blood leukocyte peptidome echoes that found in islets and serves to identify immunogenic peptides in an otherwise inaccessible tissue.


Conflict of interest statement

Disclosures: The authors declare no competing interests exist.

Figures

Figure 1.
Figure 1.
Spontaneous presentation of immunogenic insulin epitopes by blood leukocytes. (A–C) Blood leukocytes were obtained from NOD mice with or without a prior glucose challenge and were directly cultured with CD4 T cell hybridomas with defined specificities to InsB:13-21 (A), InsB:12-20 (B), and Ins1C:51-61 (C). IL-2 production from the culture supernatants was measured to indicate the T cell responses. The dependence of MHC-II was determined by adding the anti–I-Ag7 blocking antibody to the culture. (D) Responses of T cell hybridomas with indicated antigen specificities to blood leukocytes obtained from B6, B6g7, or NOD mice. (E) Responses of the InsB:13-21– and InsB:12-20–specific CD4 T cells to blood leukocytes obtained from NOD mice at the indicated time points after the glucose challenge. (F) Responses of the InsB:13-21– (top) and InsB:12-20– (bottom) specific CD4 T cells to blood leukocytes obtained from NOD mice with or without injection of the insulin receptor blocker S961, followed by glucose challenge. Data (mean ± SEM) summarize results pooled from 2 (D–F), 4 (C), 12 (B), and 28 (A) independent experiments; each point (A–D and F) represents one biological replicate including one to six mice. *, P < 0.05; **, P < 0.01; ***, P < 0.005; ****, P < 0.001; Mann–Whitney test. CPM, counts per minute; Ins-ChgA, insulin–chromogranin A.
Figure 2.
Figure 2.
B cells are the major MHC-IIexpressing APCs in the blood presenting inulin peptides. (A) Blood leukocytes were obtained from 4-wk-old female NOD mice, and the MHC-II (I-Ag7)–bearing cells were analyzed by flow cytometry. Data show representative FACS plots depicting the gating strategy for identifying different APCs in the blood, including the MHC-II+ B cells, monocytes, pDCs, and conventional DCs. (B) Percentage of the MHC-II+ B cells, monocytes, pDCs, and conventional DCs, as described in A, among the total CD45+ leukocytes in the blood of 4-wk-old female NOD mice. (C) Responses of the InsB:13-21– and InsB:12-20–specific CD4 T cells to equal numbers of B cells or non–B cell APCs (regardless of MHC-II expression) isolated from NOD mice given glucose. (D) Responses of the InsB:13-21– and InsB:12-20–specific CD4 T cells to equal numbers of B cells or non–B cell APCs isolated from NOD mice (regardless of MHC-II expression) without glucose challenge upon pulse with exogenous InsB:9-23 (10 µM). Data (mean ± SEM) summarize results pooled from two (B–D) independent experiments; each point represents one biological replicate including three or four mice. *, P < 0.05; Mann–Whitney test. CPM, counts per minute.
Figure 3.
Figure 3.
Specific monoclonal antibodies block the presentation of InsB peptides by WBCs and reduce diabetes penetrance. (A) Responses of the InsB:13-21– and InsB:12-20–specific CD4 T cells to blood leukocytes obtained from NOD mice with or without injection of a mixture of anti–InsB:9-23 and anti–InsB:1-30 antibodies before glucose challenge. The anti–I-Ag7 antibody was added to the T cell–leukocyte culture as a control. Data (mean ± SEM) summarize results pooled from three independent experiments; each point represents one biological replicate including two to six mice. ****, P < 0.001; Mann–Whitney test. (B) Diabetes incidence of female NOD mice administered with the mixture of anti–InsB:9-23 and anti–InsB:1-30 antibodies. The control mice were given polyclonal mouse IgG. Data summarize the percent of diabetes (21 mice per group) from three independent experiments. **, P < 0.005; log-rank test. (C and D) Cohorts of female NOD mice were given the anti-InsB antibody mixture or control mouse IgG weekly at 4, 5, and 6 wk of age, and the islets were analyzed for leukocyte infiltration by flow cytometry at 9 wk of age. (C) Representative FACS plots showing the gating strategy of the immune cell components in the islets, including the CD45+ leukocytes, CD4 and CD8 T cells, DCs, and the resident macrophages (Mac). (D) Percentage of the indicated immune cell populations, as depicted in C, among the total islet cells. Data represent results obtained from individual mice (each point) examined in three independent experiments. *, P < 0.01; **, P < 0.005; Mann–Whitney test. CPM, counts per minute; SSA, side scatter A.
Figure 4.
Figure 4.
Relative abundance of insulin peptides isolated from blood leukocytes. The data show the relative abundance of each individual peptide sequence derived from the Ins2B:9-23 and Ins1C:51-61 families depicted in Table 1. LC-MS/MS data files of the leukocyte MHC-II peptidome were loaded into Skyline for quantification of peptides covering the Ins2B:9-23 and Ins1C:51-61 families, and the resulting peak areas were exported, normalized based on the total ion current, and log2-transformed. The bars represent the normalized log2 abundance of the indicated peptides. The results of the no glucose condition represent a single experiment analyzing 3 × 10⁷ blood leukocytes from 19 NOD mice without glucose challenge. The data of the glucose challenge condition are from two independent experiments including 20 (3 × 10⁷ cells) and 40 (7.5 × 10⁷ cells) NOD mice after glucose injection, respectively. In peptide sequences, the lowercase c denotes the oxidation of cysteine to cysteic acid, and the lowercase q denotes the deamidation of glutamine.

References

    1. Acha-Orbea, H., and McDevitt H.O.. 1987. The first external domain of the nonobese diabetic mouse class II I-A beta chain is unique. Proc. Natl. Acad. Sci. USA. 84:2435–2439. 10.1073/pnas.84.8.2435 - DOI - PMC - PubMed
    1. Anderson, M.S., and Bluestone J.A.. 2005. The NOD mouse: a model of immune dysregulation. Annu. Rev. Immunol. 23:447–485. 10.1146/annurev.immunol.23.021704.115643 - DOI - PubMed
    1. Babon, J.A.B., DeNicola M.E., Blodgett D.M., Crèvecoeur I., Buttrick T.S., Maehr R., Bottino R., Naji A., Kaddis J., Elyaman W., et al. . 2016. Analysis of self-antigen specificity of islet-infiltrating T cells from human donors with type 1 diabetes. Nat. Med. 22:1482–1487. 10.1038/nm.4203 - DOI - PMC - PubMed
    1. Burel, J.G., Pomaznoy M., Lindestam Arlehamn C.S., Weiskopf D., da Silva Antunes R., Jung Y., Babor M., Schulten V., Seumois G., Greenbaum J.A., et al. . 2019. Circulating T cell-monocyte complexes are markers of immune perturbations. eLife. 8:e46045. 10.7554/eLife.46045 - DOI - PMC - PubMed
    1. Carrero, J.A., McCarthy D.P., Ferris S.T., Wan X., Hu H., Zinselmeyer B.H., Vomund A.N., and Unanue E.R.. 2017. Resident macrophages of pancreatic islets have a seminal role in the initiation of autoimmune diabetes of NOD mice. Proc. Natl. Acad. Sci. USA. 114:E10418–E10427. 10.1073/pnas.1713543114 - DOI - PMC - PubMed

Publication types

MeSH terms