. 2021 May 5;109(9):1497-1512.e6.
doi: 10.1016/j.neuron.2021.03.012. Epub 2021 Apr 5.

A central mechanism of analgesia in mice and humans lacking the sodium channel NaV1.7

Affiliations

A central mechanism of analgesia in mice and humans lacking the sodium channel NaV1.7

Donald Iain MacDonald et al. Neuron. .

Abstract

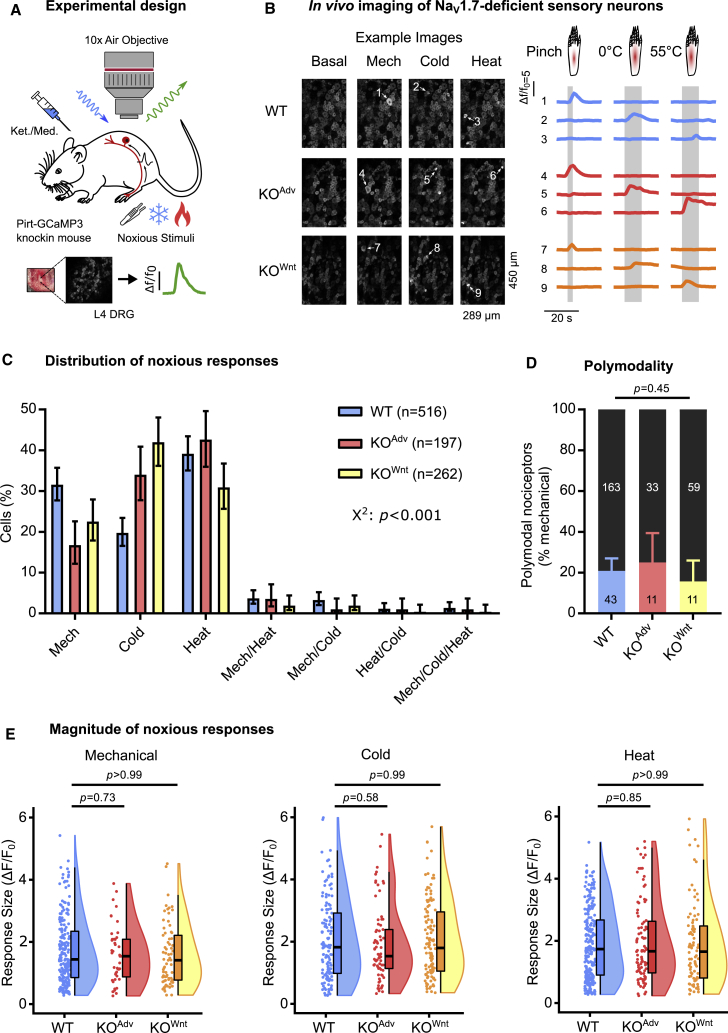
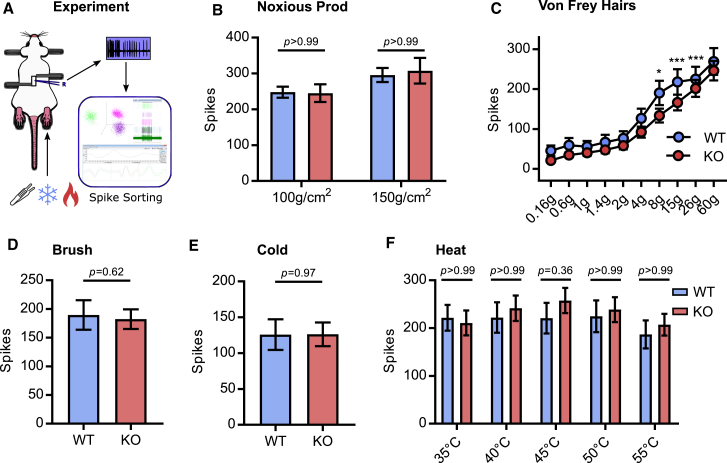
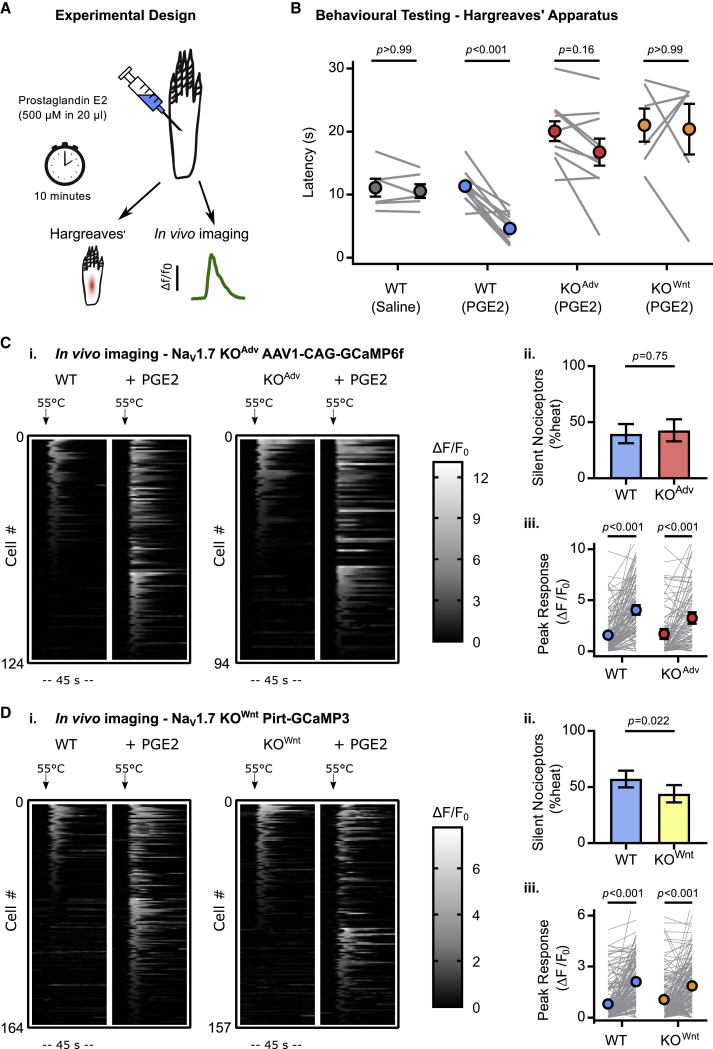
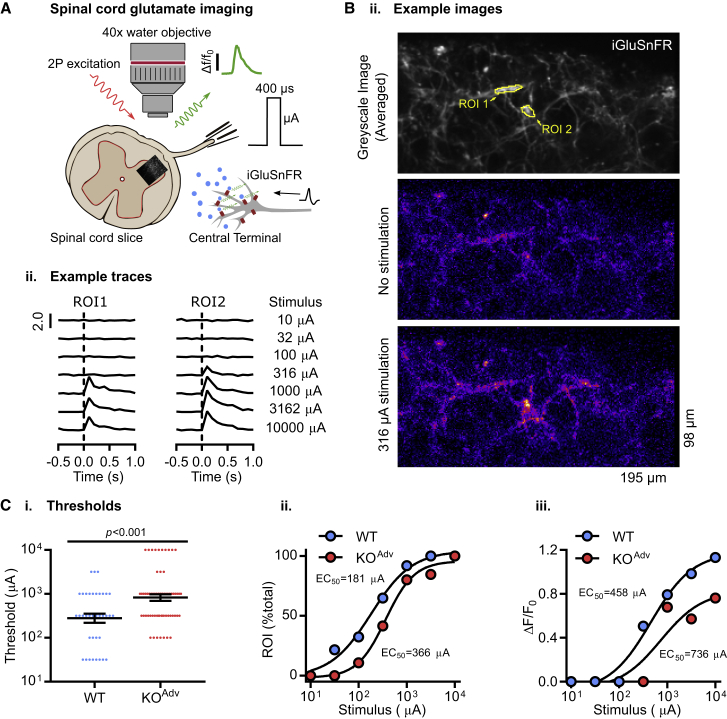
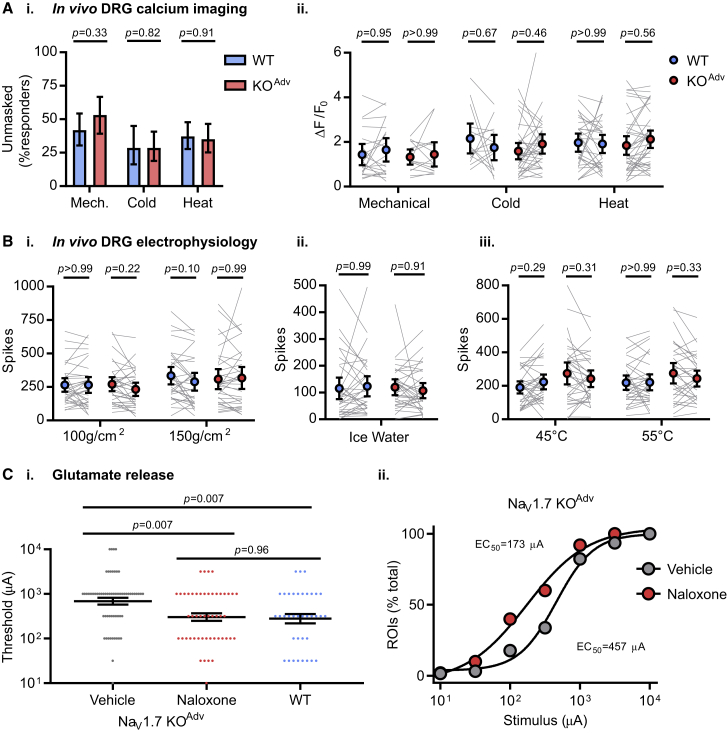
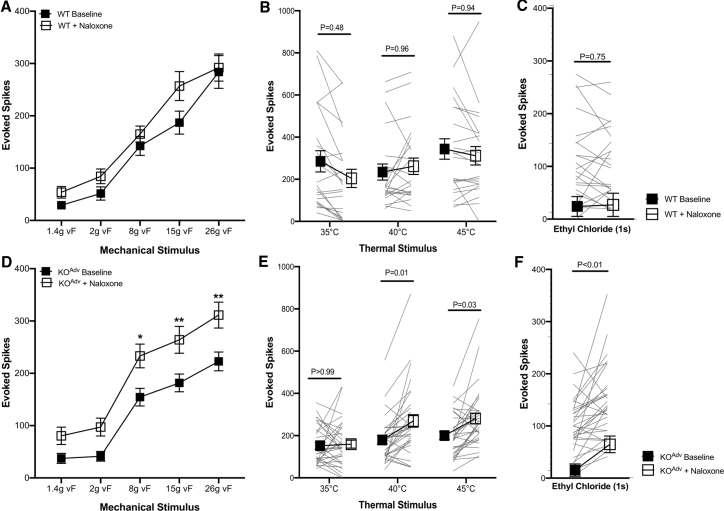
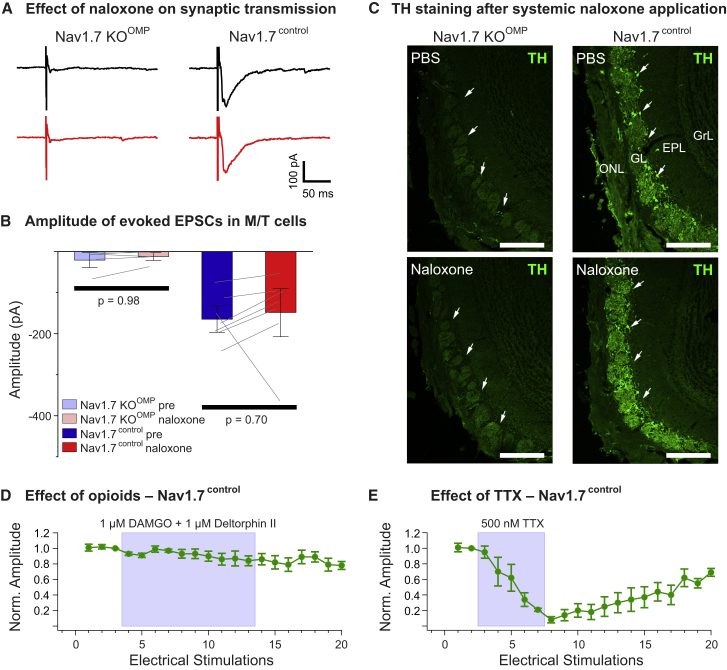
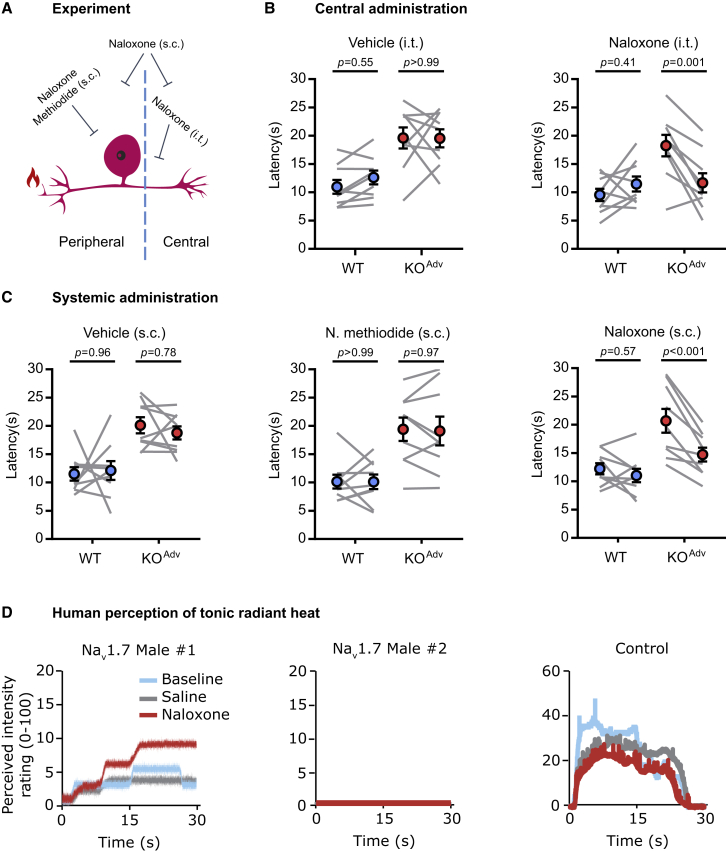
Deletion of SCN9A encoding the voltage-gated sodium channel NaV1.7 in humans leads to profound pain insensitivity and anosmia. Conditional deletion of NaV1.7 in sensory neurons of mice also abolishes pain, suggesting that the locus of analgesia is the nociceptor. Here we demonstrate, using in vivo calcium imaging and extracellular recording, that NaV1.7 knockout mice have essentially normal nociceptor activity. However, synaptic transmission from nociceptor central terminals in the spinal cord is greatly reduced by an opioid-dependent mechanism. Analgesia is also reversed substantially by central but not peripheral application of opioid antagonists. In contrast, the lack of neurotransmitter release from olfactory sensory neurons is opioid independent. Male and female humans with NaV1.7-null mutations show naloxone-reversible analgesia. Thus, inhibition of neurotransmitter release is the principal mechanism of anosmia and analgesia in mouse and human Nav1.7-null mutants.

Keywords: Na(V)1.7; analgesia; endogenous opioids; human genetics; neurotransmitter release; pain; sodium channels.


Conflict of interest statement

Declaration of interests The authors declare no competing interests.

Figures

Figure 1
Figure 1
NaV1.7-deficient sensory neurons respond to noxious stimuli at the level of the soma in vivo (A) Schematic of the in vivo DRG imaging setup. (B) Example images and traces showing sensory neurons respond to noxious mechanical and thermal stimuli in WT and both NaV1.7 KO mouse lines. Each numbered trace corresponds to one cell. The data in this figure were obtained from 19 WT, 8 KOAdv, and 11 KOWnt animals. (C) Bar plot summarizing the distribution of all sensory neurons that responded to different noxious stimuli in WT and NaV1.7 KO animals. The error bars represent 95% confidence intervals, and proportions were compared using a chi-square test. n = 516 cells from WT (blue), n = 197 cells from KOAdv (red), and n = 262 cells from KOWnt (yellow). (D) Bar plot showing a similar prevalence of polymodal nociceptors in WT and NaV1.7 KO mice. Polymodal nociceptors are defined as pinch-sensitive neurons that respond to any noxious thermal stimulus (color) and are expressed as a fraction of mechanically sensitive cells (black). The error bars represent 95% confidence intervals, and proportions were compared using the chi-square test. n = 206 cells from WT, n = 44 cells from KOAdv, and n = 70 cells from KOWnt. (E ) Raincloud plots showing similar peak calcium responses (ΔF/F0) evoked by different noxious stimuli for WT and NaV1.7 KO lines. The mean response magnitude of KO lines was compared with the WT control using one-way ANOVA followed by post hoc Dunnett’s test. Mechanical: n = 206 cells from WT, n = 44 cells from KOAdv, and n = 70 cells from KOWnt. Cold: n = 132 cells from WT, n = 73 cells from KOAdv, and n = 117 cells from KOWnt. Heat: n = 234 cells from WT, n = 95 cells from KOAdv, and n = 88 cells from KOWnt. See also Figures S1–S3.
Figure 2
Figure 2
Excitability of NaV1.7-deficient sensory neurons in vivo (A) Schematic of the in vivo DRG extracellular recording setup. (B) Quantification of spikes fired in response to noxious prodding in WT (blue) and NaV1.7 KO (red). Data from Advillin-Cre and Wnt1-Cre NaV1.7 KO mice were pooled for these experiments. (C) Quantification of spikes fired in response to von Frey hair stimulation. For 8 g, p = 0.014. For 15 g, p < 0.001. For 26 g, p < 0.001. (D) Quantification of spikes fired in response to brushing. (E) Quantification of spikes fired in response to cooling. (F) Quantification of spikes fired in response to heating. For (B), (C), and (F), mean numbers of spikes fired in 10 s were compared using repeated-measures two-way ANOVA followed by post hoc Bonferroni test. For (D) and (E), means were compared using an unpaired t test. Error bars represent 95% confidence interval around the mean. n = 90 cells from 10 WT animals, and n = 146 cells from 13 KOAdv/Wnt animals.
Figure 3
Figure 3
NaV1.7 deletion abolishes inflammatory pain without affecting peripheral sensitization (A) Schematic illustrating induction of acute inflammatory pain using PGE2. (B) Behavioral assessment of the effect of PGE2 on Hargreaves’ withdrawal latencies in WT and NaV1.7 KO animals, showing that KO mice do not develop heat hyperalgesia. The error bars represent standard error of the mean. Mean latencies before and after PGE2 were compared using repeated-measures two-way ANOVA followed by post hoc Sidak’s test. n = 6 animals for WT vehicle, n = 12 for WT PGE2, n = 10 for KOAdv PGE2, and n = 6 for KOWnt PGE2. (C) Heatmaps (i) and quantification (ii and iii) showing unmasking of silent heat nociceptors by PGE2 in WT and NaV1.7 KOAdv animals virally transduced with GCaMP6f. n = 124 cells from 4 WT animals, and n = 94 cells from 4 KOAdv. (D) Heatmaps (i) and quantification (ii and iii) showing unmasking of silent heat nociceptors by PGE2 in WT and NaV1.7 KOWnt animals expressing GCaMP3. n = 164 cells from 8 WT animals, and n = 157 cells from 11 KOWnt animals. For (C) and (D), the effect of genotype on PGE2-induced unmasking of silent nociceptors was compared using the chi-square test with Yates’ correction for proportions (i) and repeated-measures two-way ANOVA followed by post hoc Sidak’s test for mean response size (ii). Error bars represent 95% confidence intervals.
Figure 4
Figure 4
Decreased neurotransmitter release from the central terminals of NaV1.7-deficient sensory neurons (A) Schematic illustrating two-photon imaging of iGluSnFR-expressing afferent terminals in the dorsal horn of the spinal cord. iGluSnFR was virally expressed in sensory afferents. In horizontal slices, a suction electrode was used to electrically stimulate the attached dorsal root, driving glutamate release in lamina II of the dorsal horn. Increased extracellular glutamate at afferent terminals resulted in a time-locked increase in iGluSnFR fluorescence. (B) Example images of an area of lamina II dorsal horn in spinal cord slices from a NaV1.7 KOAdv mouse expressing iGluSnFR in sensory afferent terminals (i). The top image is a greyscale average of the iGluSnFR signal over time, showing the afferent processes. The center image shows the signal in the absence of stimulation. In the bottom image, electrical stimulation causes localized increases in iGluSnFR fluorescence in discrete areas of the image. Two such areas are identified as regions of interest: region of interest (ROI) 1 and ROI 2. The images are pseudocolored to emphasize changes in fluorescence. Also shown are example traces of normalized increases in fluorescence (ΔF/F0) from each ROI to different single-pulse stimulation intensities applied to the dorsal root (ii). (C) Plots showing that the threshold current required to evoke glutamate release is increased in slices from KOAdv mice. For (i), the mean absolute threshold was compared between genotypes using an unpaired t test. Error bars represent standard error of the mean. For (ii), WT EC50 = 181 μA, r2 = 0.99; KOAdv EC50 = 366 μA, r2 = 0.99. For (iii), median evoked glutamate release (ΔF/F0) was compared between genotypes. WT EC50 = 458 μA, r2 = 0.98; KOAdv EC50 = 736 μA, r2 = 0.86. n = 37 ROIs from 4 WT animals, and n = 65 ROIs from 6 KOAdv mice. See also Figures S4 and S5.
Figure 5
Figure 5
Opioid receptor blockade rescues impaired neurotransmission after NaV1.7 deletion but does not affect peripheral excitability (A) In vivo imaging of sensory neuron activity before and after treatment with systemic naloxone (2 mg/kg subcutaneously for 20 min) in WT (blue) and NaV1.7 KOAdv (red) mice. Naloxone unmasked previously silent neurons in WT and KOAdv mice (i). Proportions were compared using chi-square test with Yates’ correction. Naloxone had no effect on the peak calcium responses evoked by noxious stimuli in either genotype (ii). Mean peak calcium responses before and after naloxone were compared using repeated-measures two-way ANOVA followed by post hoc Sidak’s test. Data were obtained from 4 WT and 6 KOAdv animals. Mechanical: n = 62 cells from WT, n = 47 cells from KOAdv. Cold: n = 35 cells from WT, n = 63 cells from KOAdv. Heat: n = 86 cells from WT, n = 74 cells from KOAdv. (B) In vivo extracellular recording of sensory neuron action potential firing before and after treatment with systemic naloxone (2 mg/kg subcutaneously for 20 min) in WT (blue) and NaV1.7 KOAdv (red) mice. Naloxone had no effect on spiking evoked by noxious mechanical (i), ice water (ii) or heat (iii) stimuli. Mean spikes fired before and after naloxone were compared using repeated-measures two-way ANOVA followed by post hoc Sidak’s test. n = 33 from 6 WT animals, and n = 33 from 7 KOAdv animals. (C) Ex vivo iGluSnFR imaging of glutamate release from sensory neuron central terminals in dorsal horn of spinal cord slices from 6 KOAdv animals treated with vehicle (gray) or 100 μM naloxone (red). Naloxone reduced the mean threshold (i) and EC50 (ii) current required to elicit release to WT levels (blue). n = 62 ROIs for vehicle and n = 50 for naloxone in KOAdv. The WT data are the same as in Figure 4C (n = 37). Means were compared using one-way ANOVA followed by post hoc Tukey test. Error bars represent standard error of the mean.
Figure 6
Figure 6
Impaired spinal sensory coding of noxious stimuli in peripheral Nav1.7 KO mice is reversed by opioid receptor blockade (A–F) Evoked activity of wide-dynamic-range deep dorsal horn neurons in WT and KOAdv to (A and D) von Frey mechanical stimuli, (B and E) heat stimuli, and (C and F) noxious cold stimulation with ethyl chloride. Response profiles of 22 WDR neurons from WT mice (n = 7) and 32 WDR neurons from KO mice (n = 10) were recorded. Data are shown as mean number of action potentials fired ± SEM. p < 0.05, ∗∗p < 0.01. All data were analyzed with two-way repeated-measures ANOVA with post hoc Sidak’s test (A, B, D, and E) and paired t test (C and F) with significance set at p > 0.05.
Figure 7
Figure 7
Opioid receptor blockade does not rescue synaptic transmission in mice lacking NaV1.7 in olfactory sensory neurons (A) Loss of synaptic transmission onto M/T cells in olfactory bulb slices of NaV1.7 KOOMP mice after olfactory sensory neuron nerve stimulation cannot be rescued by 300 μM naloxone (left, red trace). Additionally, 300 μM naloxone does not affect M/T EPSCs to presynaptic nerve stimulation in control mice (right, red trace). (B) Summary plot showing that the morphine receptor antagonist naloxone (300 μM) does not affect EPSC amplitudes in M/T cells after presynaptic nerve stimulation in NaV1.7 KOOMP (KOOMP pre and naloxone, n = 17 from 5 animals) or in control mice (pre and naloxone, n = 7 from 4 animals). Error bars represent SEM. Means were compared using paired t test. (C) Confocal images of tyrosine hydroxylase (TH) immunostaining (green) in coronal cryosections of the main olfactory bulb (MOB) following systemic administration of PBS or naloxone of adult NaV1.7 KOOMP (left) and control (right) mice. TH staining is absent in the glomerular layer (GL) of NaV1.7 KOOMP mice independent of treatment (arrows), whereas the MOB of control mice shows robust TH labeling of neuronal processes and periglomerular cell somata (arrows). There is no difference in TH staining in control MOBs when comparing PBS versus naloxone administration. ONL, olfactory nerve layer; EPL, external plexiform layer; GrL, granule cell layer. Scale bars, 200 μm. (D) Time course showing that treatment with 1 μM DAMGO and 1 μM deltorphin II does not affect M/T cell EPSCs evoked by olfactory nerve stimulation (n = 4). Normalized EPSC peak amplitudes are plotted as a function of the number of electrical ONL stimulations (1-min intervals). Error bars represent SEM. (E) Time course showing that treatment with 500 nM TTX completely and reversibly abolishes M/T cell EPSCs evoked by ONL stimulation (n = 4). Error bars represent standard error of the mean.
Figure 8
Figure 8
Blocking central opioid receptors reverses analgesia in mice and humans lacking NaV1.7 (A) Schematic of the behavioral pharmacology experiment. (B) Behavioral assessment of the effect of vehicle and the opioid receptor blocker naloxone (3 mM in 5 μL for 20 min) administered centrally by intrathecal injection. (C) Behavioral assessment of the effect of vehicle and the opioid receptor blockers naloxone (2 mg/kg for 20 min) and naloxone methiodide (N. methiodide; 2 mg/kg for 20 min) administered systemically by subcutaneous injection. N. methiodide is peripherally restricted and does not cross the blood-brain barrier. (D) Line plots showing the reported, perceived intensity of tonic, radiant heat stimuli (45°C–48°C) in two newly reported male NaV1.7-null individuals and one control participant, at baseline, during saline administration and after treatment with naloxone (12 mg). Naloxone appears to increase heat sensitivity in one NaV1.7-null participant (male 1), replicating previous observations in a single female null participant (Minett et al., 2015). Naloxone had no effect in a second NaV1.7-null participant (male 2). The control participant shows higher perceived pain intensity, which is not enhanced by naloxone. For (B) and (C), the error bars represent standard error of the mean. Mean latencies before and after drug treatment were compared using repeated-measures two-way ANOVA followed by post hoc Sidak’s test. n = 9 animals for WT and n = 9 animals for KOAdv. See also Figure S6 and Table S1.

Comment in

References

    1. Ahn H.S., Black J.A., Zhao P., Tyrrell L., Waxman S.G., Dib-Hajj S.D. Nav1.7 is the predominant sodium channel in rodent olfactory sensory neurons. Mol. Pain. 2011;7:32. - PMC - PubMed
    1. Alexandrou A.J., Brown A.R., Chapman M.L., Estacion M., Turner J., Mis M.A., Wilbrey A., Payne E.C., Gutteridge A., Cox P.J. Subtype-selective small molecule inhibitors reveal a fundamental role for Nav1.7 in nociceptor electrogenesis, axonal conduction and presynaptic release. PLoS ONE. 2016;11:e0152405. - PMC - PubMed
    1. Alles S.R.A., Nascimento F., Luján R., Luiz A.P., Millet Q., Bangash M.A., Santana-Varela S., Zhou X., Cox J.J., Okorokov A.L. Sensory neuron-derived NaV1.7 contributes to dorsal horn neuron excitability. Sci. Adv. 2020;6:eaax4568. - PMC - PubMed
    1. Black J.A., Frézel N., Dib-Hajj S.D., Waxman S.G. Expression of Nav1.7 in DRG neurons extends from peripheral terminals in the skin to central preterminal branches and terminals in the dorsal horn. Mol. Pain. 2012;8:82. - PMC - PubMed
    1. Bolz F., Kasper S., Bufe B., Zufall F., Pyrski M. Organization and plasticity of sodium channel expression in the mouse olfactory and vomeronasal epithelia. Front. Neuroanat. 2017;11:28. - PMC - PubMed

Publication types

Substances

Supplementary concepts