. 2021 Apr 15;81(8):1666-1681.e6.
doi: 10.1016/j.molcel.2021.03.006. Epub 2021 Apr 5.

p53 mediates target gene association with nuclear speckles for amplified RNA expression

Affiliations

p53 mediates target gene association with nuclear speckles for amplified RNA expression

Katherine A Alexander et al. Mol Cell. .

Abstract

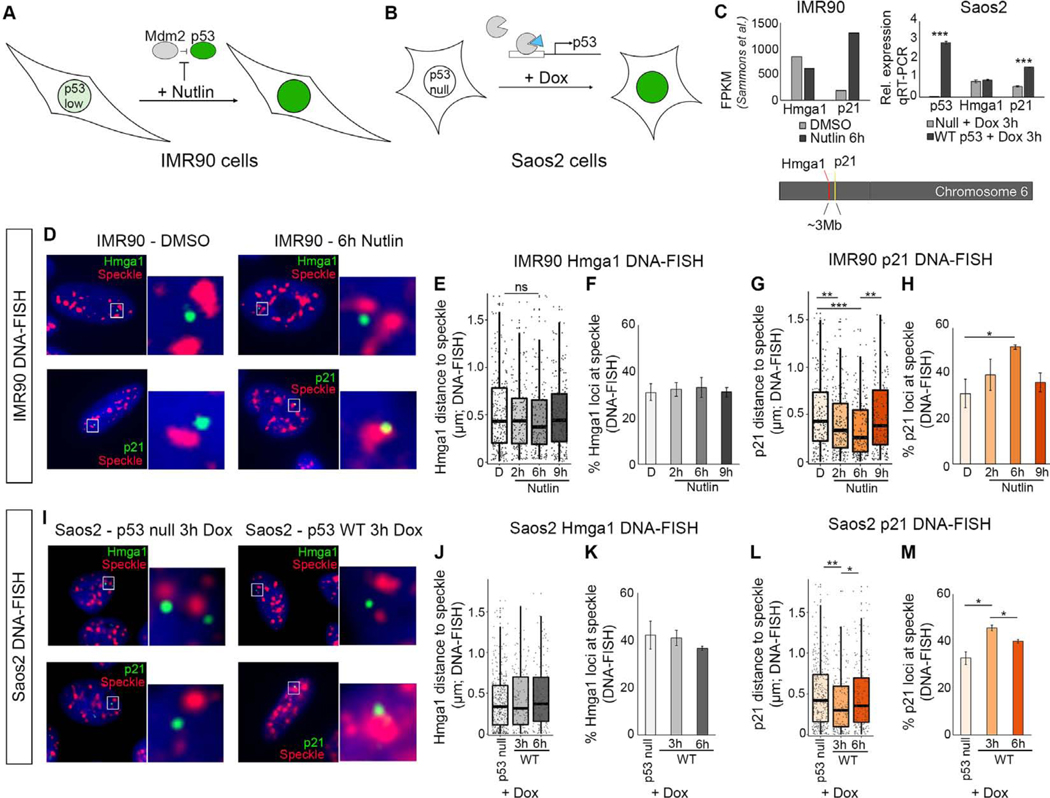
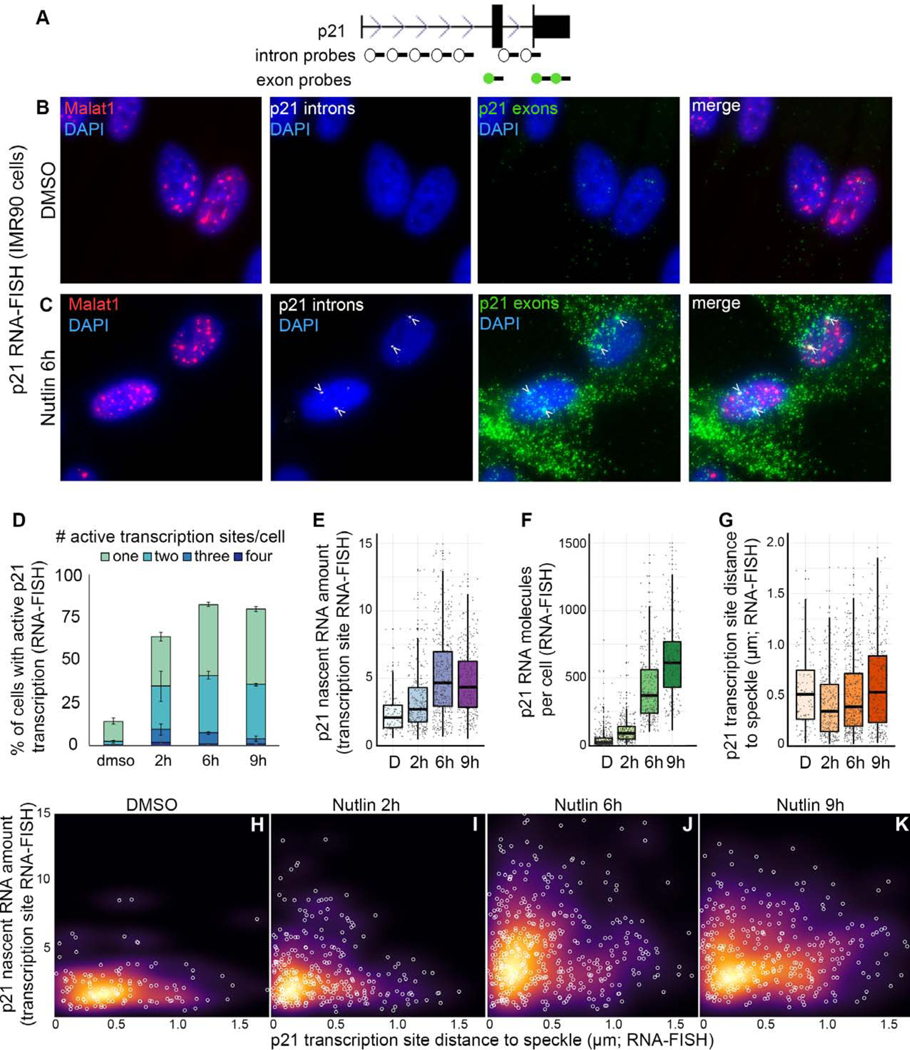
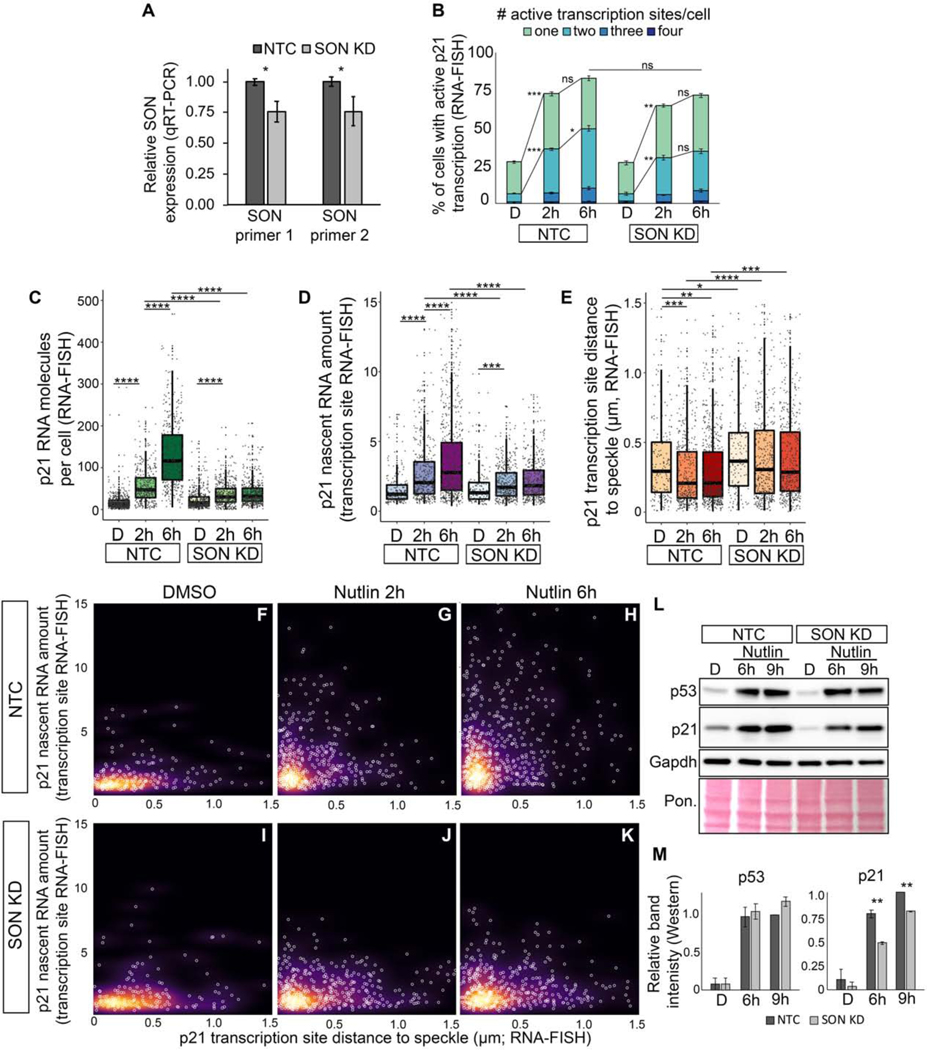
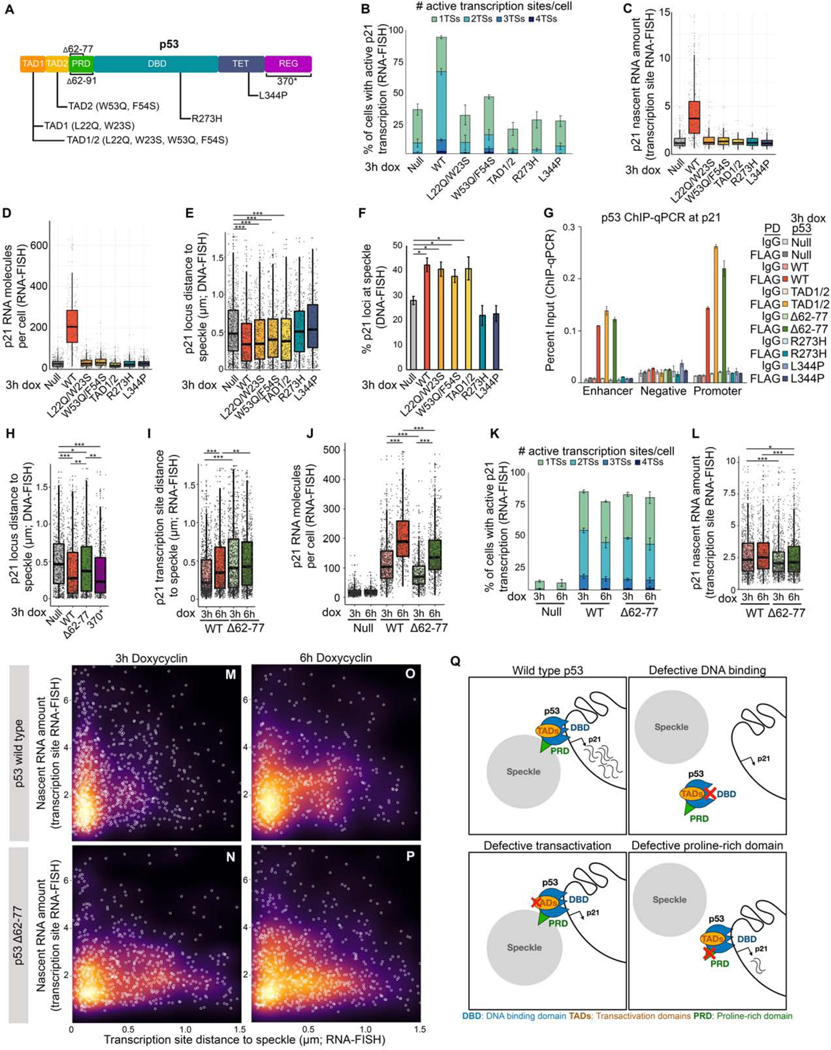
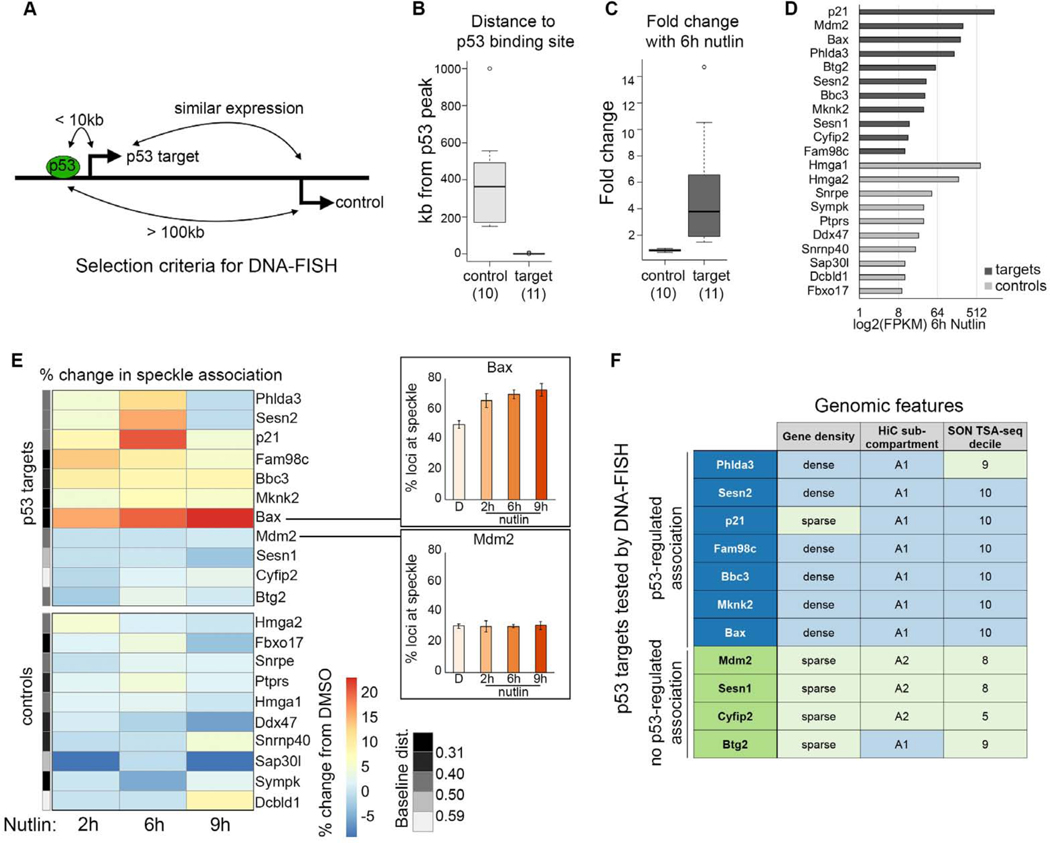
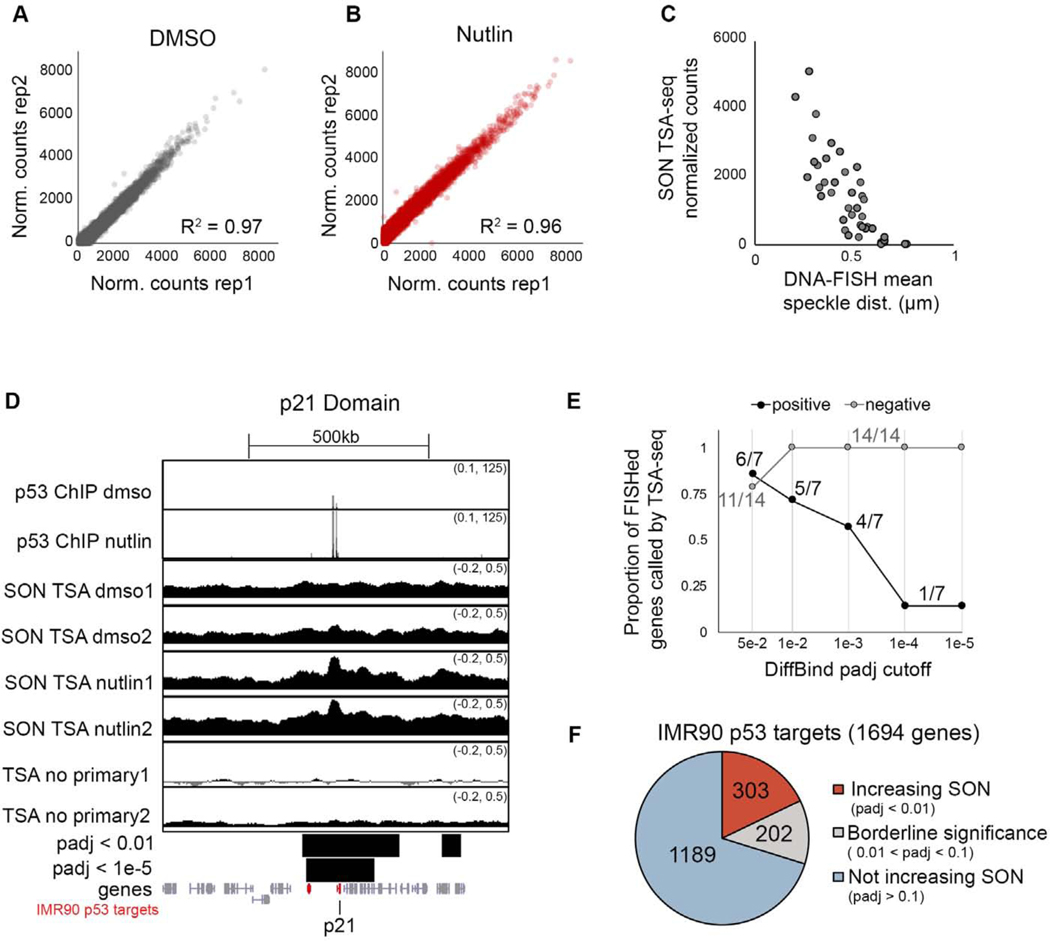
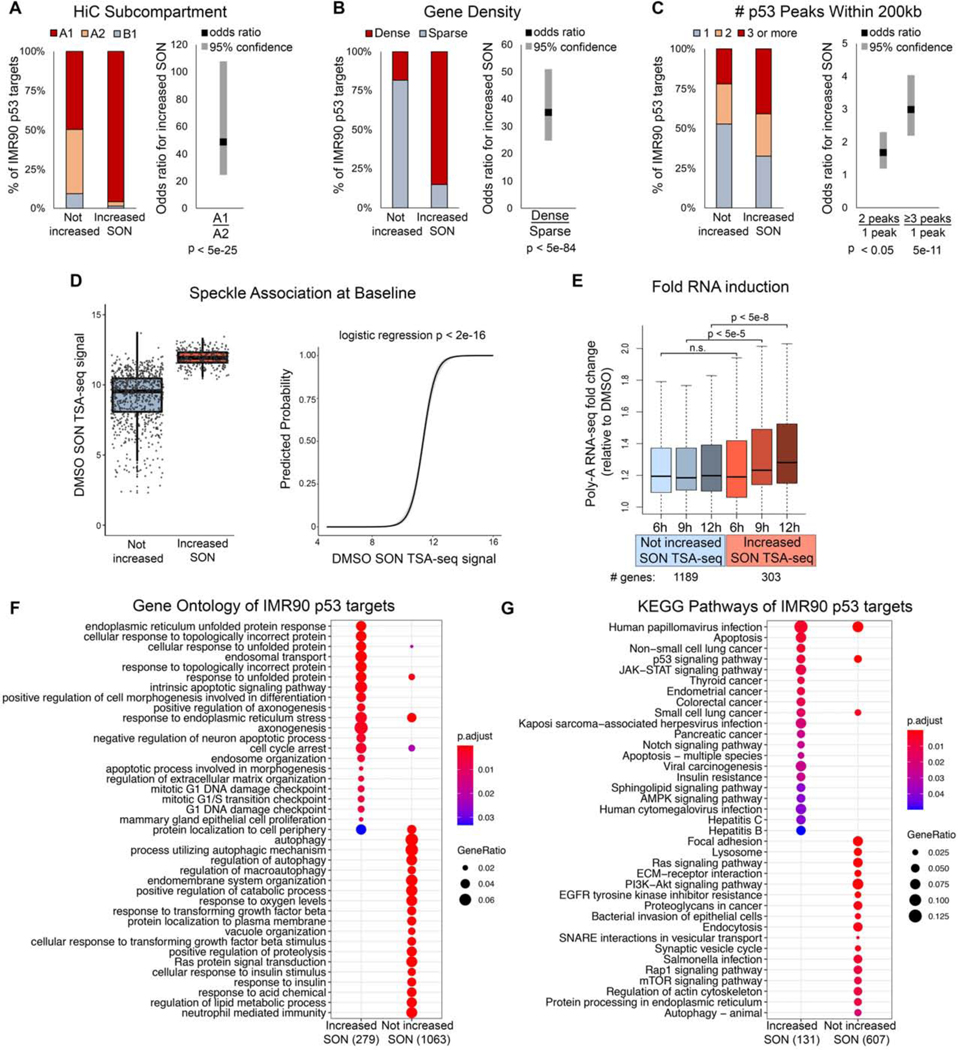
Nuclear speckles are prominent nuclear bodies that contain proteins and RNA involved in gene expression. Although links between nuclear speckles and gene activation are emerging, the mechanisms regulating association of genes with speckles are unclear. We find that speckle association of p53 target genes is driven by the p53 transcription factor. Focusing on p21, a key p53 target, we demonstrate that speckle association boosts expression by elevating nascent RNA amounts. p53-regulated speckle association did not depend on p53 transactivation functions but required an intact proline-rich domain and direct DNA binding, providing mechanisms within p53 for regulating gene-speckle association. Beyond p21, a substantial subset of p53 targets have p53-regulated speckle association. Strikingly, speckle-associating p53 targets are more robustly activated and occupy a distinct niche of p53 biology compared with non-speckle-associating p53 targets. Together, our findings illuminate regulated speckle association as a mechanism used by a transcription factor to boost gene expression.

Keywords: chromosome architecture; gene activation; nuclear positioning; nuclear speckles; p21; p53; phase-separated nuclear bodies; transcription; transcription factor.


Conflict of interest statement

Declaration of interests A.R. receives royalties from LGC/Biosearch Technologies related to Stellaris RNA-FISH.

Figures

Figure 1.
Figure 1.. p21 becomes speckle associated upon p53 activation.
(A) Model of IMR90 cells treated with Nutlin-3a to activate p53. (B) Model of Saos2 p53−/− cells treated with doxycycline to activate expression of p53 transgene. (C) Chromosome locations of p21 and Hmga1 (bottom). RNA-seq FPKM values in IMR90 cells (top left), and qRT-PCR showing expression relative to Gapdh. (D) ImmunoDNA-FISH of Hmga1 (top; green) and p21 (bottom; green) genes with nuclear speckle immunofluorescence (red) and DAPI DNA staining (blue). (E) Distribution of Hmga1 loci distance to the nearest speckle in IMR90 cells. (F) Percentage of Hmga1 loci at the speckle in IMR90 cells. (G) Distribution of p21 loci distances to the nearest speckle in IMR90 cells. (H) Percentage of p21 loci at the speckle in IMR90 cells. (I) ImmunoDNA-FISH in Saos2 p53 null (left) or dox-inducible WT p53 cells (right). (J) Distribution of Hmga1 loci distance to the nearest speckle in Saos2 cells. (K) Percentage of Hmga1 loci at the speckle in Saos2 cells. (L) Distribution of p21 loci distances to the nearest speckle in Saos2 cells. (M) Percentage of p21 loci at the speckle in Saos2 cells. *** - p < 0.0001, ** p < 0.01, * - p < 0.05, unlabelled - not significant. D – DMSO treated. For additional immunoFISH images, see Figure S1. For number of loci counted, see Table S1.
Figure 2.
Figure 2.. Relationship between speckle association and p21 expression.
(A) p21 probe locations. (B and C) Maximum projection images of Malat1 speckle marker (red), p21 introns (white), and p21 exons (green) in IMR90 cells. (D) Quantification of the number of active transcription sites per cell. Error bars represent standard error. (E) Amount of nascent RNA. Each dot represents an individual transcription site. (F) Number of p21 exon spots per cell. Each dot represents a single cell. (G) Distribution of p21 active transcription site distances to the nearest speckle. Each dot represents an individual transcription site. (H-K) Nascent RNA amount versus distance to speckle. Each white circle is an individual transcription site. Background color represents the density of data points. D – DMSO treated. For additional RNA-FISH images see Figure S2. For number of transcription sites and cells counted, see Table S1.
Figure 3.
Figure 3.. Knockdown of SON compromises p53-mediated induction of p21 expression and speckle association.
(A) qRT-PCR measuring SON RNA levels in IMR90 cells treated with a SON shRNA (SON KD) or non-targeting control (NTC). (B) Percentage of cells with active transcription sites. (C) Number of p21 exon spots per cell (p21 molecules per cell) in IMR90 cells. (D) Nascent RNA amount in IMR90 cells. (E) Distribution of p21 transcription site distances to the nearest speckle. (F-K) Nascent RNA amount versus distance to speckle. Each white circle is an individual transcription site. Background color represents the density of data points. (L) Western blot of p53, p21, and Gapdh. Total protein loading is shown by Ponceau (Pon.) staining. (M) Quantification of protein levels based on L and Figure S3 of band intensity relative to Gapdh loading control and normalized to NTC 9h levels. D – DMSO treated; 2h – Nutlin-3h 2 hour treated; 6h – Nutlin-3a 6h treated * p < 0.05, ** p < 0.01, *** p < 0.001, **** p < 0.0001 For additional characterization of SON KD and for SRSF1 KD, see Figure S3. For number of transcription sites and cells counted, see Table S1.
Figure 4.
Figure 4.. p21 speckle association by p53 requires p53 DNA binding and proline rich domains, but not p53 transactivation functions.
(A) p53 protein domains and mutations. TAD – transactivation domain, PRD – proline-rich domain, DBD – DNA-binding domain, TET – tetramerization domain, REG – regulatory domain. (B) Percentage of cells with active transcription sites as measured by RNA-FISH. (C) p21 nascent transcript amount as measured by RNA-FISH. (D) Distribution of the number of p21 molecules per cell as measured by RNA-FISH. (E) Distribution of p21 loci distances to the nearest nuclear speckle as measured by immunoDNA-FISH. (F) Percent p21 loci at nuclear speckles measured by immunoDNA-FISH. (G) ChIP-qPCR of p53 at the p21 enhancer, promoter, and negative region. For primer locations, see Figure S1D. (H) Distribution of speckle distances of p21 loci measured by immunoDNA-FISH. (I) Distribution of speckle distances of p21 loci measured by immunoRNA-FISH. (J) Number of p21 RNA molecules per cell as measured by RNA-FISH. (K) Percentage of cells with active transcription sites as measured by RNA-FISH. (L) Nascent RNA amount in p53 wild type and mutant Saos2 cells. (M-P) Distance to speckle versus transcription site intensity in Saos2 cells induced to express wild type or Δ62–77 p53. (Q) Model showing the consequences of perturbing specific p53 functions. *** p < 0.0001, ** p < 0.01, * p < 0.05, unlabeled - not significant. For additional characterization of p53 mutants, see Figure S4. For number of loci, transcription sites, and cells counted, see Table S1.
Figure 5.
Figure 5.. Nutlin-3a treatment drives increased speckle association of a subset of p53 targets.
(A) Schematic showing selection criteria for DNA-FISH control genes. (B) Gene distance to the nearest p53 peak in IMR90 cells treated with Nutlin-3a (data from Sammons eta al., 2015). (C) RNA fold change in IMR90 cells treated with Nutlin-3a (data from Sammons et al., 2015). (D) Expression (FPKM) of control genes and p53 targets in IMR90 cells treated with Nutlin-3a. (E) Heatmap of change in percentage of transcription sites with speckle association in IMR90 cells upon Nutlin-3a treatment relative to control. Plots (right) show examples of the primary data. The grey bar (left) shows the median baseline distance to the speckle, split into quintiles. (F) Table of p53 target genes with (blue) or without (green) p53-regulated speckle association, and their gene density, HiC subcompartment, and SON TSA-seq decile. For additional representations of speckle association, see Figure S5. For number of loci counted, see Table S1.
Figure 6.
Figure 6.. SON TSA-seq mapping of p53-induced changes in speckle association.
(A-B) Correlation of SON TSA-seq replicates quantified over 50kb windows. (C) SON TSA-seq signal versus mean distance to speckle for 42 DNA-FISH measurements (same measurements as Figure S5). (D) UCSC genome browser tracks of the p21 locus for p53 ChIP-seq (top) and SON TSA-seq in IMR90 cells treated with DMSO or Nutlin-3a for 6 hours, and no primary antibody control (smoothing of 10). Bars below show merged significant domains with adjusted p-value of 0.01 or 1e-5. Genes are in grey, with IMR90 p53 targets in red. (E) Proportion DNA-FISHed genes that do (“positive”) or do not (“negative”) increase speckle association upon Nutlin-3a treatment that were correctly called by SON TSA-seq at different adjusted p-value cutoffs. (F) Number of IMR90 p53 targets that increase SON signal (padj < 0.01; red), do not increase SON signal (padj > 0.1; blue), or have borderline significance (grey). For additional quality checks on SON TSA-seq data, see Figure S6.
Figure 7.
Figure 7.. Characteristics of p53 targets that have p53-regulated increases in speckle association.
(A-C) Stacked barplots (left) and logistic regression odds ratios (right) of IMR90 p53 targets that do (Increased SON) or do not (Not increased) increase speckle association based on HiC subcompartments (A), gene density (B), and number of p53 peaks within 200kb (C). (D) Baseline (DMSO) SON TSA-seq signal of p53 targets that do or do not increase speckle association (left), and logistic regression predicted probability that a p53 target increases speckle association based on baseline SON TSA-seq signal (right). (E) Fold change (of Nutlin-3a for 6, 9, or 12 hours relative to DMSO) of p53 targets that increase (red) and do not increase (blue) SON signal. (F-G) Gene ontology (F) and KEGG pathway (G) comparison of IMR90 p53 targets that do or do not increase SON TSA-seq signal upon Nutlin-3a treatment.

Comment in

  • Speckle function for p53.
    Zlotorynski E. Zlotorynski E. Nat Rev Mol Cell Biol. 2021 Jun;22(6):372. doi: 10.1038/s41580-021-00379-1. Nat Rev Mol Cell Biol. 2021. PMID: 33953380 No abstract available.

References

    1. Adzhubei AA, Sternberg MJ, and Makarov AA (2013). Polyproline-II helix in proteins: structure and function. J Mol Biol 425, 2100–2132. - PubMed
    1. Anders S, Pyl PT, and Huber W. (2015). HTSeq--a Python framework to work with high-throughput sequencing data. Bioinformatics 31, 166–169. - PMC - PubMed
    1. Baptiste N, Friedlander P, Chen X, and Prives C. (2002). The proline-rich domain of p53 is required for cooperation with anti-neoplastic agents to promote apoptosis of tumor cells. Oncogene 21, 9–21. - PubMed
    1. Bartman CR, Hsu SC, Hsiung CC, Raj A, and Blobel GA (2016). Enhancer Regulation of Transcriptional Bursting Parameters Revealed by Forced Chromatin Looping. Mol Cell 62, 237–247. - PMC - PubMed
    1. Bernard D, Prasanth KV, Tripathi V, Colasse S, Nakamura T, Xuan Z, Zhang MQ, Sedel F, Jourdren L, Coulpier F, et al. (2010). A long nuclear-retained non-coding RNA regulates synaptogenesis by modulating gene expression. EMBO J 29, 3082–3093. - PMC - PubMed

Publication types

MeSH terms