. 2021 May 7;49(8):4574-4585.
doi: 10.1093/nar/gkab205.

Nearest-neighbour transition-state analysis for nucleic acid kinetics

Affiliations

Nearest-neighbour transition-state analysis for nucleic acid kinetics

Nick A Rejali et al. Nucleic Acids Res. .

Abstract

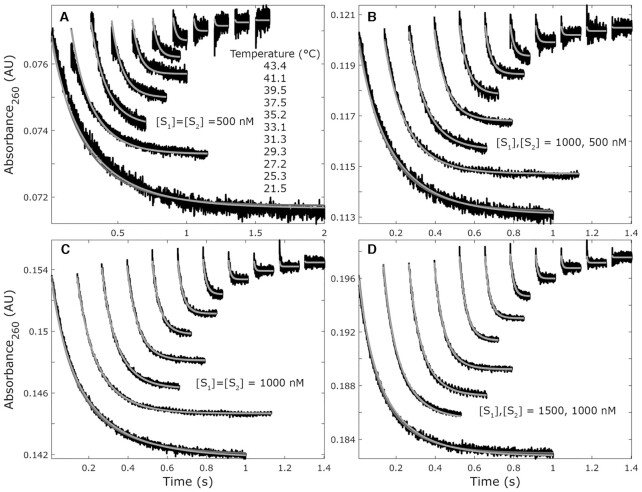
We used stopped-flow to monitor hypochromicity for 43 oligonucleotide duplexes to study nucleic acid kinetics and extract transition-state parameters for association and dissociation. Reactions were performed in 1.0 M NaCl (for literature comparisons) and 2.2 mM MgCl2 (PCR conditions). Dissociation kinetics depended on sequence, increased exponentially with temperature, and transition-state parameters inversely correlated to thermodynamic parameters (r = -0.99). Association had no consistent enthalpic component, varied little with temperature or sequence, and poorly correlated to thermodynamic parameters (r = 0.28). Average association rates decreased 78% in MgCl2 compared to NaCl while dissociation was relatively insensitive to ionic conditions. A nearest-neighbour kinetic model for dissociation predicted rate constants within 3-fold of literature values (n = 11). However, a nearest-neighbour model for association appeared overparameterized and inadequate for predictions. Kinetic predictions were used to simulate published high-speed (<1 min) melting analysis and extreme (<2 min) PCR experiments. Melting simulations predicted apparent melting temperatures increase on average 2.4°C when temperature ramp rates increased from 0.1 to 32°C/s, compared to 2.8°C reported in the literature. PCR simulations revealed that denaturation kinetics are dependent on the thermocycling profile. Simulations overestimated annealing efficiencies at shorter annealing times and suggested that polymerase interactions contribute to primer-template complex stability at extension temperatures.


Figures

Figure 1.
Figure 1.
Hybridization kinetics and model fitting for the sequence 5′-AGCGTAAG-3′ and its complement in 1.0 M NaCl between 21.5 and 43.4°C. Reactions are shifted vertically by small absorbance offsets from fitting and higher temperature reactions are shifted rightward for clarity. The reaction temperatures in panel A apply to B–D as well. Model fits are shown for ΔHa = 0 (light grey) and ΔHa ≠0 (dark gray). (A) Reactions with initial strand concentrations of 500 nM. (B) Reactions with initial strand concentrations [S1] = 1000 nM, [S2] = 500 nM. (C) Reactions with initial strand concentrations of 1000 nM. (D) Reactions with initial strand concentrations [S1] = 1500 nM, [S2] = 1000 nM. Not shown are reactions with initial strand concentrations of [S1] = 500 nM, [S2] = 1000 nM which were all fit simultaneously. As the reaction temperatures increase, equilibration is faster primarily because of increased dissociation rates. Panel C is recreated in Supplemental Figure S2 to better highlight the differences in the two model fits.
Figure 2.
Figure 2.
The dependence of ΔGs at 37°C on GC content and length for association (A, B) and dissociation (C, D) in 1.0 M NaCl (black) and 2.2 mM MgCl2 (grey). ΔGa is correlated to GC content (r = –0.49, P < 10−3 for 1.0 M NaCl and r = –0.75, P < 10−8 for 2.2 mM MgCl2), and length (r = 0.57, P < 10−4 and r = 0.66, P < 10−5). By comparison, ΔGd is correlated to length (r = 0.84, P < 10−11 and r = 0.78, P < 10−9) but not GC content (r = –0.13, P = 0.39 and r = –0.04, P = 0.79). ΔGs vary more between sequences for dissociation, but differences in ionic conditions have a larger effect on association.
Figure 3.
Figure 3.
(A) NN kinetic predictions accurately predict reported dissociation rate constants (avg. 1.7 ± 0.9 fold difference) in the literature using 1.0 M NaCl (B) Correlation of reported association rate constants in the literature to NN kinetic predictions (X’s), GC content (open circles), and the predictive algorithm of Zhang et al. (squares). All values are in 1.0 M NaCl and the GC-content predictions are calculated using Equation (7). See also Supplementary Tables S5 and S6.
Figure 4.
Figure 4.
(A) Simulations of high-speed melting for genotyping F2 c.*97G>A performed in Pryor et al. (2017). Both wildtype (black) and homozygous mutant (grey) variants are shown. Simulated melting curves for each variant are at 0.25, 1, 4, and 16°C/s ramp rates. As the rate increases, the melting curves shift to higher temperatures and the melting transitions become sharper. (B) Experimental (grey circles) and kinetic simulation TMs (black circles) for the wildtype increase logarithmically with the melting rate, while thermodynamic predictions from uMelt (black X’s) are constant.
Figure 5.
Figure 5.
One cycle of simulated PCR for a 75 base-pair target surrounding rs#11078849 using the 5 s (A) and 0.1 s (B) annealing times of Millington et al. (2019). Kinetic simulations for the higher (black solid line) and lower (grey solid line) GC-content primers, as well as thermodynamic simulations that assume equilibrium at every temperature predicted by salt adjusted unified NNs (dashed lines). The time-temperature trace is the black dotted line, and the Y-axis corresponds to % duplex association or temperature. Both kinetic and thermodynamic predictions suggest that the primer–template complexes dissociate prior to reaching typical extension temperatures of 68–75°C.
Figure 6.
Figure 6.
(A) Simulated denaturation efficiencies for each cycle during the amplification of a 60 base-pair fragment of AKAP10. Predictions were based on experimental temperature and time data for duplicate experiments (black, grey) reported by Millington et al. (2019) that were adjusted by –4.3°C. Samples were denatured each cycle for 100 ms after attaining a threshold temperature, during which time the temperature continued to rise. The threshold temperature was determined in separate experiments as the temperature at which duplexes were 98% dissociated after melting analysis at a 0.3°C/s ramp rate. (B) The two time-temperature traces corresponding to Panel A. Predicted time points for 99% dissociation are circled and is achieved only in some cycles that reach higher temperatures. The temperature threshold needed for efficient denaturation in simulations is shown as a horizontal black dashed line.

Similar articles

Cited by

References

    1. Borer P.N., Dengler B., Tinoco I., Uhlenbeck O.C.. Stability of ribonucleic acid double-stranded helices. J. Mol. Biol. 1974; 86:843–853. - PubMed
    1. Zhu H., Zhang H., Ni S., Korabečná M., Yobas L., Neuzil P.. The vision of point-of-care PCR tests for the COVID-19 pandemic and beyond. TrAC - Trends Anal. Chem. 2020; 130:115984. - PMC - PubMed
    1. Myrick J.T., Pryor R.J., Palais R.A., Ison S.J., Sanford L., Dwight Z.L., Huuskonen J.J., Sundberg S.O., Wittwer C.T.. Integrated extreme real-time PCR and high-speed melting analysis in 52 to 87 seconds. Clin. Chem. 2019; 65:263–271. - PubMed
    1. Rejali N.A., Zuiter A.M., Quackenbush J.F., Wittwer C.T.. Reverse transcriptase kinetics for one-step RT-PCR. Anal. Biochem. 2020; 601:113768. - PubMed
    1. Wetmur J.G. Hybridization and renaturation kinetics of nucleic acids. Annu. Rev. Biophys. Bioeng. 1976; 5:337–361. - PubMed

Publication types

LinkOut - more resources