. 2021 Apr;11(4):200405.
doi: 10.1098/rsob.200405. Epub 2021 Apr 7.

A TOR (target of rapamycin) and nutritional phosphoproteome of fission yeast reveals novel targets in networks conserved in humans

Affiliations

A TOR (target of rapamycin) and nutritional phosphoproteome of fission yeast reveals novel targets in networks conserved in humans

Lenka Halova et al. Open Biol. 2021 Apr.

Abstract

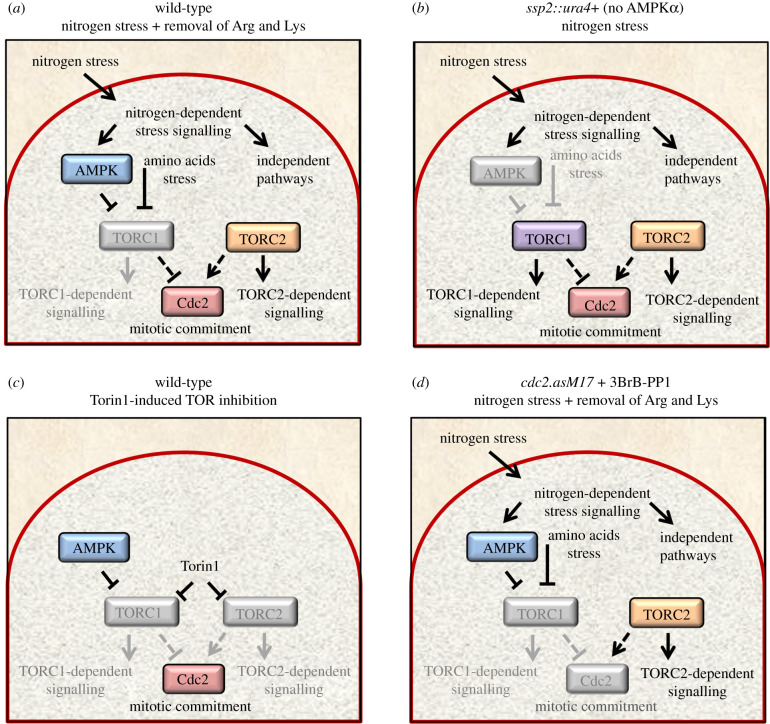
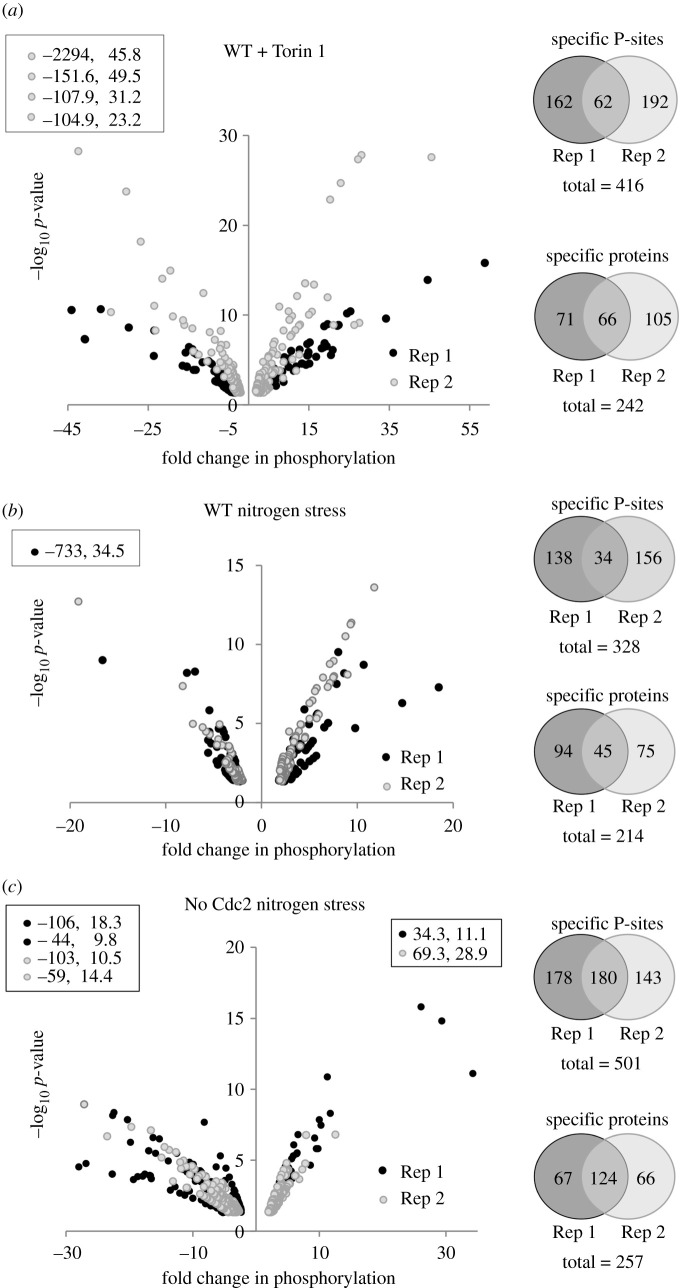
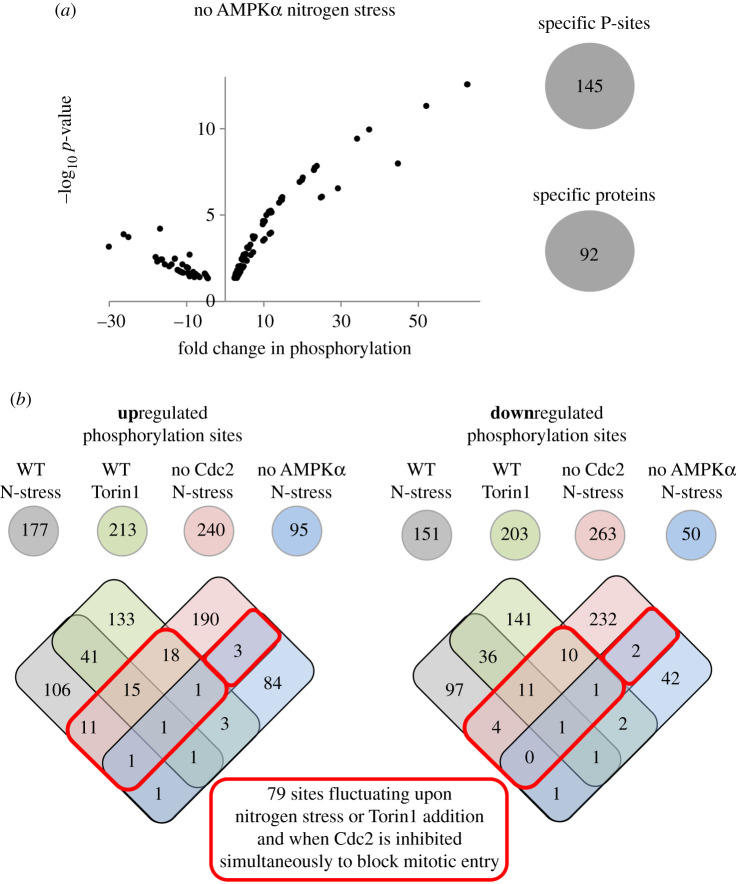
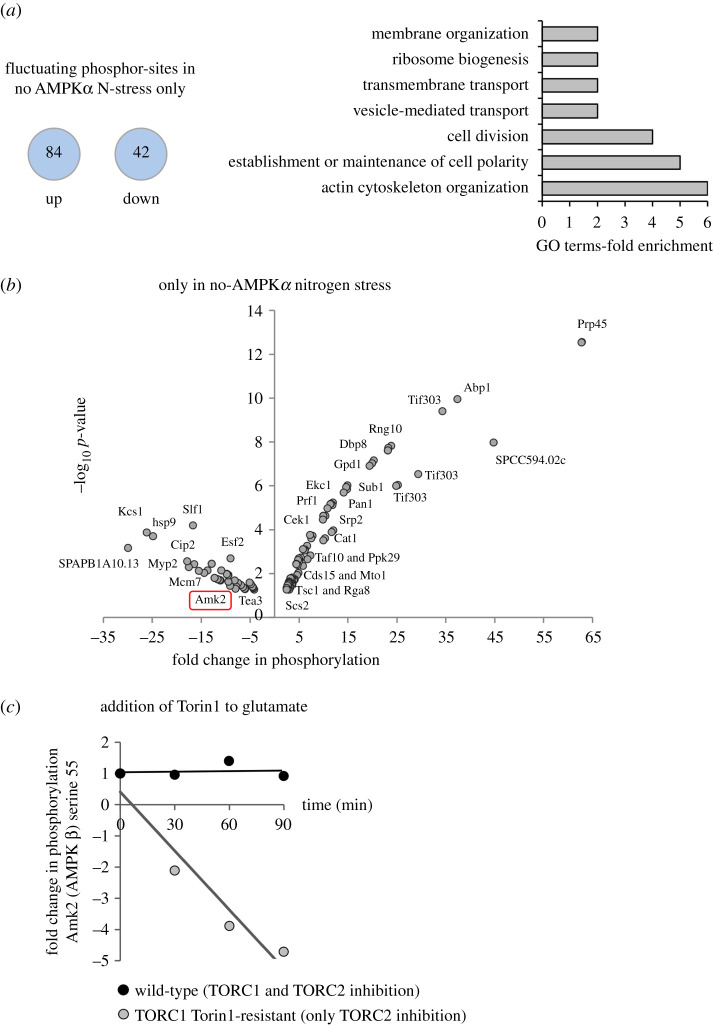
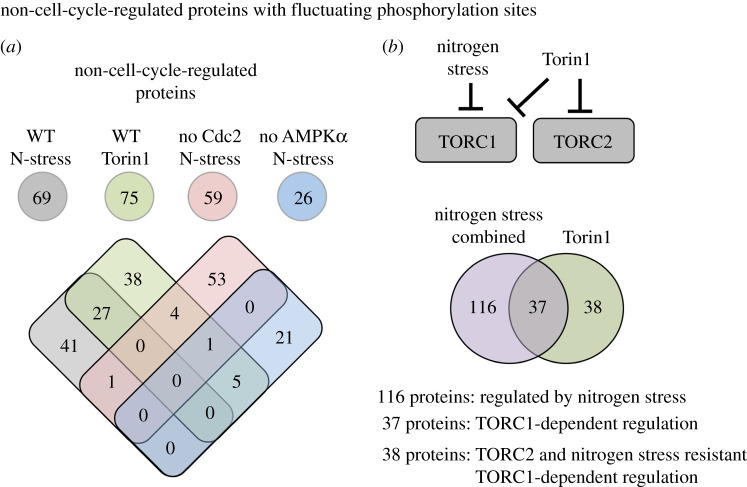
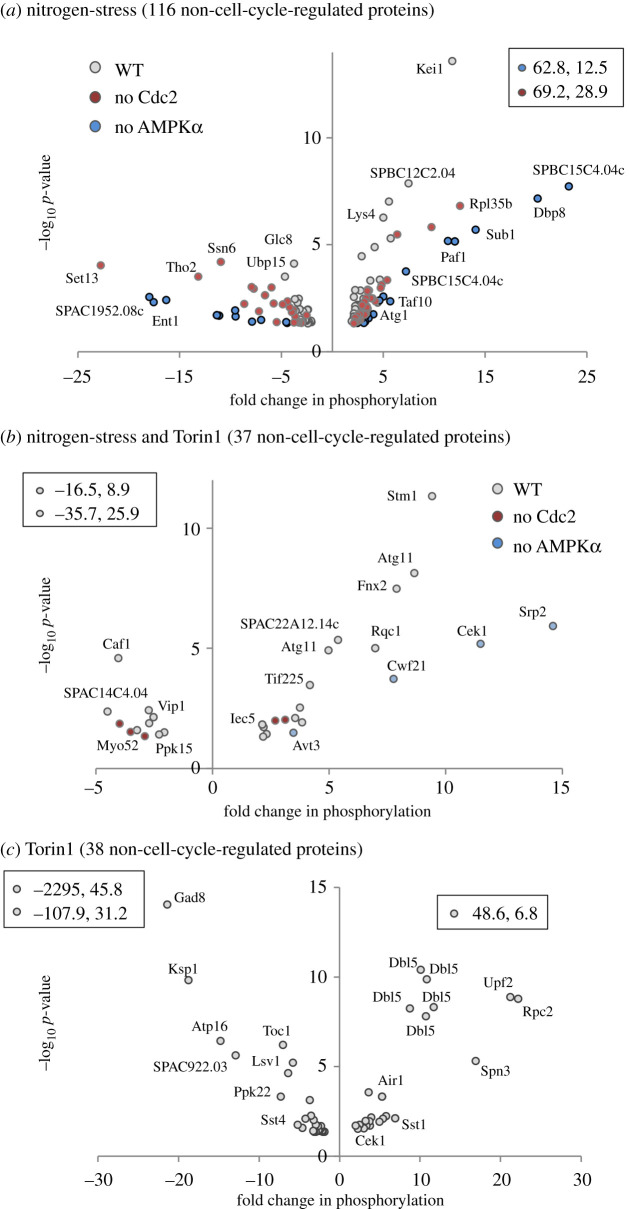
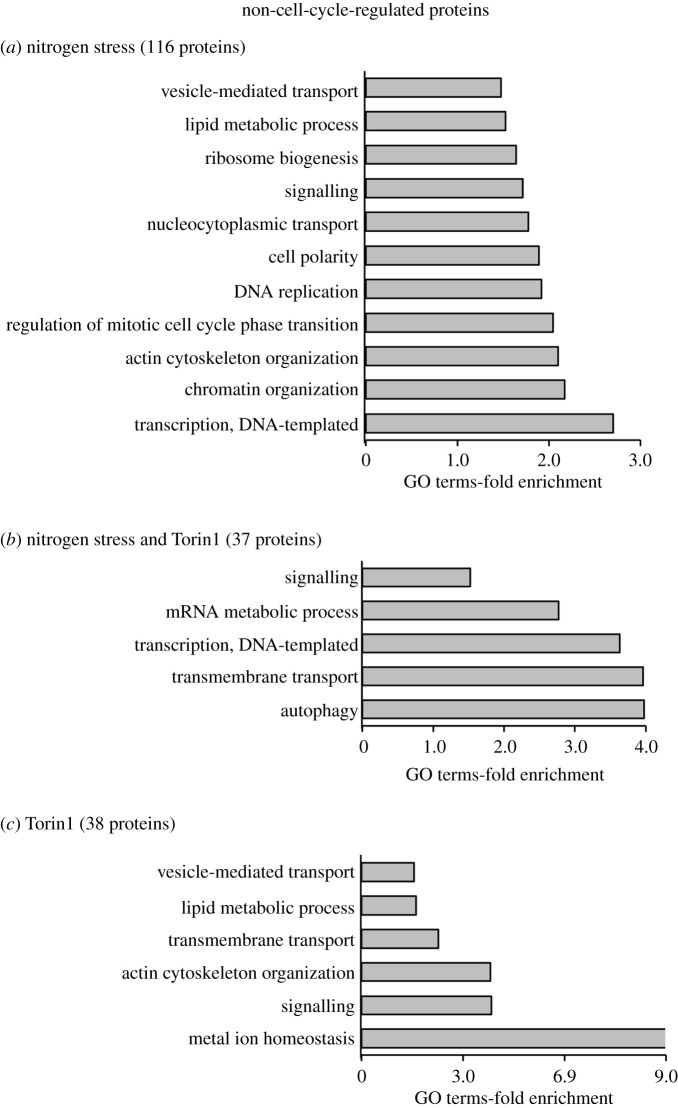
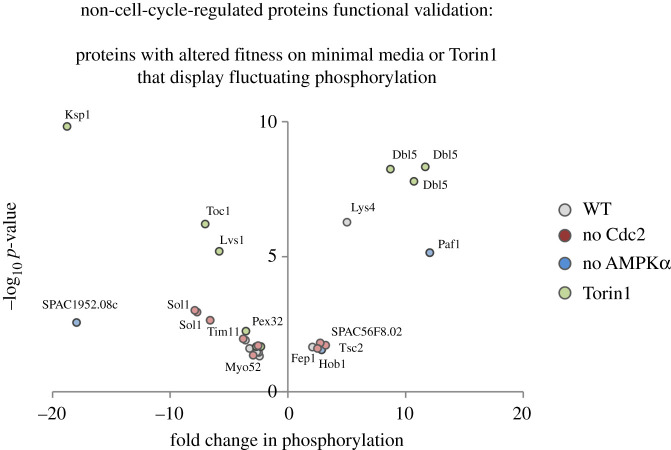
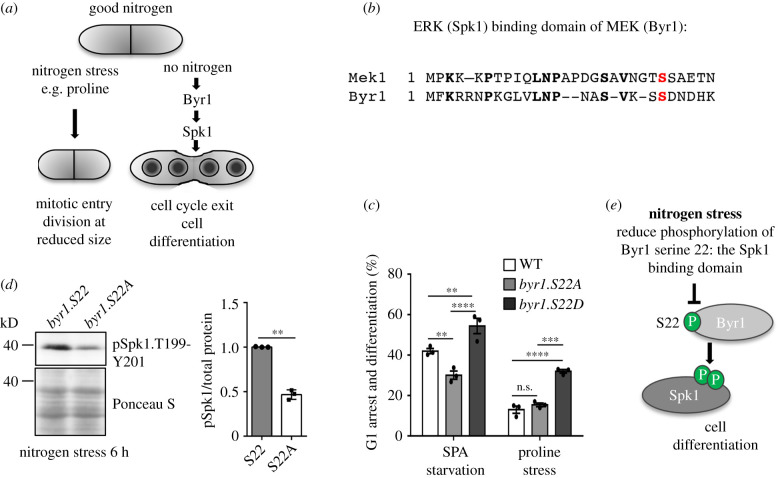
Fluctuations in TOR, AMPK and MAP-kinase signalling maintain cellular homeostasis and coordinate growth and division with environmental context. We have applied quantitative, SILAC mass spectrometry to map TOR and nutrient-controlled signalling in the fission yeast Schizosaccharomyces pombe. Phosphorylation levels at more than 1000 sites were altered following nitrogen stress or Torin1 inhibition of the TORC1 and TORC2 networks that comprise TOR signalling. One hundred and thirty of these sites were regulated by both perturbations, and the majority of these (119) new targets have not previously been linked to either nutritional or TOR control in either yeasts or humans. Elimination of AMPK inhibition of TORC1, by removal of AMPKα (ssp2::ura4+), identified phosphosites where nitrogen stress-induced changes were independent of TOR control. Using a yeast strain with an ATP analogue-sensitized Cdc2 kinase, we excluded sites that were changed as an indirect consequence of mitotic control modulation by nitrogen stress or TOR signalling. Nutritional control of gene expression was reflected in multiple targets in RNA metabolism, while significant modulation of actin cytoskeletal components points to adaptations in morphogenesis and cell integrity networks. Reduced phosphorylation of the MAPKK Byr1, at a site whose human equivalent controls docking between MEK and ERK, prevented sexual differentiation when resources were sparse but not eliminated.

Keywords: Byr1 MAPKK; TORC1; TORC2; fission yeast Schizosaccharomyces pombe; nitrogen stress; phosphoproteome.


Figures

Figure 1.
Figure 1.
Overview of experimental perturbations. (ad) Overview of strategy to identify nitrogen and TOR-regulated phosphorylation sites. Specific pathways that will be inhibited by the indicated perturbation are shown in grey for each panel. (a) Nitrogen stress: a change from a good (glutamate) to a poor (proline) nitrogen source, transiently activates AMPK, which, in turn, inhibits TORC1 to accelerate mitotic entry and cell division continues at reduced cell size. Nitrogen stress does not inhibit TORC2 [7]. Removal of arginine and lysine also generates amino acid stress. (b) The ssp2::ura4+ AMPKα deletion strain ‘freezes’ nitrogen stress signalling prior to TORC1 inhibition and the ensuing increase in mitotic commitment that would otherwise arise from TORC1 inhibition. (c) Addition of Torin1 to glutamate grown cells blocks both TORC1 and TORC2 signalling. (d) To block mitotic commitment as we imposed nitrogen and amino acid stress, the ATP analogue 3BrB-PP1 was added to the cdc2.asM17 mutant (CDK1) [21].
Figure 2.
Figure 2.
Similar levels of enrichment and reduction in phosphorylation level throughout the phosphoproteomes. (ac) Significant changes to phosphorylation of specific phosphorylation sites greater than or equal to 2×, p ≤ 0.05 after 30 min perturbation compared to unstressed control are plotted as volcano plots for the individual perturbations indicated, data points listed within boxes falls outside plotted ranges. (Right) Venn diagrams illustrate the number of re-identifications of the same phosphorylation site or protein. (a,b) For each biological duplicate of the Torin1-treated culture and nitrogen-stressed wild-type culture, phosphorylation at approximately 200 sites changed. Twenty-seven per cent and 20% of the sites, respectively, were identified again in the repeat experiment. (c) Phosphorylation at 350 sites for each biological duplicate fluctuated when cell division was arrested during the nitrogen stress by Cdc2 inhibition in the cdc2.asM17 background and 50% were identified again in the repeat experiment. Specific information for all sites is listed in electronic supplementary material, data tables S2–S8.
Figure 3.
Figure 3.
Sites regulated by nitrogen stress in the absence of AMPK activation and TORC1 inhibition and overview of overlap between individual datasets. (a) Significant changes to sites of specific phosphorylation greater than or equal to 2×, p ≤ 0.05 after 30 min nitrogen stress (change of nitrogen source from glutamate to proline) compared to unstressed control of the ssp2::ura4+ (AMPK α) deletion strain is plotted as volcano plots. (Left) The number of specific phosphorylation sites and proteins identified are indicated. Specific information for all sites are listed in electronic supplementary material, data table S6. (b) The number of sites at which phosphorylation was either enhanced (upregulated) or reduced (downregulated) for each perturbation dataset. Venn diagrams were used to compare all specific phosphorylation sites identified for each perturbation. The numbers of re-identification of the same specific phosphorylation site in different datasets are shown in regions of overlap. Red boxes highlight specific phosphorylation sites that are regulated by nitrogen stress or Torin1 and also when Cdc2 is simultaneously inhibited to block mitotic entry. Specific information for these 79 sites is listed in table 2 and electronic supplementary material, data table S11.
Figure 4.
Figure 4.
Phosphorylation sites changing upon nitrogen stress are enriched on proteins regulating the actin cytoskeleton, transport and ribosome biogenesis. (a) The number of specific phosphorylation sites that are up or downregulated upon nitrogen stress of ssp2::ura4+ is shown. GO-term analysis (Princeton GOTermMapper) indicated which biological processed these proteins have been classified as participating in. (b) Specific changes to phosphorylation of specific phosphorylation sites only identified following nitrogen–stress of ssp2::ura4+ (greater than or equal to 2×, p ≤ 0.05) are plotted on a volcano plots with examples of specific proteins labelled. The red box highlights the AMPK β subunit Amk2 which is analysed further in (c). (c) Small pilot time-resolved mass spec analysis of Fold change to Amk2 serine 55 phosphorylation compared to DMSO controls, when Torin1 is added to wild-type or a TORC1-torin1-resistant mutant. Specific information for all sites are listed in electronic supplementary material, data tables S12 and S13.
Figure 5.
Figure 5.
Prediction of likely nitrogen, TORC1 or TORC2 dependencies for ‘non-cell-cycle-regulated’ proteins. (a) All significantly nitrogen and Torin1-regulated substrates were compared to published datasets, that included information about cell cycle regulation and substrates of mitotic kinases, to identify ‘non-cell-cycle-regulated’ proteins with fluctuating phosphorylation sites among our datasets. The Venn diagram compares the overlap of proteins with fluctuating phosphorylation sites from each perturbation. (b) The upper images illustrate the reasoning behind grouping proteins into three groups of potential: nitrogen-regulated, TORC1-dependent and TORC2-dependent regulations. All ‘non-cell-cycle’ substrates regulated by nitrogen (from nitrogen stress of wild-type, ssp2::ura4+ and cdc2.asM17) were grouped in the lower Venn diagram to compare these with all Torin1-regulated substrates.
Figure 6.
Figure 6.
Volcano plots of specific phosphorylation sites likely to be regulated by nitrogen, TORC1 or TORC2. (ac) Specific changes to phosphorylation of ‘non-cell-cycle’-regulated proteins, belonging to the three groups identified in figure 5b: (a) nitrogen-stress, (b) TORC1-dependent, (c) Torin1-dependent regulation; residues greater than or equal to 2×, p ≤ 0.05 are plotted as volcano plots with perturbation from which they were identified (grey, nitrogen stress of wild-type; red, nitrogen stress of cdc2.asM17; blue, nitrogen stress of ssp2::ura4+) and examples of specific proteins indicated. Data points listed within boxes falls outside plotted ranges. Specific information for all sites is listed in electronic supplementary material, data tables S14–S16.
Figure 7.
Figure 7.
Go-term enrichments for proteins likely to be regulated by nitrogen, TORC1 or TORC2. (ac) GO-term analysis (Princeton GOTermMapper) to identify biological function of ‘non-cell-cycle’-regulated proteins, belonging to the three groups identified in figure 5b ((a) nitrogen-stress, (b) TORC1-dependent, (c) Torin1-dependent regulation) with greater than or equal to 2×, p ≤ 0.05 fluctuating phosphorylation sites.
Figure 8.
Figure 8.
Functional validation for proteins likely to be regulated by nitrogen, TORC1 or TORC2. ‘Non-cell-cycle’ substrates belonging to the three group identified in figure 5b ((a) nitrogen-stress, (b) TORC1-dependent, (c) Torin1-dependent regulation) were compared to our published list of proteins for which the corresponding deletion strain which lacks the phosphorylated target is required for normal fitness in response to nitrogen stress or Torin1 treatment. The volcano plot illustrates significant change to phosphorylation greater than or equal to 2×, p ≤ 0.05 of ‘functional-validated’ proteins know to regulate fitness in response to nitrogen stress or following Torin1 addition to the growth media. The perturbation dataset in which each specific phosphorylation site was identified is highlighted according to the colours in the legend alongside identification of specific examples of specific proteins. Specific information for all sites are listed in table 3.
Figure 9.
Figure 9.
Reduced phosphorylation of the MAPK-binding motif of Byr1 reduce cell differentiation and sporulation. (a) A schematic that illustrates the two cell fates a cell can adopt after limitation. Following nitrogen stress (a reduction in nitrogen supply or quality), cells advance mitotic commitment and divide at reduced size. After nitrogen starvation (complete removal of a nitrogen source), cells leave the cell cycle and undergo sexual differentiation meiosis and sporulation. (b) An amino acid sequence alignment of S. pombe Byr1 and its human orthologue MEK1. Byr1 serine 22 and MEK1 serine 24 are shown in red. (c) Biological readout of Byr1 activity for phosphorylation site mutants of Byr1 serine 22 upon nitrogen starvation or nitrogen stress: an analysis of the ability to differentiate to form a zygote with 4 spores after 18 h of either nitrogen stress or nitrogen starvation on agar plates, 500 cells were counted. n = 3 with the standard error indicated. **p = 0.01; ***p ≤ 0.001 ****p ≤ 0.0001 (ANOVA, with Tukey's multiple comparison test). (d) Cells were grown in MSL to a cell density of 1.8 × 10⁶ cells ml−1 and then filtered and resuspended in prewarmed MSL minus nitrogen at same density as the original culture. Western blot analysis of total protein extracts from indicated strains after 6 h of nitrogen starvation. Phosphorylation of the Byr1 substrates Spk1 of threonine 199 and tyrosine 201, function as a biochemical readout of Byr1 MAPK kinase activity. n = 3 with the standard error indicated **p = 0.01. (Student's t-test). Ponceau S staining of the western blot membrane has been included as a loading control. (e) Schematic of the role of Byr1.S22 phosphorylation. Phosphorylation at serine 22 is diminished after nitrogen stress in order to stop cells from invoking a full commitment to sexual differentiation until the nitrogen loss is complete.

Similar articles

Cited by

References

    1. Efeyan A, Comb WC, Sabatini DM. 2015. Nutrient-sensing mechanisms and pathways. Nature 517, 302-310. (10.1038/nature14190) - DOI - PMC - PubMed
    1. Liu S, et al. 2018. Size uniformity of animal cells is actively maintained by a p38 MAPK-dependent regulation of G1-length. eLife 7, e26947. (10.7554/elife.26947) - DOI - PMC - PubMed
    1. Ginzberg MB, Chang N, D'Souza H, Patel N, Kafri R, Kirschner MW. 2018. Cell size sensing in animal cells coordinates anabolic growth rates and cell cycle progression to maintain cell size uniformity. eLife 7, e26957. (10.7554/eLife.26957) - DOI - PMC - PubMed
    1. Cadart C, et al. 2018. Size control in mammalian cells involves modulation of both growth rate and cell cycle duration. Nat. Commun. 9, 3275. (10.1038/s41467-018-05393-0) - DOI - PMC - PubMed
    1. Fantes P, Nurse P. 1977. Control of cell size at division in fission yeast by growth-modulated size control over nuclear division. Exp. Cell Res. 107, 377-386. (10.1016/0014-4827(77)90359-7) - DOI - PubMed

Publication types

MeSH terms

LinkOut - more resources