

Waking experience modulates sleep need in mice
- PMID: 33823872
- PMCID: PMC8025572
- DOI: 10.1186/s12915-021-00982-w
Waking experience modulates sleep need in mice
Abstract
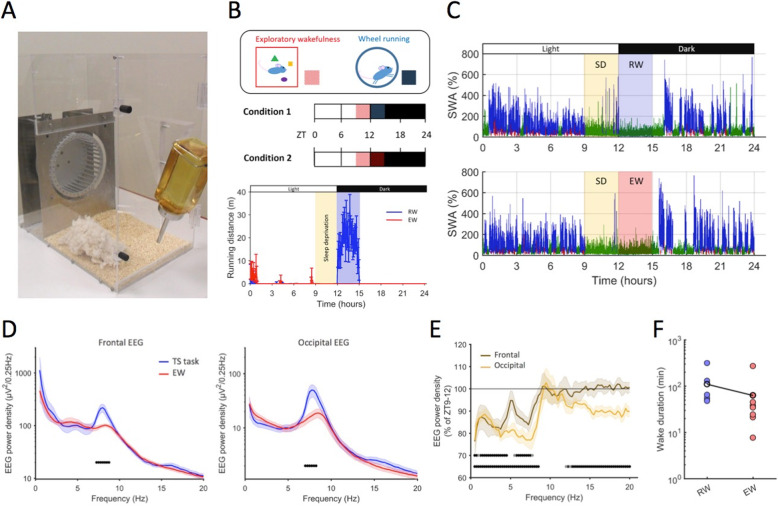
Background: Homeostatic regulation of sleep is reflected in the maintenance of a daily balance between sleep and wakefulness. Although numerous internal and external factors can influence sleep, it is unclear whether and to what extent the process that keeps track of time spent awake is determined by the content of the waking experience. We hypothesised that alterations in environmental conditions may elicit different types of wakefulness, which will in turn influence both the capacity to sustain continuous wakefulness as well as the rates of accumulating sleep pressure. To address this, we compared the effects of repetitive behaviours such as voluntary wheel running or performing a simple touchscreen task, with wakefulness dominated by novel object exploration, on sleep timing and EEG slow-wave activity (SWA) during subsequent NREM sleep.
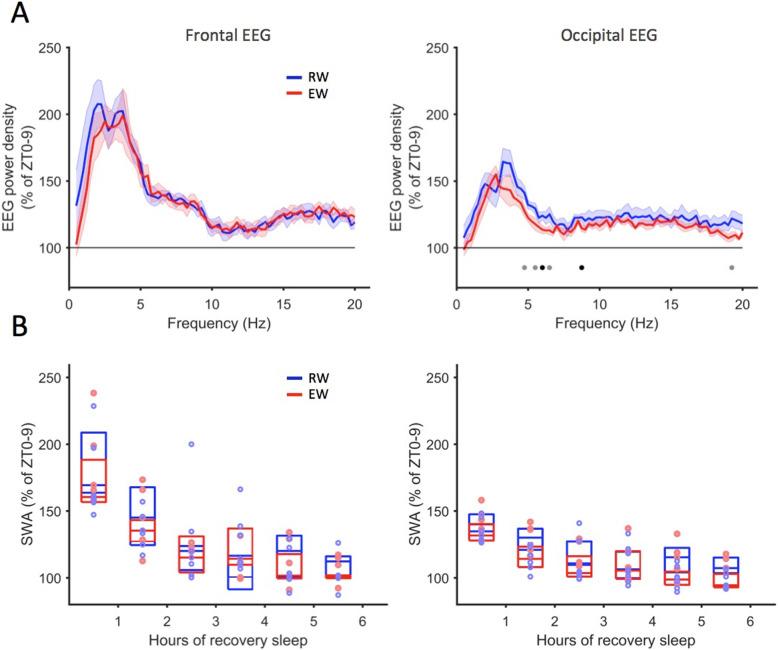
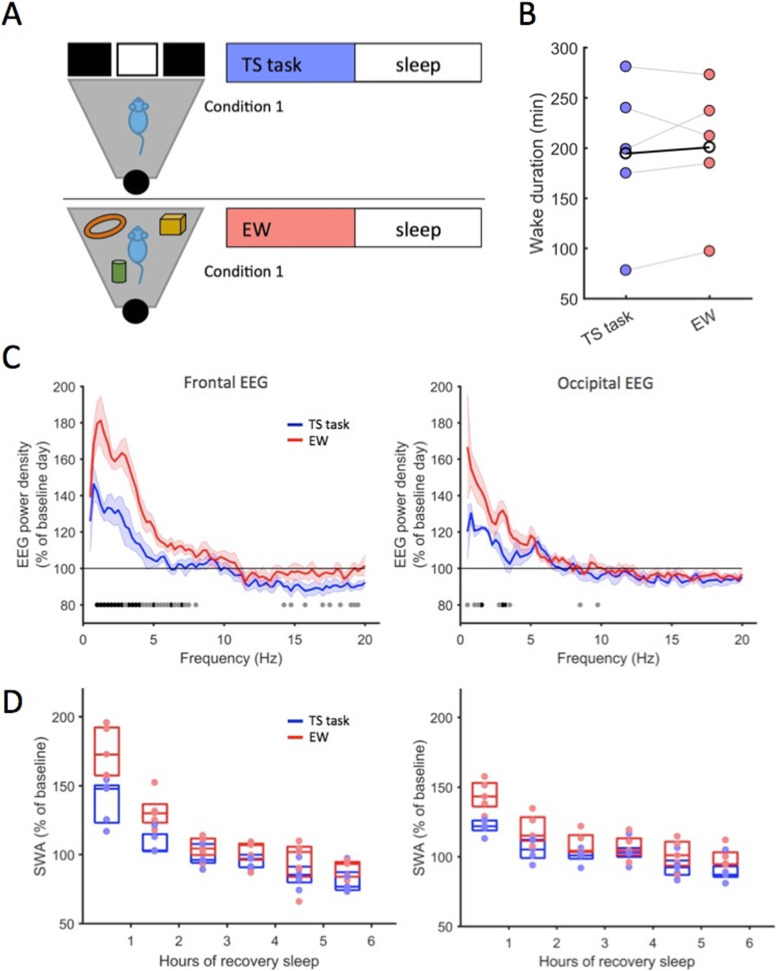
Results: We find that voluntary wheel running is associated with higher wake EEG theta-frequency activity and results in longer wake episodes, as compared with exploratory behaviour; yet, it does not lead to higher levels of EEG SWA during subsequent NREM sleep in either the frontal or occipital derivation. Furthermore, engagement in a touchscreen task, motivated by food reward, results in lower SWA during subsequent NREM sleep in both derivations, as compared to exploratory wakefulness, even though the total duration of wakefulness is similar.
Conclusion: Overall, our study suggests that sleep-wake behaviour is highly flexible within an individual and that the homeostatic processes that keep track of time spent awake are sensitive to the nature of the waking experience. We therefore conclude that sleep dynamics are determined, to a large degree, by the interaction between the organism and the environment.
Keywords: Behaviour; EEG; Exploratory behaviour; Mice; Operant behaviour; Running-wheel activity; Sleep homeostasis; Slow-wave activity; Wakefulness.
Conflict of interest statement
None of the authors has any competing interests to disclose.
Figures
Similar articles
-
Cortical region-specific sleep homeostasis in mice: effects of time of day and waking experience.Sleep. 2018 Jul 1;41(7):zsy079. doi: 10.1093/sleep/zsy079. Sleep. 2018. PMID: 29697841 Free PMC article.
-
Crepuscular rhythms of EEG sleep-wake in a hystricomorph rodent, Octodon degus.J Biol Rhythms. 1998 Feb;13(1):9-17. doi: 10.1177/074873098128999871. J Biol Rhythms. 1998. PMID: 9486839
-
Stereotypic wheel running decreases cortical activity in mice.Nat Commun. 2016 Oct 17;7:13138. doi: 10.1038/ncomms13138. Nat Commun. 2016. PMID: 27748455 Free PMC article.
-
The visual scoring of sleep and arousal in infants and children.J Clin Sleep Med. 2007 Mar 15;3(2):201-40. J Clin Sleep Med. 2007. PMID: 17557427 Review.
-
Cortical and subcortical EEG in relation to sleep-wake behavior in mammalian species.Neuropsychobiology. 1993;28(3):154-9. doi: 10.1159/000119017. Neuropsychobiology. 1993. PMID: 8278030 Review.
Cited by
-
Tinnitus: at a crossroad between phantom perception and sleep.Brain Commun. 2022 Apr 5;4(3):fcac089. doi: 10.1093/braincomms/fcac089. eCollection 2022. Brain Commun. 2022. PMID: 35620170 Free PMC article. Review.
-
Sleep and occupational performance are inseparable: Why occupational therapy practice and research should consider sleep and circadian rhythm.Br J Occup Ther. 2022 May;85(5):305-307. doi: 10.1177/03080226221089846. Epub 2022 May 9. Br J Occup Ther. 2022. PMID: 40337664 Free PMC article. No abstract available.
-
Sleep restores an optimal computational regime in cortical networks.Nat Neurosci. 2024 Feb;27(2):328-338. doi: 10.1038/s41593-023-01536-9. Epub 2024 Jan 5. Nat Neurosci. 2024. PMID: 38182837 Free PMC article.
-
Noradrenergic tone is not required for neuronal activity-induced rebound sleep in zebrafish.J Comp Physiol B. 2024 Jun;194(3):279-298. doi: 10.1007/s00360-023-01504-6. Epub 2023 Jul 22. J Comp Physiol B. 2024. PMID: 37480493 Free PMC article.
-
Local versus global sleep organization and the quest to determine sleep function.Neurobiol Sleep Circadian Rhythms. 2025 Apr 2;18(Suppl):100117. doi: 10.1016/j.nbscr.2025.100117. eCollection 2025 May. Neurobiol Sleep Circadian Rhythms. 2025. PMID: 40703581 Free PMC article.
References
-
- Borbély AA. A two process model of sleep regulation. Hum Neurobiol. 1982;1(3):195–204. - PubMed
-
- Tam SK, Bannerman DM, Peirson SN. Mechanisms mediating the effects of light on sleep and alertness: current challenges. Curr Opin Physiol. 2020;15:152–158. doi: 10.1016/j.cophys.2020.01.005. - DOI
-
- Sotelo MI, Tyan J, Dzera J, Eban-Rothschild A. Sleep and motivated behaviors, from physiology to pathology. Curr Opin Physiol. 2020;15:159–166. doi: 10.1016/j.cophys.2020.01.006. - DOI
Publication types
MeSH terms
Grants and funding
LinkOut - more resources
Full Text Sources
Other Literature Sources
