. 2021 Apr 6;22(1):96.
doi: 10.1186/s13059-021-02297-z.

Simplitigs as an efficient and scalable representation of de Bruijn graphs

Affiliations

Simplitigs as an efficient and scalable representation of de Bruijn graphs

Karel Břinda et al. Genome Biol. .

Abstract

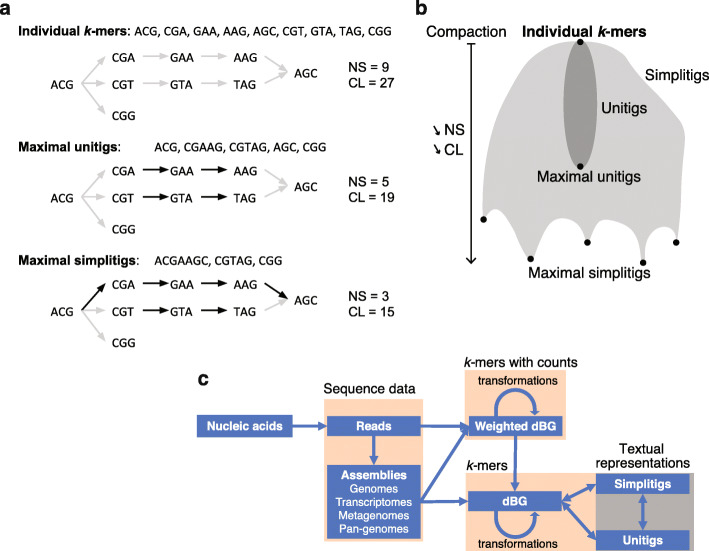
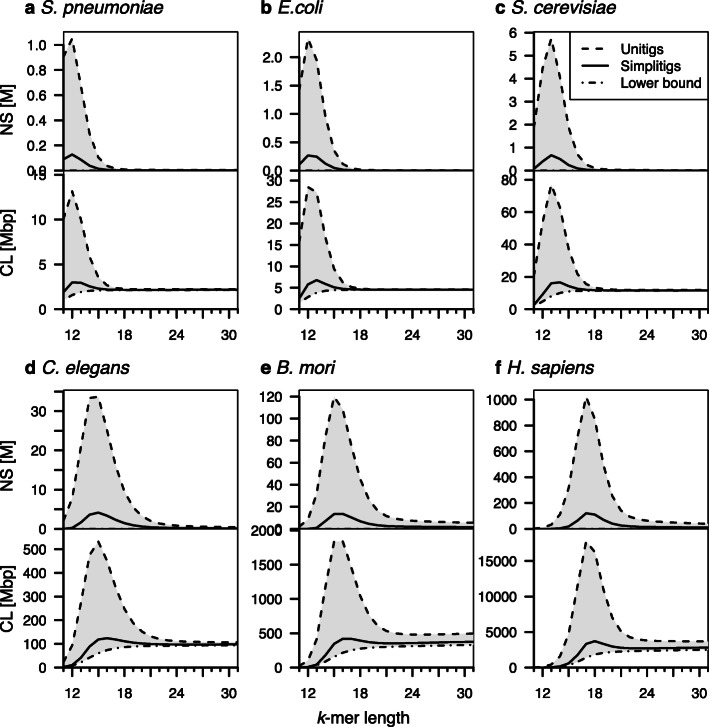
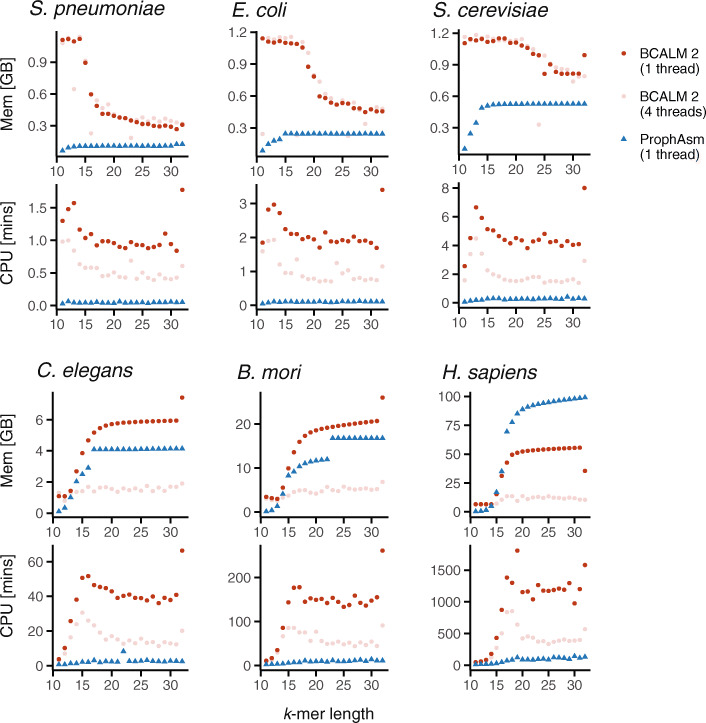
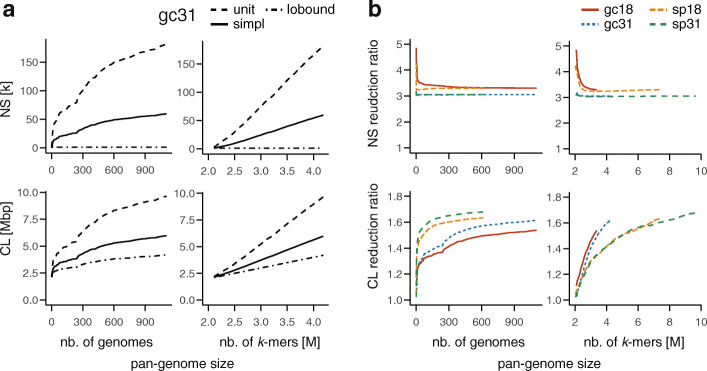
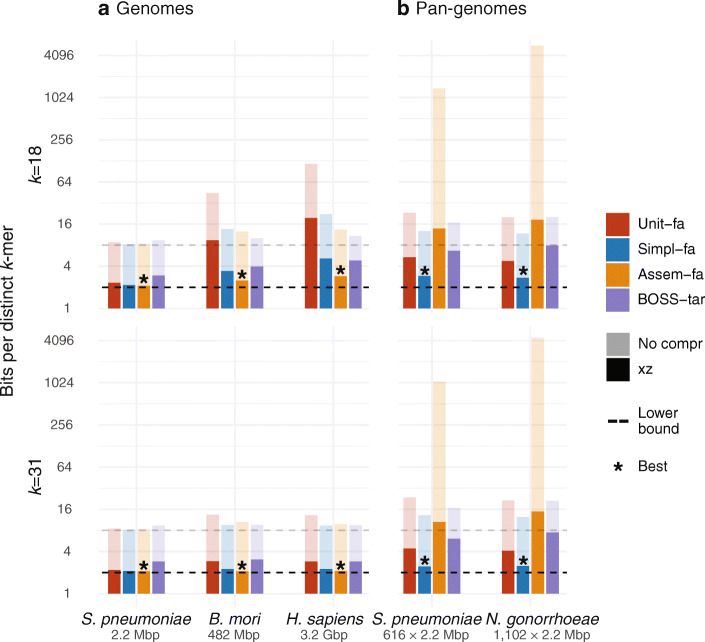
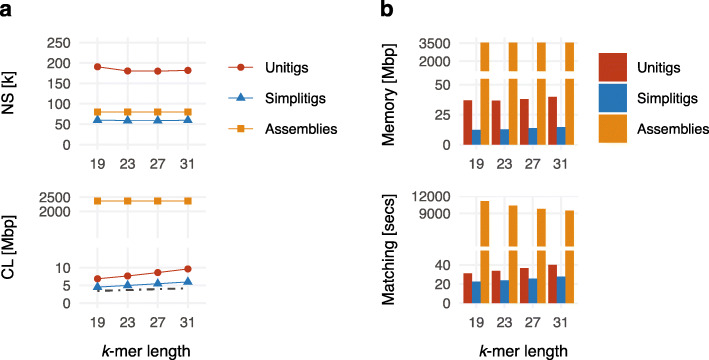
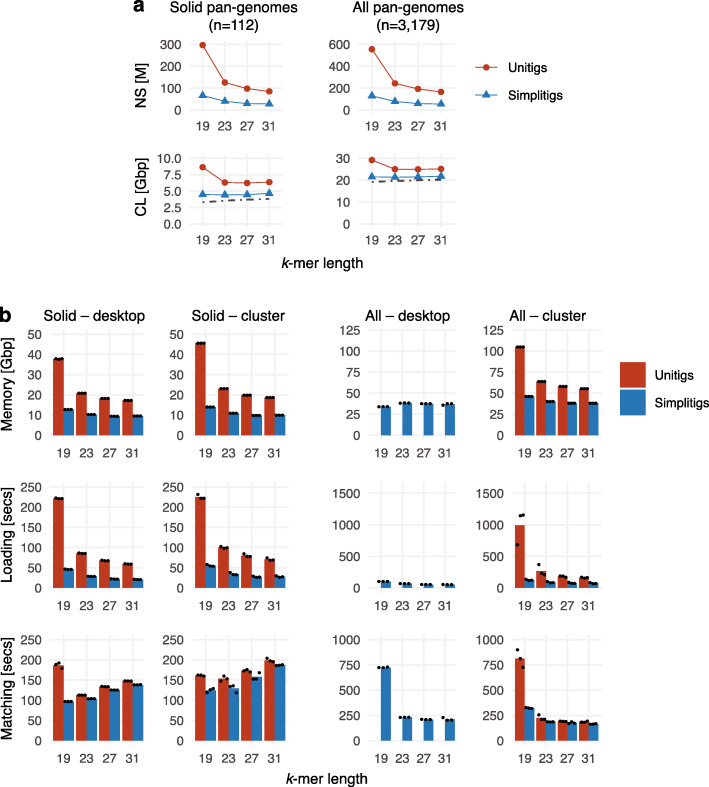
de Bruijn graphs play an essential role in bioinformatics, yet they lack a universal scalable representation. Here, we introduce simplitigs as a compact, efficient, and scalable representation, and ProphAsm, a fast algorithm for their computation. For the example of assemblies of model organisms and two bacterial pan-genomes, we compare simplitigs to unitigs, the best existing representation, and demonstrate that simplitigs provide a substantial improvement in the cumulative sequence length and their number. When combined with the commonly used Burrows-Wheeler Transform index, simplitigs reduce memory, and index loading and query times, as demonstrated with large-scale examples of GenBank bacterial pan-genomes.

Keywords: Data compression; Indexing; Pan-genomes; Scalability; Sequence analysis; Simplitigs; Storage; de Bruijn graph representation; de Bruijn graphs; k-mers.


Conflict of interest statement

The authors declare that they have no competing interests.

Figures

Fig. 1
Fig. 1
Overview of the simplitig approach. a Textual representations of k-mer sets ordered by the degree of compaction: individual k-mers, maximal unitigs, and maximal simplitigs. Every component of a simplitig subgraph (black arrows) of the de Bruijn graph (all arrows) corresponds to a path, and its spelling constitutes a simplitig (the “Methods” section). b Scheme of all possible simplitig representations according to the degree of compaction. While unitigs (dark gray area) correspond to compaction along non-branching nodes in the associated de Bruijn graph, simplitigs (gray area) can also contain branching nodes. Every step of compaction decreases the number of sequences (NS) and their cumulative length (CL) by 1 and by k − 1, respectively. Maximal simplitigs may not be determined uniquely; the simplitig representation can have multiple local optima, depending on which edges were selected at the branching nodes. c The workflow of simplitigs. Simplitigs represent de Bruijn graphs and carry implicitly the same information as unitigs. de Bruijn graphs are usually computed from either assemblies or weighted de Bruijn graphs. Weighted de Bruijn graphs are typically obtained by k-mer counting and allow removing noise, e.g., low-frequency k-mers, which frequently originate in sequencing errors
Fig. 2
Fig. 2
Comparison of the simplitig and unitig representations for selected model organisms and a range of k-mers. The number of sequences (NS, millions) and their cumulative length (CL, megabase pairs) for both representations of six model organisms ordered by their genome size. a Streptococcus pneumoniae, 2.22 Mbp. b Escherichia coli, 4.64 Mbp. c Saccharomyces cerevisiae, 12.2 Mbp. d Caenorhabditis elegans, 100 Mbp. e Bombyx mori, 482 Mbp. f Homo sapiens, 3.21 Gbp. The CL lower bound corresponds to the number of k-mers. Full results are available in Additional file 1: Table S1–S6
Fig. 3
Fig. 3
Comparison of CPU time and memory consumption of ProphAsm and BCALM. Resources to compute unitigs using BCALM (using one and four threads) and simplitigs using ProphAsm (using one thread) of the six model organisms. Full results are available in Additional file 2: Table S7
Fig. 4
Fig. 4
Scaling of simplitigs and unitigs of bacterial pan-genomes as the pan-genome size grows with a better sampling and more within-species variation. a Number of sequences (NS, thousands) and their cumulative length (CL, megabase pairs) for simplitigs (simpl) and unitigs (unit) and the lower bound (lobound) of N. gonorrhoeae and k = 31, as a function of the number of genomes (left) and k-mers (right, millions) included. b Reduction ratio of simplitigs over unitigs for S. pneumoniae (sp) and N. gonorrhoeae (gc) and k = 18, 31, as a function of the number of genomes (left) and k-mers (right, millions) included. Full results are available in Additional file 3: Table S11–S14
Fig. 5
Fig. 5
Comparison of compression rates of de Bruijn graphs of a genomes of model organisms and b bacterial pan-genomes, using unitigs, simplitigs, assemblies, and BOSS. The first three representations (text-based) were encoded as cleaned FASTA files, and the BOSS file was obtained as a tar file of all Themisto index files. The compression capabilities of individual representations were compared in terms of the number of bits per distinct k-mer for k = 18 (top part) and k = 31 (bottom part). The results are shown on a logarithmic scale, jointly for uncompressed files (light colors) and files compressed using xz (full colors), together with the lower bounds (8 and 2 bits per k-mer for uncompressed and compressed textual representations, respectively). Full results are available in Additional file 4: Table S15.
Fig. 6
Fig. 6
k-mer queries for the N. gonorrhoeae pan-genome on top of the draft assemblies, unitigs, and simplitigs. a Characteristics of the obtained unitigs and simplitigs: number of sequences (NS, thousands) and their cumulative length (CL, megabase pairs). The dot-dash line depicts the CL lower bound corresponding to the number of k-mers. b Memory footprint and time to match 10 million k-mers using BWA. Full results including relative improvements are available in Additional file 5: Table S17–S18
Fig. 7
Fig. 7
k-mer queries for multiple pan-genomes indexed simultaneously. Bacterial pan-genomes were computed from the complete GenBank assemblies per individual species. While the All dataset comprises all pan-genomes with no restriction on their size, the Solid dataset comprises only those that contain at least 11 genomes. a Characteristics of the obtained unitigs and simplitigs: number of sequences (NS, millions) and their cumulative length (CL, gigabase pairs). The dot-dash line depicts the lower bound corresponding to the number of k-mers. b Memory footprint, time of index loading, and time of matching 10 million k-mers using BWA. The bars correspond to the mean of three measurements (black dots). Full results including relative improvements are available in Additional file 6: Table S19–S23

Similar articles

Cited by

References

    1. Needleman SB, Wunsch CD. A general method applicable to the search for similarities in the amino acid sequence of two proteins. J Mol Biol. 1970;48:443–453. doi: 10.1016/0022-2836(70)90057-4. - DOI - PubMed
    1. Smith TF, Waterman MS. Identification of common molecular subsequences. J Mol Biol. 1981;147:195–197. doi: 10.1016/0022-2836(81)90087-5. - DOI - PubMed
    1. Gotoh O. An improved algorithm for matching biological sequences. J Mol Biol. 1982;162:705–708. doi: 10.1016/0022-2836(82)90398-9. - DOI - PubMed
    1. Idury RM, Waterman MS. A new algorithm for DNA sequence assembly. J Comput Biol. 1995;2:291–306. doi: 10.1089/cmb.1995.2.291. - DOI - PubMed
    1. Pevzner PA. 1-tuple DNA sequencing: computer analysis. J Biomol Struct Dyn. 1989;7:63–73. doi: 10.1080/07391102.1989.10507752. - DOI - PubMed

Publication types

LinkOut - more resources