Case Reports
. 2021 Apr 6;13(1):70.
doi: 10.1186/s13148-021-01048-y.

Differential methylation EPIC analysis discloses cisplatin-resistance related hypermethylation and tumor-specific heterogeneity within matched primary and metastatic testicular germ cell tumor patient tissue samples

Affiliations
Case Reports

Differential methylation EPIC analysis discloses cisplatin-resistance related hypermethylation and tumor-specific heterogeneity within matched primary and metastatic testicular germ cell tumor patient tissue samples

João Lobo et al. Clin Epigenetics. .

Abstract

Testicular germ cell tumors (TGCTs) are among the most common solid malignancies in young-adult men, and currently most mortality is due to metastatic disease and emergence of resistance to cisplatin. There is some evidence that increased methylation is one mechanism behind this resistance, stemming from individual studies, but approaches based on matched primary and metastatic patient samples are lacking. Herein, we provide an EPIC array-based study of matched primary and metastatic TGCT samples. Histology was the major determinant of overall methylation pattern, but some clustering of samples related to response to cisplatin was observed. Further differential analysis of patients with the same histological subtype (embryonal carcinoma) disclosed a remarkable increase in net methylation levels (at both promoter and CpG site level) in the patient with cisplatin-resistant disease and poor outcome compared to the patient with complete response to chemotherapy. This further confirms the recent results of another study performed on isogenic clones of sensitive and resistant TGCT cell lines. Differentially methylated promoters among groups of samples were mostly not shared, disclosing heterogeneity in patient tissue samples. Finally, gene ontology analysis of cisplatin-resistant samples indicated enrichment of differentially hypermethylated promoters on pathways related to regulation of immune microenvironment, and enrichment of differentially hypomethylated promoters on pathways related to DNA/chromatin binding and regulation. This data supports not only the use of hypomethylating agents for targeting cisplatin-resistant disease, but also their use in combination with immunotherapies and chromatin remodelers.

Keywords: Cisplatin; DNA methylation; EPIC array; Metastasis; Testicular germ cell tumors.


Conflict of interest statement

The authors declare that they have no competing interests.

Figures

Fig. 1
Fig. 1
Principal component analysis of samples included in the study and histological characterization. a, b Scatter plots showing the samples' coordinates on principal components, according to individual CpG sites (a) and promoters (b). Samples are colored based on being a primary or metastatic tumor. The histological subtypes are given by the abbreviations: SE—seminoma, EC—embryonal carcinoma, YST—yolk sac tumor, TE—teratoma. Samples from the same patient were encircled together. c Histological representation of each sample included (×200 magnification)
Fig. 2
Fig. 2
Unsupervised hierarchical clustering of samples based on all methylation values at CpG site (a) and promoter (b) level. The heatmap displays only selected sites/regions with the highest variance across all samples. Notice distinct clustering of samples from patient #1. Also, notice higher methylation density represented by higher beta values at certain CpG sites (upper right corner) and promoters (lower right corner) for patient #3 compared to patient #4 samples. For CpG site clustering, CGI relation is given on the left side of the heatmap
Fig. 3
Fig. 3
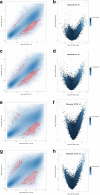
Scatterplots of the mean beta values (a, c, e, g) and volcano plots of each pairwise comparison (b, d, f, h) related to differential methylation across histologies, at the promoter level. a, b Non-seminoma–seminoma; c, d Embryonal carcinoma–seminoma; e, f Yolk sac tumor/teratoma–Seminoma; g, h Yolk sac tumor/teratoma–embryonal carcinoma. In the scatterplots, the transparency corresponds to point density. Blue points represent differentially methylated sites (according to the combined rank criteria, see Methods). Red dots represent the 1000 best ranking sites. In the volcano plots, dots are colored according to combined rank, and the yy axis represents the combined p values. EC embryonal carcinoma, SE seminoma, TE teratoma, YST yolk sac tumor
Fig. 4
Fig. 4
Venn diagrams analyses displaying the common and differentially hypermethylated (a, c) and hypomethylated (b, d) promoters shared by different histological subtype comparisons (a, b) and between primary-metastasis pairs belonging to different patients (c, d)
Fig. 5
Fig. 5
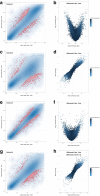
Scatterplots of the mean beta values (a, c, e, g) and volcano plots of each pairwise comparison (b, d, f, h) related to differential methylation among matched primary and metastatic samples, at the promoter level. a, b) patient #1; c, d) patient #2; e, f patient #3; g, h patient #4. In the scatterplots, the transparency corresponds to point density. Blue points represent differentially methylated sites (according to the combined rank criteria, see “Methods”). Red dots represent the 1000 best ranking sites. In the volcano plots, dots are colored according to combined rank, and the yy axis represents the combined p values (or the mean quotient log2 when comparing two samples). Met metastatic samples, Prim primary tumor samples
Fig. 6
Fig. 6
Scatterplot of the of the mean beta values (a) and volcano plot of the pairwise comparison (b) related to differential methylation among embryonal carcinoma patients with different outcome and response to cisplatin, at the promoter level. In the scatterplot, the transparency corresponds to point density. Blue points represent differentially methylated sites (according to the combined rank criteria, see Methods). Red dots represent the 1000 best ranking sites. In the volcano plot, dots are colored according to combined rank, and the yy axis represents the combined p values of a given site. CispR cisplatin resistant behavior, CispS cisplatin sensitive behavior

Similar articles

Cited by

References

    1. Lobo J, Gillis AJM, Jeronimo C, Henrique R, Looijenga LHJ. Human germ cell tumors are developmental cancers: impact of epigenetics on pathobiology and clinic. Int J Mol Sci. 2019;20(2):65. doi: 10.3390/ijms20020258. - DOI - PMC - PubMed
    1. Oosterhuis JW, Looijenga LHJ. Human germ cell tumours from a developmental perspective. Nat Rev Cancer. 2019;19(9):522–537. doi: 10.1038/s41568-019-0178-9. - DOI - PubMed
    1. Honecker F, Aparicio J, Berney D, Beyer J, Bokemeyer C, Cathomas R, et al. ESMO consensus conference on testicular germ cell cancer: diagnosis, treatment and follow-up. Ann Oncol. 2018;29(8):1658–86. doi: 10.1093/annonc/mdy217. - DOI - PubMed
    1. Lakshminarasimhan R, Liang G. The role of DNA methylation in cancer. Adv Exp Med Biol. 2016;945:151–172. doi: 10.1007/978-3-319-43624-1_7. - DOI - PMC - PubMed
    1. Constancio V, Nunes SP, Henrique R, Jeronimo C. DNA methylation-based testing in liquid biopsies as detection and prognostic biomarkers for the four major cancer types. Cells. 2020;9(3):558. doi: 10.3390/cells9030624. - DOI - PMC - PubMed

Publication types

MeSH terms