. 2021 Apr 6;12(2):e00129-21.
doi: 10.1128/mBio.00129-21.

Identification of Metabolically Quiescent Leishmania mexicana Parasites in Peripheral and Cured Dermal Granulomas Using Stable Isotope Tracing Imaging Mass Spectrometry

Affiliations

Identification of Metabolically Quiescent Leishmania mexicana Parasites in Peripheral and Cured Dermal Granulomas Using Stable Isotope Tracing Imaging Mass Spectrometry

Joachim Kloehn et al. mBio. .

Abstract

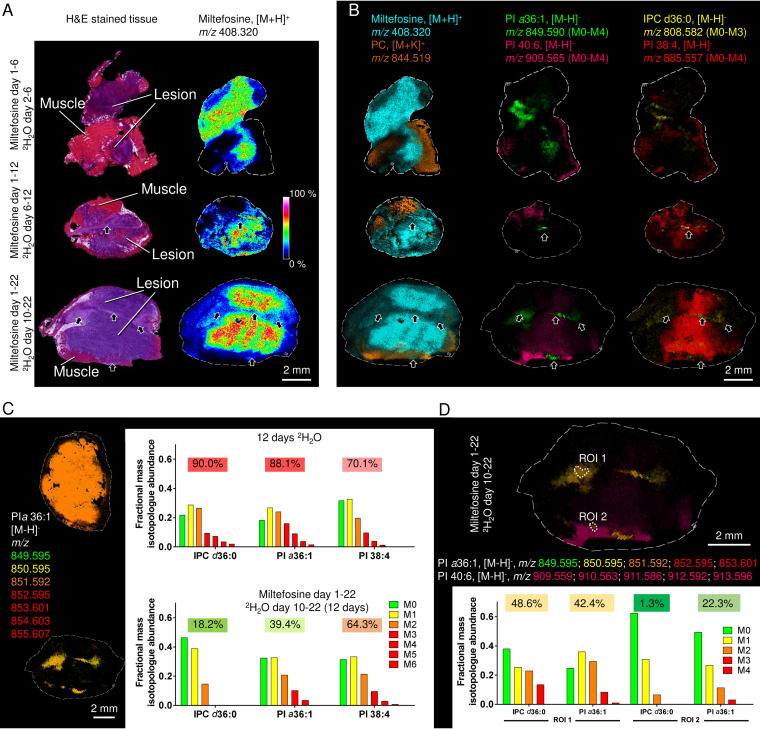
Leishmania are sandfly-transmitted protists that induce granulomatous lesions in their mammalian host. Although infected host cells in these tissues can exist in different activation states, the extent to which intracellular parasites stages also exist in different growth or physiological states remains poorly defined. Here, we have mapped the spatial distribution of metabolically quiescent and active subpopulations of Leishmania mexicana in dermal granulomas in susceptible BALB/c mice, using in vivo heavy water labeling and ultra high-resolution imaging mass spectrometry. Quantitation of the rate of turnover of parasite and host-specific lipids at high spatial resolution, suggested that the granuloma core comprised mixed populations of metabolically active and quiescent parasites. Unexpectedly, a significant population of metabolically quiescent parasites was also identified in the surrounding collagen-rich, dermal mesothelium. Mesothelium-like tissues harboring quiescent parasites progressively replaced macrophage-rich granuloma tissues following treatment with the first-line drug, miltefosine. In contrast to the granulomatous tissue, neither the mesothelium nor newly deposited tissue sequestered miltefosine. These studies suggest that the presence of quiescent parasites in acute granulomatous tissues, together with the lack of miltefosine accumulation in cured lesion tissue, may contribute to drug failure and nonsterile cure.IMPORTANCE Many microbial pathogens switch between different growth and physiological states in vivo in order to adapt to local nutrient levels and host microbicidal responses. Heterogeneity in microbial growth and metabolism may also contribute to nongenetic mechanisms of drug resistance and drug failure. In this study, we have developed a new approach for measuring spatial heterogeneity in microbial metabolism in vivo using a combination of heavy water (2H2O) labeling and imaging mass spectrometry. Using this approach, we show that lesions contain a patchwork of metabolically distinct parasite populations, while the underlying dermal tissues contain a large population of metabolically quiescent parasites. Quiescent parasites also dominate drug-depleted tissues in healed animals, providing an explanation for failure of some first line drugs to completely eradicate parasites. This approach is broadly applicable to study the metabolic and growth dynamics in other host-pathogen interactions.

Keywords: drug resistance mechanisms; granuloma; heavy water labelling; intracellular pathogens; leishmaniasis; microbial metabolism; persistence; protists.


Figures

FIG 1
FIG 1
Spatial distribution of Leishmania and host-specific phospho-/glycolipids in acute dermal granulomas. Granulomatous lesions were isolated from L. mexicana-infected BALB/c mice (7 weeks postinfection), and consecutive frozen sections were processed for H&E histology or imaging by MALDI-FTICR-MS in negative-ion mode. (A) H&E-stained longitudinal section through lesion with overlying skin and surrounding muscle tissue. (B) Spatial distribution of parasite- and host-specific lipids. The parasite-specific lipids are IPC d36:0 (m/z 808.587), PI O-38:4 (m/z 871.570), PI a36:1 (m/z 808.587), and GIPL species, Man2GlcN-PI (iM2, m/z 1,308.746). The host-specific lipids are GM1b 34:1 (m/z 1,516.788) and lyso-PI 20:4 (m/z 619.296). (C) Spatial distribution of host lipid species that localized to surrounding tissue (PI 38:4 (m/z 885.557); PI 40:6 (m/z 909.559), and GM3 38:1 (m/z 1,207.731). (D) Overlay of lipid markers unique to lesion (PI a36:1) and nonlesion (PI 40:6) tissues. (E) Average mass spectra of pixels in designated ROIs (ROI 1, lesion; ROI 2, surrounding muscle tissue) in panel D as determined by MALDI-FTICR-MS. Heat map distributions of lipids are displayed at 10 to 70% intensity (percentage of the maximum).
FIG 2
FIG 2
In vivo 2H labeling of parasite lipids in in infected mice. (A) L. mexicana-infected mice (6 to 9 weeks postinfection) were labeled at 5% 2H2O in their body water for 4 to 50 days. 2H from 2H2O is incorporated into sugars, glycerol, and lipids during gluconeogenesis, hexose isomerization, and de novo glycerol, fatty acid, and ether-lipid biosynthesis, resulting in extensive labeling of phospholipid and glycolipids, such as the GIPL, iM2. (B) Granulomas were excised and analyzed by MALDI-FTICR-MS in negative mode at 100-μm pixel spacing. The different mass isotopologues (M0 to M7) of the parasite-specific GPI glycolipids, iM2 (m/z 1,308.772) are color coded and merged to generate an isotopologue heat map (low mass isotopologues being green/yellow; high mass isotopologues being red). (C) Mass isotopologue (M0 to M8) distribution of two parasite-specific lipids (PI a36:1 and iM2) and two host-specific lipids (PI 38:4 and GM1 34:1) across the lesion section are shown, demonstrating a shift toward higher mass isotopologues with extending duration of 2H2O labeling. (D) Quantitation of fractional 2H enrichment of individual lipids with time and inferred rate of turnover (t1/2) for each lipid indicated. R2 values define the goodness of fit.
FIG 3
FIG 3
Low-level constitutive lipid turnover in nondividing stages of Leishmania and stochastic variability in intracellular amastigotes. (A) L. mexicana promastigotes in log phase or stationary growth phase were cultivated in the presence of 5% 2H2O for 24 h. Cell pellets were rapidly frozen, sectioned, and scanned by MALDI-FTICR-MS in negative mode. Each panel shows the full mass spectra and select regions of the mass spectrum covering mass isotopologues of IPC (m/z 806.558), PI a36:1 (m/z 849.590), and GIPL iM2 (m/z 1,280.722). Mass spectra of cell pellets from unlabeled promastigotes, log-phase promastigotes, and stationary-phase promastigotes are shown. 2H enrichments were quantified as the increase in the average mass over natural abundance and are indicated for each stage. (B) 2H labeling of GIPL iM2 was measured in log-phase promastigotes over a time course to determine the half-life (t1/2). (C) BMDMs were infected with L. mexicana promastigotes for 48 h and then labeled with 5% 2H2O for a further 96 h before being imaged by MALDI-FTICR-MS. The spatial distribution of the parasite-specific lipid PI a36:1 and corresponding mass isotopologues are merged to generate an isotopologue heat map. (D) Changes in fractional 2H enrichment in PI a36:1 across 20 consecutive ROIs (indicated by points X to Y on figure). Each ROI was composed of four binned pixels (100 × 100-μm laser spot/200 × 200 data point). (E) Relative abundance of mass isotopologues of two parasite (IPC 36:1 and PI a36:1) and two macrophage (PI 38:4 and GM1b) lipids in the three ROI shown in panel C. The levels of 2H enrichment are indicated above each mass isotopologue plot.
FIG 4
FIG 4
Identification of quiescent populations of L. mexicana amastigotes in regions of lesion fibrosis. (A) Expected isotopomer distributions for parasite lipids labeled in vivo in quiescent and actively growing parasite populations. (B) L. mexicana lesions were excised from infected BALB/c mice provided with regular H2O (green line) or 2H2O for 4 to 50 days, and the fractional 2H enrichment in two parasite-specific lipids (PI a36:1 and GIPL iM2) across transverse sections of different lesions was determined by MALDI-FTICR-MS. Data were extracted from four binned pixels composed of four laser spots (100 × 100-μm laser spot/200 × 200-µm data point). The number of data points varies from 18 to 32, depending on the size of the lesion. (C) Correlation in 2H enrichment in the parasite-specific (PI a36:1, blue line) and host-specific (PI 38:4; orange line) lipids in transverse sections of granulomas labeled for 4, 6, and 12 days. The correlation coefficient was determined according to the Spearman rank correlation coefficient (no correlation, −1; perfect correlation, +1). (D to G) L. mexicana-infected BALB/c mice were labeled at 5% 2H2O body water for 6 days, and consecutive sections of granulomatous tissue containing underlying dermal mesothelium were stained with H&E (D and F) or imaged by MALDI-FTICR-MS (E and G). (D) H&E-stained section of granuloma core and surrounding regions of fibrosis (fib, corresponding to mesothelium) and muscle. (E) Spatial distribution of the muscle tissue-specific lipid PI 40:6 (magenta) and the parasite-specific glycolipid iM2 (m/z 1,308.772). The different mass isotopologues (M0 to M7) of iM2 are color coded and merged to generate an isotopologue heat map. (F) Detail of a collagen-rich mesothelium layer containing infected host cells (red arrows). Images were collected from a different lesion that had been chemically fixed for improved imaging. (G) Relative abundances of different mass isotopologues of parasite-specific lipids—IPC d36:0, PI a36:1, and GIPL iM2—in the four regions of interest (ROI 1 to ROI 4) indicated in panel E. ROI 1 corresponds to the mesothelium.
FIG 5
FIG 5
Association of quiescent parasite subpopulations with areas of fibrosis induced by miltefosine treatment. (A) L. mexicana-infected BALB/c mice were treated with miltefosine for 6, 12, or 22 days and granulomatous lesions sectioned for histology (H&E) and MALDI-FTICR-MS in positive- or negative-ion mode (50-μm spatial resolution in both cases). Miltefosine ([M+H]+ ion m/z 408.320) strongly accumulated in lesion tissue compared to surrounding muscle tissue and was excluded from the mesothelium and regions of lesion fibrosis that were evident by day 22. (B) Miltefosine and host PC species (m/z 844.519) detected in positive-ion MALDI-FTICR-MS define regions of lesion and nonlesion tissue, respectively. PI a36:1 and IPC d36:0 define populations of parasites that were initially cleared from miltefosine-rich regions but persisted in fibrotic tissues after 22 days of treatment. PI 40:6 and PI 38:4 represent host-specific lipids. (C) Mice were labeled at 5% 2H2O body water for 12 days without miltefosine treatment (upper panel) or with miltefosine treatment for 22 days (lower panel). The different mass isotopologues (M0 to M6) of the parasite-specific PI a36:0 were color-coded and merged to generate an isotopologue heat map. Average mass isotopologue distribution in parasite-specific lipids (IPC d36:0 and PI a36:1) and host lipid (PI 38:4) are shown, and the 2H labeling was quantified as the increase in average mass over natural abundance. (D) Lesion from drug-treated and 2H2O-labeled mouse as in panel C. The spatial distribution of muscle tissue-specific PI 40:6 (magenta) and parasite-specific PI a36:0 is shown. The different mass isotopologues (M0 to M4) are color coded and merged to generate an isotopologue heat map. The relative abundance of different mass isotopologues of the parasite-specific lipids, IPC d36:0 and PI a36:1, in two ROIs highlight heterogeneity within parasite populations during drug treatment.

Similar articles

Cited by

References

    1. Bumann D. 2015. Heterogeneous host-pathogen encounters: act locally, think globally. Cell Host Microbe 17:13–19. doi:10.1016/j.chom.2014.12.006. - DOI - PubMed
    1. Claudi B, Sprote P, Chirkova A, Personnic N, Zankl J, Schurmann N, Schmidt A, Bumann D. 2014. Phenotypic variation of Salmonella in host tissues delays eradication by antimicrobial chemotherapy. Cell 158:722–733. doi:10.1016/j.cell.2014.06.045. - DOI - PubMed
    1. Cohen NR, Lobritz MA, Collins JJ. 2013. Microbial persistence and the road to drug resistance. Cell Host Microbe 13:632–642. doi:10.1016/j.chom.2013.05.009. - DOI - PMC - PubMed
    1. Helaine S, Cheverton AM, Watson KG, Faure LM, Matthews SA, Holden DW. 2014. Internalization of Salmonella by macrophages induces formation of nonreplicating persisters. Science 343:204–208. doi:10.1126/science.1244705. - DOI - PMC - PubMed
    1. Manina G, Dhar N, McKinney JD. 2015. Stress and host immunity amplify Mycobacterium tuberculosis phenotypic heterogeneity and induce nongrowing metabolically active forms. Cell Host Microbe 17:32–46. doi:10.1016/j.chom.2014.11.016. - DOI - PubMed

Publication types

Substances

LinkOut - more resources