. 2021 Apr 6;10(4):32.
doi: 10.1038/s41389-021-00321-2.

CARD10 cleavage by MALT1 restricts lung carcinoma growth in vivo

Affiliations

CARD10 cleavage by MALT1 restricts lung carcinoma growth in vivo

Laura Israël et al. Oncogenesis. .

Abstract

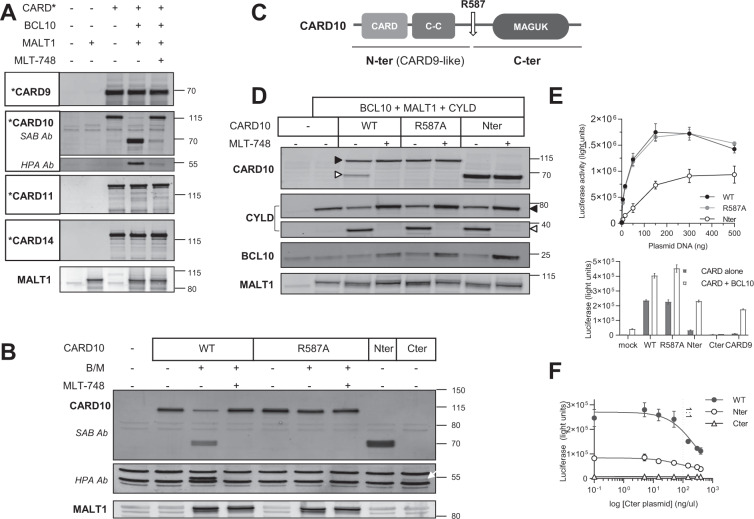
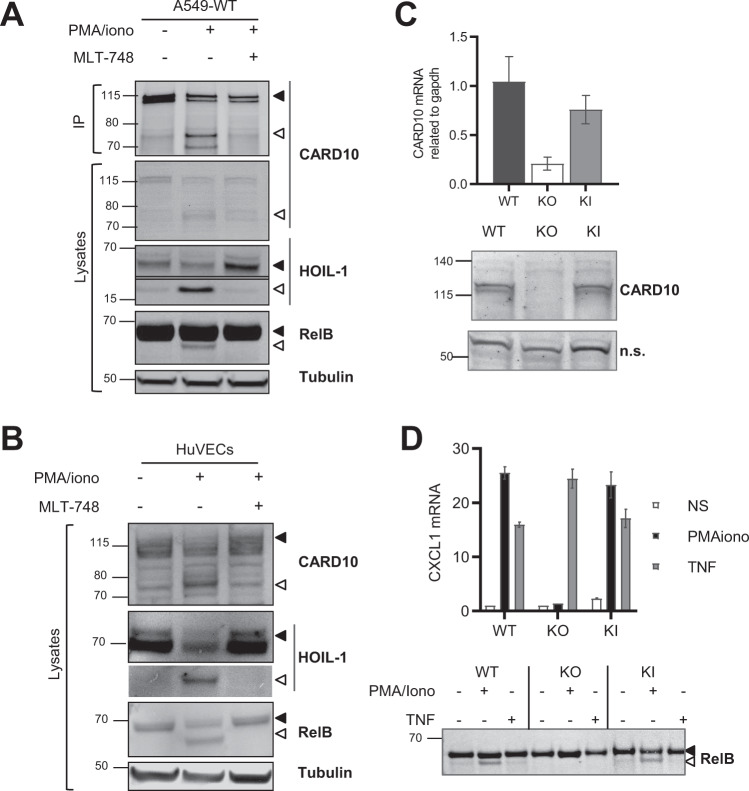
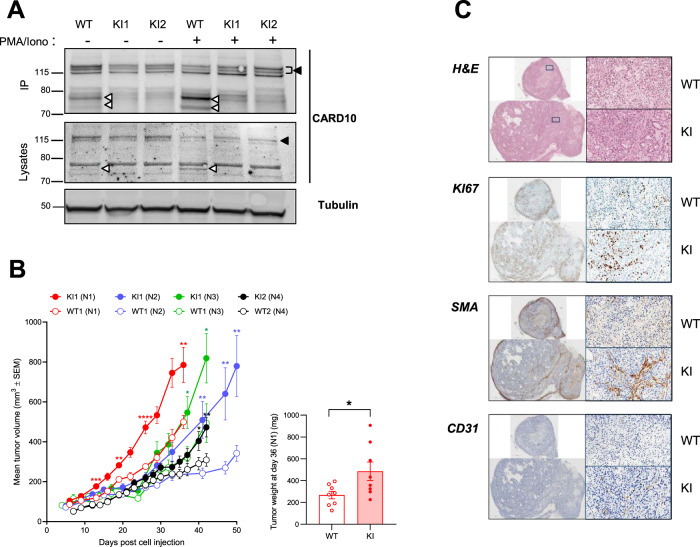
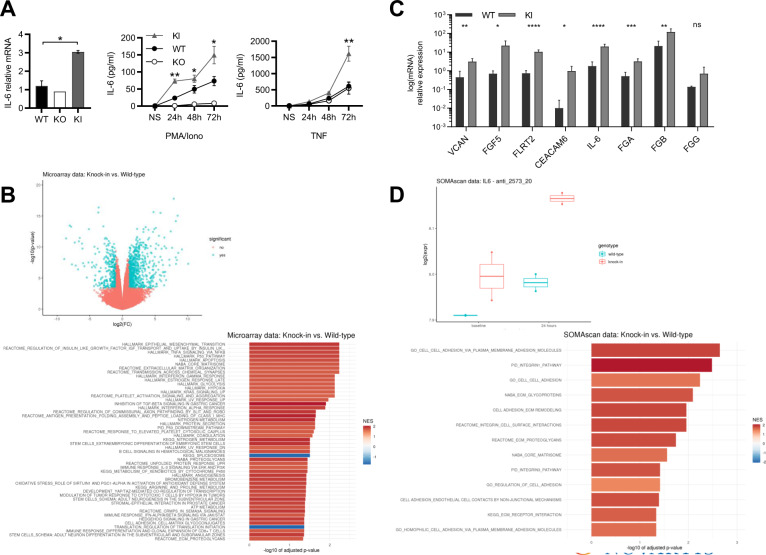
CARD-CC complexes involving BCL10 and MALT1 are major cellular signaling hubs. They govern NF-κB activation through their scaffolding properties as well as MALT1 paracaspase function, which cleaves substrates involved in NF-κB regulation. In human lymphocytes, gain-of-function defects in this pathway lead to lymphoproliferative disorders. CARD10, the prototypical CARD-CC protein in non-hematopoietic cells, is overexpressed in several cancers and has been associated with poor prognosis. However, regulation of CARD10 remains poorly understood. Here, we identified CARD10 as the first MALT1 substrate in non-hematopoietic cells and showed that CARD10 cleavage by MALT1 at R587 dampens its capacity to activate NF-κB. Preventing CARD10 cleavage in the lung tumor A549 cell line increased basal levels of IL-6 and extracellular matrix components in vitro, and led to increased tumor growth in a mouse xenograft model, suggesting that CARD10 cleavage by MALT1 might be a built-in mechanism controlling tumorigenicity.


Conflict of interest statement

The authors declare no competing interests.

Figures

Fig. 1
Fig. 1. MALT1 cleaves CARD10 at R587.
A CBM reconstitution assay in HEK 293T cells. Plasmids encoding MALT1, BCL10, and CARD* (either CARD9, CARD10, CARD11, or CARD14) were transfected in HEK 293T cells, alone or in combination, ± 1 µM of MLT-748. Western blot showing the obtained band pattern for each CARD protein. This is one of three experiments with similar results. Plasmids encoding GoF mutant forms of CARD11 and CARD14 were also tested, leading to similar results as those shown here with WT forms. B CARD10 constructs were transfected alone or co-transfected with BCL10 and MALT1 (B/M) ± 1 µM of MLT-748. The C-terminal fragment of CARD10 was unstable when overexpressed alone (Fig. 1B, last lane). This is one of three experiments with similar results. C Schematic representation of CARD10 including the protein domains and localization of the MALT1-dependent cleavage site at R587. D The CARD10 constructs were co-transfected with MALT1 and BCL10 together with the MALT1 substrate CYLD, ± 1 µM of MLT-748. Protein expression and post-activation changes were assessed by Western blot. Full-length proteins are annotated with closed triangles and cleaved fragments with open triangles. Cleaved BCL10 is difficult to detect as it is very similar in size to full length BCL10 and because it is rapidly degraded. Full length BCL10 levels are stabilized by addition of MLT-748, which indirectly accounts for BCL10 cleavage, as demonstrated previously. MALT1 self-cleavage band and mono-ubiquitinated species are visible on the membrane, accounting for stimulation in the absence or presence of a MALT1 inhibitor, respectively, as described previously. This is one of three experiments with similar results. E Top, NF-κB reporter luciferase assay after transfection of increasing concentrations of plasmids encoding either CARD10-WT (1–1032) (black filled circles), R587A-CARD10 (grey filled circles), or CARD10-Nter (1–587) (empty circles). Means ± SD of triplicates are shown (N = 4); bottom, NF-κB reporter luciferase assay after transfection of CARD10 constructs or CARD9, alone (filled bars) or together with BCL10 (empty bars). Means ± SD of triplicates are shown (N = 3). F NF-κB reporter luciferase assay upon transfection of CARD10 WT (filled circles), Nter (empty circles), or mock (empty triangles) together with increasing doses of CARD10-Cter plasmid (588–1032); the dotted line indicates the 1:1 dosed vs. tested plasmid ratio. Means ± SD of triplicates are shown (N = 4).
Fig. 2
Fig. 2. Endogenous CARD10 cleavage in A549 cells and primary HuVEC cells.
A A549 cells were treated with 5 µM of the proteasome inhibitor MG-132 and stimulated for 2 h with P/I ± 1 µM of MLT-748. CARD10 immunoprecipitation was performed and CARD10 expression assessed by Western blotting together with the two MALT1 substrates HOIL1 and RelB (N = 3). B HuVECs were treated and analyzed as done in (A) for A549 (N = 2). C CARD10 mRNA levels obtained from microarray analysis with probe 210027 (top panel). CARD10 immunoblot performed on full lysates obtained from A549-WT, -KO, and -KI cells (bottom panel). D A549-WT and KI cell lines were treated for 2 h with P/I (50 µg/ml /1 μM) or TNF (10 ng/ml) as non-CBM activation control in presence of 5 μM of MG-132. Relative quantitative PCR measurement of CXCL1 mRNA; Mean ± SD of triplicates (N = 2). RelB cleavage was then assessed by Western blot (bottom panel).
Fig. 3
Fig. 3. CARD10 cleavage at R587 controls A549 tumor growth.
A A549 cells (parental WT) or A549-KI (two clones containing the CARD10 point mutation R587A introduced by CRISPR) were treated, stimulated and analyzed for CARD10 as in Fig. 2A. Full length CARD10 and the cleaved CARD10 fragment (both as doublet resulting from differential phosphorylation) are indicated with arrowheads (N = 2). B 2x10E6 A549-WT cells or KI cells were injected into the flanks of nude mice. Tumor growth was monitored over time and is shown as mean tumor volume (mm3) ± SEM (n = 8 per group for N1, n = 11 for N2, n = 6 for N3, and n = 8 for N4), which was measured biweekly for 36–50 days. The graph shows the data from four experiments performed independently with the two A549-KI clones. At day 36 (N1 experiment), tumors were extracted and weighed (right panel). Data are reported as means ± SEM. Statistical analyses were carried out using GraphPad Prism software. Differences among groups were assessed using one-tailed Student’s t tests. P < 0.05 was considered to be statistically significant. C Histological analysis of the three biggest tumors per group (N2, described in B) was performed and the data for one representative tumor per group are shown. Tumor sections were stained with H&E for general structure, Ki67 for proliferation, smooth muscle actin (SMA) for stromal cell visualization, and msCD31 for endothelial cell content. The scale is indicated at the bottom left of every image (1 mm for full tumors and 100 µm for the 10X magnification).
Fig. 4
Fig. 4. CARD10 cleavage impacts IL-6 and extracellular matrix components.
A IL-6 mRNA levels measured by RT-PCR (left), 72h-time course of released IL-6 protein levels measured upon P/I (50 µg/ml/1 μM) (middle) or TNF (10 ng/ml) (right) stimulation. Data represent means ± SD of triplicates for two clones of each cell line (N = 3). Statistical analyses were carried out using GraphPad Prism software. Differences among groups were assessed using one-tailed Student’s t tests. P < 0.05 was considered to be statistically significant. B Upper panel, Volcano plot of differential mRNA expression in A549-WT and KI cells; microarray probe sets with an absolute log2 fold change of ≥ 1 and a false discovery rate-adjusted p ≤ 0.01 are colored in blue. Lower panel, Gene set enrichment analysis of the data shown in the upper panel. Shown are the top 50 of 69 gene sets significant at a false discovery rate < 0.05. NES Normalized Enrichment Score. Highly significant pathways were (i) cancer (p53, KRAS) (ii) inflammation (NF-κB, TNF), (iii) cancer-related processes (extracellular matrix (ECM), apoptosis, and angiogenesis), with a particular enrichment of gene sets linked to ECM regulation (matrisome, ECM organization, proteoglycans, cell adhesion-matrix glycogonjugates, and ECM proteoglycans). C Relative quantitative PCR measurement of eight selected mRNAs contributing to ECM regulation signatures at basal level in A549-WT or KI: Versican (VCAN), Fibroblast growth factor 5 (FGF5), Fibronectin Leucine Rich Transmembrane Protein 2 (FLRT2), CEA Cell Adhesion Molecule 6 (CEACAM6), Interleukin-6 (IL-6), and fibrinogen genes FGA, FGB, and FGG). Means ± SD of triplicates for two clones of each cell line are shown (N = 2). Statistical analyses were carried out as described in (A). Microarray values for the eight leading edge mRNAs (Fig. 4C) are shown in Supplementary Fig. 8. D Upper panel, Box plot of IL-6 protein levels as measured by SomaScan (SOMAmer anti_2573_20) in A549-WT and KI cells, at baseline and after a 24 h stimulation with P/I. Lower panel, Gene set enrichment analysis of longitudinal SomaScan data comparing the effects over time in A549-WT and KI cells. A selection of 124 gene sets related to ECM regulation was used. Shown are the 13 gene sets significant at a false discovery rate < 0.05; NES Normalized Enrichment Score.

References

    1. Taniguchi K., Karin M. NF-κB, inflammation, immunity and cancer: coming of age. Nat. Rev. Immunol. (2018). 10.1038/nri.2017.142. - PubMed
    1. Minina E. A. et al. Classification and nomenclature of metacaspases and paracaspases: no more confusion with caspases. Mol. Cell. (2020). 10.1016/j.molcel.2019.12.020. - PMC - PubMed
    1. Juilland M., Thome M. Holding all the CARDs: how MALT1 controls CARMA/CARD-dependent signaling. Front. Immunol. (2018). 10.3389/fimmu.2018.01927. - PMC - PubMed
    1. Staal J. et al. Ancient origin of the CARD-coiled coil/Bcl10/MALT1-like paracaspase signaling complex indicates unknown critical functions. Front Immunol (2018). 10.3389/fimmu.2018.01136. - PMC - PubMed
    1. Rosebeck S, Rehman AO, Lucas PC, Mcallister-lucas LM. From MALT lymphoma to the CBM signalosome three decades of discovery. Cell Cycle. 2011;10:2485–96. doi: 10.4161/cc.10.15.16923. - DOI - PMC - PubMed