. 2021 Apr 6;12(1):2074.
doi: 10.1038/s41467-021-22205-0.

Thiazoline-related innate fear stimuli orchestrate hypothermia and anti-hypoxia via sensory TRPA1 activation

Affiliations

Thiazoline-related innate fear stimuli orchestrate hypothermia and anti-hypoxia via sensory TRPA1 activation

Tomohiko Matsuo et al. Nat Commun. .

Abstract

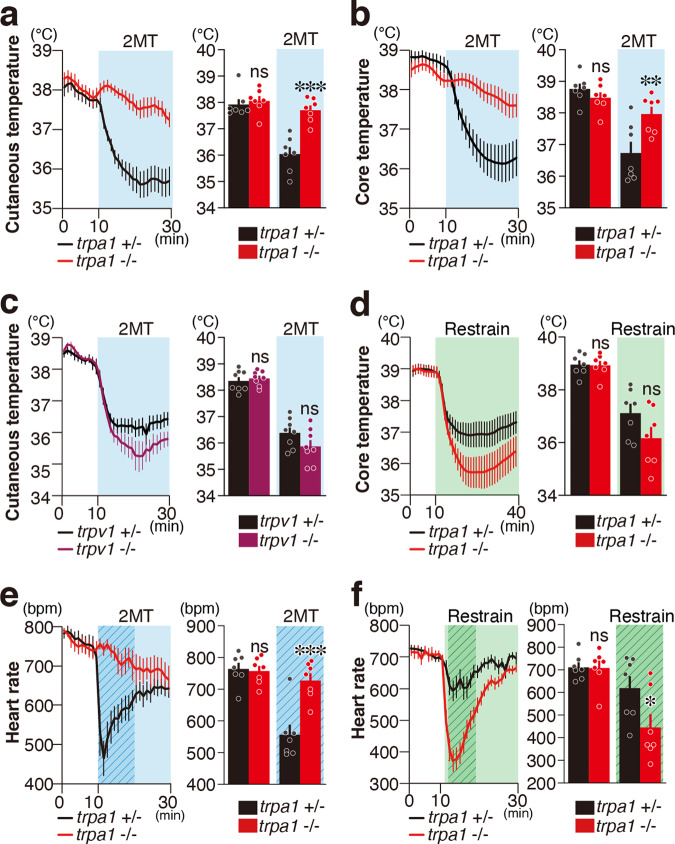
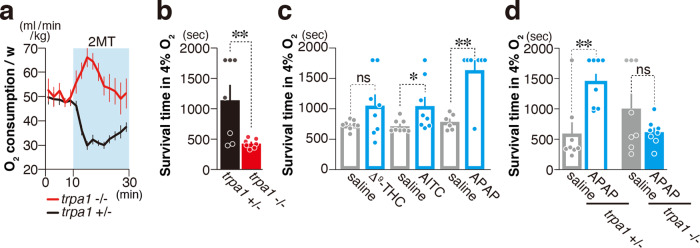
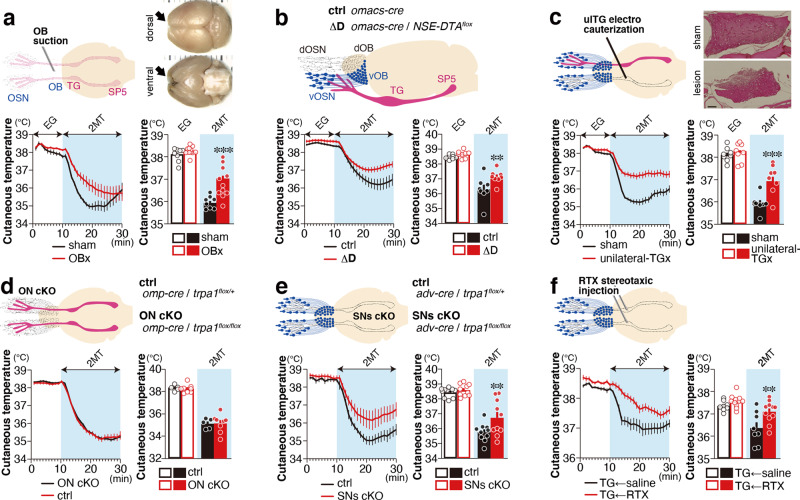
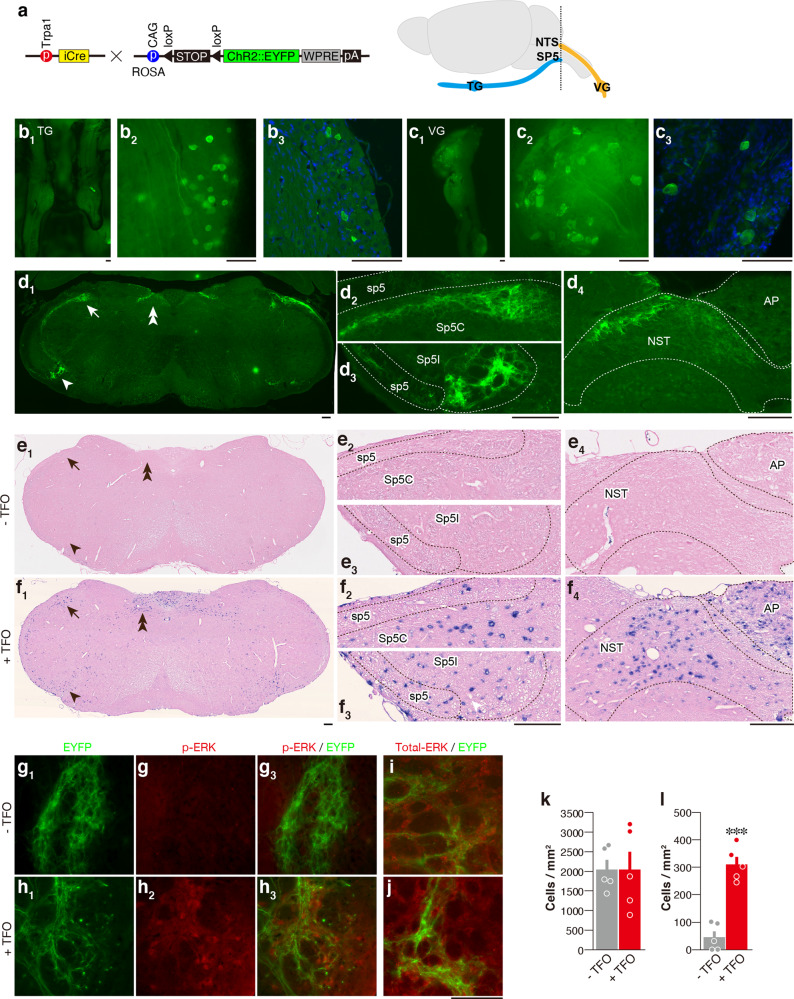
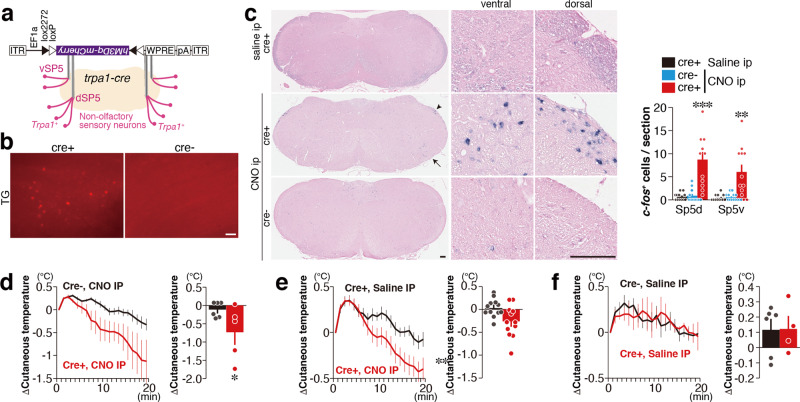
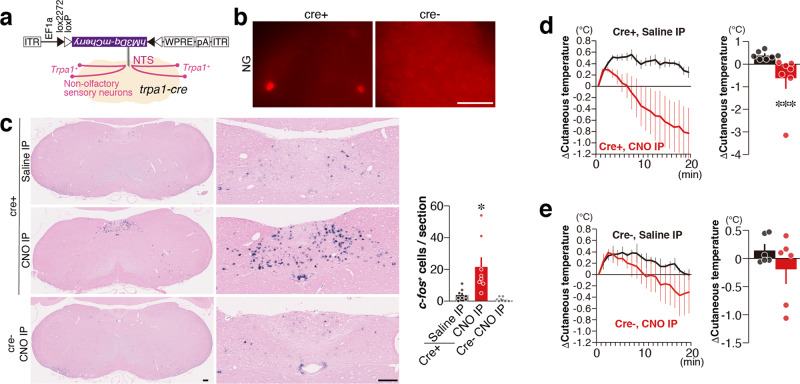
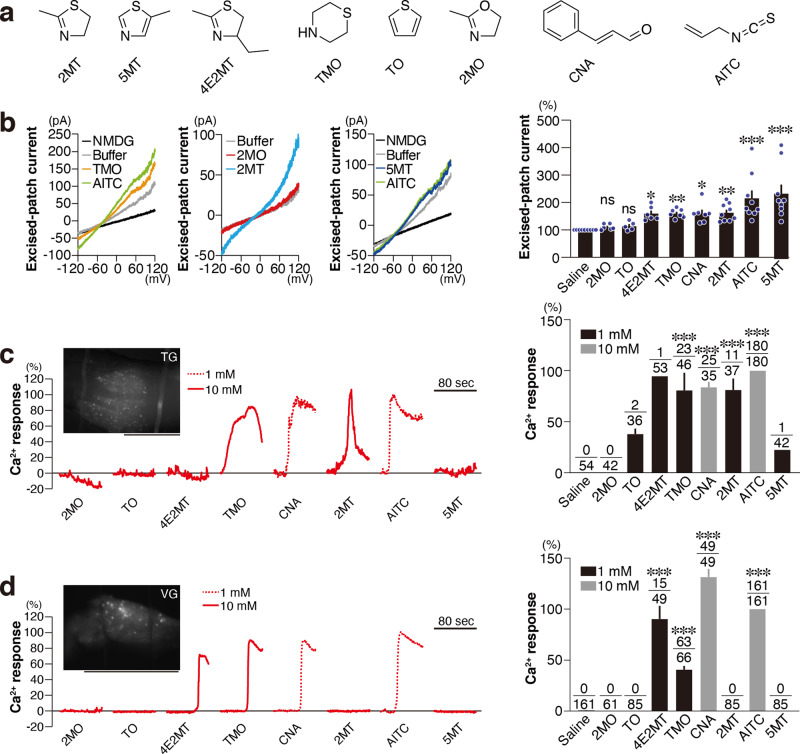
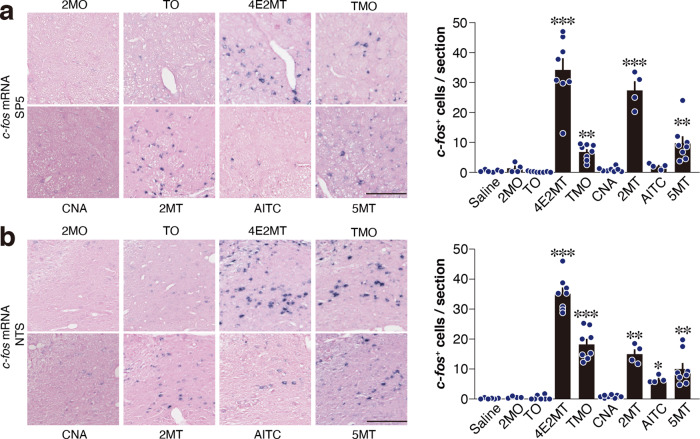
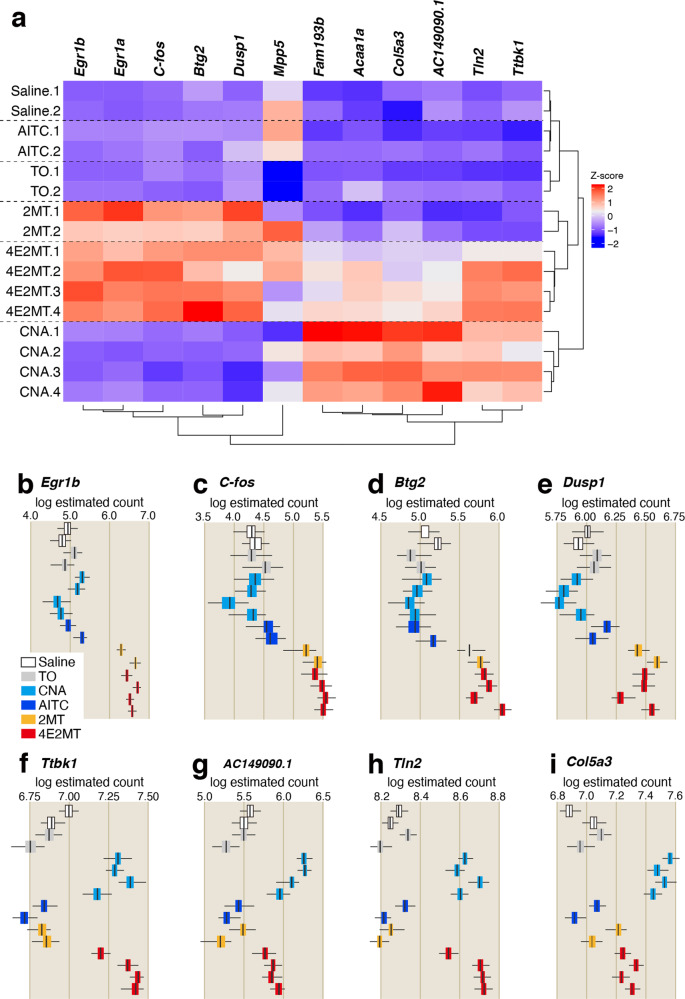
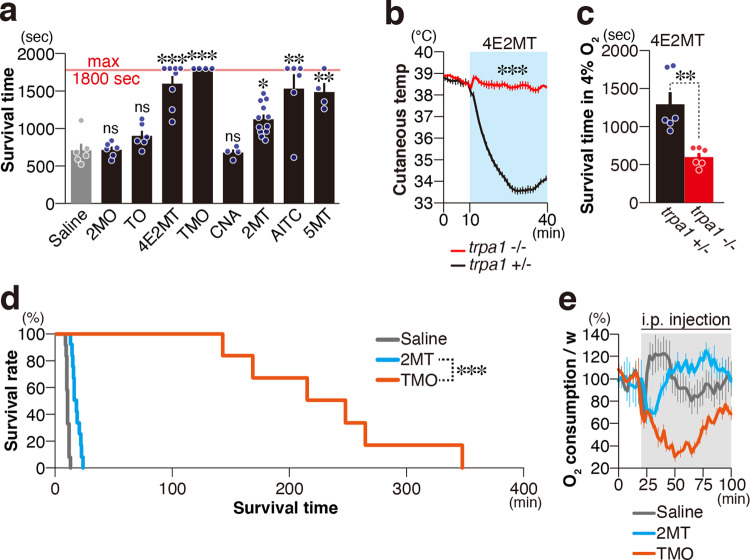
Thiazoline-related innate fear-eliciting compounds (tFOs) orchestrate hypothermia, hypometabolism, and anti-hypoxia, which enable survival in lethal hypoxic conditions. Here, we show that most of these effects are severely attenuated in transient receptor potential ankyrin 1 (Trpa1) knockout mice. TFO-induced hypothermia involves the Trpa1-mediated trigeminal/vagal pathways and non-Trpa1 olfactory pathway. TFOs activate Trpa1-positive sensory pathways projecting from trigeminal and vagal ganglia to the spinal trigeminal nucleus (Sp5) and nucleus of the solitary tract (NTS), and their artificial activation induces hypothermia. TFO presentation activates the NTS-Parabrachial nucleus pathway to induce hypothermia and hypometabolism; this activation was suppressed in Trpa1 knockout mice. TRPA1 activation is insufficient to trigger tFO-mediated anti-hypoxic effects; Sp5/NTS activation is also necessary. Accordingly, we find a novel molecule that enables mice to survive in a lethal hypoxic condition ten times longer than known tFOs. Combinations of appropriate tFOs and TRPA1 command intrinsic physiological responses relevant to survival fate.


Conflict of interest statement

The authors declare no competing interests.

Figures

Fig. 1
Fig. 1. Trpa1 mediates tFO-evoked hypothermia and bradycardia.
a, b Cutaneous temperature (a) and core body temperature (b) temporal analysis in Trpa1−/− (red) and control (black) mice in response to presentation of 2-methyl-2-thiazoline (2MT) (a, n = 7 for each genotype; b, n = 7 for each genotype). Mean cutaneous/core temperature in 10 min of baseline session and 20 min of 2MT presentation are also shown (a, p = 0.8708 for baseline session and p < 0.0001 for during 2MT presentation; b, p = 0.6638 for baseline session and p = 0.0026 for 2MT session). c Cutaneous temperature temporal analysis in Trpv1−/− (purple) and control (black) mice in response to 2MT presentation (n = 8 for each genotype). Mean cutaneous temperature in 10 min of baseline session and 20 min of 2MT presentation are also shown (p = 0.9121 for baseline session and p = 0.0935 for 2MT session). d Core body temperature temporal analysis in Trpa1−/− (red) and control (black) mice in response to the restrained condition (n = 7 for each genotype). Mean core temperature during baseline session (1–10 min, p = 0.9981) and during restrained condition (12–40 min, p = 0.0631) are also shown. e, f Temporal analysis of heart rates in Trpa1−/− (red) and control (black) mice in response to 2MT presentation (e, n = 7 for each) and in restrained condition (f, n = 7 for each). Mean heart rate in response to 2MT presentation [e, p = 0.9757 for baseline session (1–10 min) and p < 0.0001 for 2MT session (11–20 min, marked by shaded duration in the left figure)] and the restrained condition [f, p = 0.9987 for baseline (1–10 min) and p = 0.01084 for restrained condition (12–20 min, marked by shaded areas in the left figure)] are also shown. Data are shown as mean ± SEM. Two-way ANOVA followed by Sidak’s multiple comparison test was used to assess significance; *p < 0.05; **p < 0.01; ***p < 0.001; ns p > 0.05.
Fig. 2
Fig. 2. Trpa1 mediates tFO-evoked anti-hypoxia.
a Temporal analysis of oxygen consumption in Trpa1−/− (red) and control (black) mice in response to 2MT presentation (a, n = 9 for Trpa1+/− and n = 7 for Trpa1−/−). 2MT was presented at 10 min. b Mean survival time of Trpa1−/− (red) and control (black) mice in 4% oxygen with 10 min of prior 2MT presentation (n = 7 for each genotype, p = 0.0122). c Mean survival time of wildtype mice in 4% oxygen with (blue) and without (gray) intraperitoneal (IP) administration of the indicated compounds [Δ9-tetrahydrocannabinol (THC); n = 8 for each, p = 0.0586: isothiocyanate (AITC); n = 8 each, p = 0.0258: acetaminophen (APAP); n = 6 for saline and n = 7 for APAP, p = 0.003]. d Mean survival time of Trpa1−/− (closed bars; n = 8 each) and control (open bars; n = 8 each) mice in 4% oxygen with (blue) and without (gray) IP administration of APAP; p = 0.0066 for Trpa1+/− and p = 0.2263 for Trpa1−/−. Data are shown as mean ± SEM. Log-rank test was used to assess statistical significance; *p < 0.05, **p < 0.01, ***p < 0.001.
Fig. 3
Fig. 3. Multiple sensory pathways are involved in tFO-induced hypothermia.
a Temporal and mean cutaneous temperature of olfactory bulbectomized (OBx; n = 12) and sham-operated (n = 8) animals in response to eugenol (EG) and 2MT presentation are shown; p = 0.6302 for eugenol presentation (1–10 min) and p < 0.0001 for 2MT presentation (11–20 min). b Temporal and mean cutaneous temperature of ΔD (Omacs-Cre; NSE-DTAflox) and control mice (n = 8 each) in response to EG and 2MT presentation are shown; p = 0.722 for EG presentation (1–10 min) and p = 0.0052 for 2MT presentation (21–30 min). c Temporal and mean cutaneous temperature of unilateral trigeminal ganglion (TG)-lesioned and sham-operated animals (n = 8 each) in response to EG and 2MT presentation are shown; p = 0.8921 for EG presentation (1–10 min) and p < 0.0001 for 2MT presentation (11–20 min). d Temporal and mean cutaneous temperature of olfactory neuron (ON)-specific Trpa1 knockout (Omp-Cre; Trpa1flox/flox) and control mice (n = 5 for control and n = 8 for knockout) in response to 2MT presentation are shown; p = 0.9757 for baseline condition (1–10 min) and p = 0.9943 for 2MT presentation (21–30 min). e Temporal and mean cutaneous temperature of sensory neuron (SN)-specific Trpa1 knockout (Adv-Cre; Trpa1flox/flox) and control mice (n = 10 each) are shown; p = 0.9775 for baseline condition (1–10 min) and p = 0.0249 for 2MT presentation (21–30 min). f Temporal and mean cutaneous temperature of intra-trigeminal ganglion injection of saline and RTX (n = 8 for saline and n = 11 for RTX) in response to 2MT presentation are shown; p = 0.5719 for baseline condition (1–10 min) and p = 0.0034 for 2MT presentation (11–20 min). Data are shown as mean ± SEM. Two-way ANOVA followed by Sidak’s multiple comparison test; **p < 0.01; ***p < 0.001. Scale bars, 100 µm.
Fig. 4
Fig. 4. Projection sites of Trpa1+ neurons in the Sp5/NTS.
a Strategy for selective labeling of Trpa1+ cells using Trpa1-Cre and RCL-ChR2/EYFP mice. Schematic illustration of trigeminal and vagus nerve projections to the brainstem are also shown. A dotted line indicates the approximate position of the sections shown in dj. bd Representative EYFP signals in the TG (b1b3), VG (c1c3), and medulla (d1) of whole mount views (b1, c1), magnified whole-mount views (b2, c2), and tissue sections (b3, c3, d1) of Trpa1-Cre; RCL-ChR2/EYFP double transgenic mice. Enlarged images of Sp5C (d2; area indicated by arrow in d1), Sp5I (d3; area indicated by arrowhead in d1), and NTS (d4; area indicated by double arrow in d1) are also shown. In the Sp5I/C transition area, YFP-positive fibers were observed in the dorsal (arrow) area in the Sp5C and ventral area in the Sp5I (arrowhead) regions (d1). e1f4 Representative images of in situ hybridization of c-fos RNA in the medulla following IP injection of saline (e1e4) and tFO (4E2MT; f1f4), along with enlarged images of the Sp5 (e2, e3, f2, and f3) and NTS (e4, f4). gl Expression of phospho-ERK and total ERK was compared with EYFP signals in the ventral EYFP-fiber-rich area in the Sp5 after IP injection of saline (g, i) and tFO (4E2MT; h, j). Quantification of total ERK (k; n = 5 for each, p = 0.9984) and pERK (l; n = 5 for each, p < 0.0001) are also shown. Data are shown as mean ± SEM. Unpaired, two-tailed Student’s t test was used to assess significance. Scale bars, 100 µm; ***p < 0.001.
Fig. 5
Fig. 5. Hypothermia induced by the Trpa1+ neurons projecting to the Sp5.
a, b The experimental design of the chemogenetic activation of Trpa1+ neurons projecting to the Sp5 (a) and representative retrograde-labeled mCherry expression in the TG in Trpa1-Cre and control mice (b). c Representative images of medulla (left), magnified views in the ventral and dorsal parts of Sp5 (middle; areas indicated by arrow and arrowhead in the left figure), and quantification (right) of c-fos+ cells in the dorsal Sp5 (Sp5d) and ventral Sp5 (Sp5v) after clozapine-N-oxide (CNO) administration (Sp5d, n = 12 for Trpa1-Cre+/sal, n = 14 for Trpa1-Cre/CNO, and n = 24 for Trpa1-Cre+/CNO, p = 0.9850 between Trpa1-Cre+/saline and Trp1-Cre/CNO, and p < 0.0001 between Trpa1-Cre+/saline and Trpa1-Cre+/CNO; Sp5v, n = 12 for Trpa1-Cre+/sal, n = 13 for Trpa1-Cre/CNO, and n = 24 for Trpa1-Cre+/CNO, p = 0.9947 between Trpa1-Cre+/sal and Trpa1-Cre/CNO, and p = 0.0043 between Trpa1-Cre+/saline and Trpa1-Cre+/CNO) are shown. d Temporal and mean cutaneous temperature after CNO administration are shown for hM3Dq-infected Trpa1-Cre (red) and control (black) mice (n = 6 for control and n = 5 for Trpa1-Cre, p = 0.0179). e Temporal and mean cutaneous temperature after administration of saline (black) and CNO (red) are shown for hM3Dq-infected Trpa1-Cre mice (n = 12 each, p = 0.0018). f Temporal and mean cutaneous temperature after administration of saline are shown for Trpa1-Cre (red) and control (black) mice (n = 6 for control and n = 4 for Trpa1-Cre, p = 0.500). Data are shown as mean ± SEM. One-way ANOVA followed by Dunnett’s multiple comparison test (c), unpaired one-tailed Student’s t test (d), paired one-tailed Student’s t test (e), and Mann–Whitney U test (f) were used to assess significance; *p < 0.05; **p < 0.01; ***p < 0.001. Scale bars, 100 µm.
Fig. 6
Fig. 6. Hypothermia induced by the Trpa1+ neurons projecting to the NTS.
a, b The experimental design of the chemogenetic activation of Trpa1+ neurons projecting to the NTS (a) and representative retrograde-labeled mCherry expression in the VG in Trpa1-Cre and control mice (b). c Representative images of medulla (left), magnified views in the NTS (middle), and quantification (right) of c-fos+ cells in the NTS after CNO administration are shown (n = 8 for Trpa1-Cre+/sal and Trpa1-Cre+/CNO and n = 6 for Trpa1-Cre/CNO, p = 0.0135 between Trpa1-Cre+/sal and Trpa1-Cre+/CNO, and p = 0.5335 between Trpa1-Cre+/sal and Trpa1-Cre/CNO). d, e Temporal and mean cutaneous temperature after administration of saline (black) and CNO (red) are shown for hM3Dq-infected Trpa1-Cre (d; n = 7 each, p = 0.0003) and control mice (e; n = 6 each, p = 0.1562). Data are shown as mean ± SEM. Kruskal–Wallis with Dunn’s multiple test (c), one-tailed, Mann–Whitney U test (d), and one-tailed, Wilcoxon test (e) were used to assess significance; *p < 0.05; **p < 0.01; ***p < 0.001. Scale bars, 100 µm.
Fig. 7
Fig. 7. TRPA1 activation by various compounds.
a Chemical structures of tested compounds. b Representative TRPA1 current–voltage (IV) relations for each compound (left), and relative macroscopic currents from excised patches elicited by application of 100 μM of each compound at +100 mV, normalized to those elicited by the application of saline (right; n = 5 for TO, n = 6 for 2MO and 4E2MT, n = 7 for TMO and CNA, and n = 9 for saline, 2MT, AITC, and 5MT; p > 0.9999 for 2MO and TO, p = 0.018 for 4E2MT, p = 0.0076 for TMO, p = 0.0161 for CNA, p = 0.0041 for 2MT, and p < 0.0001 for AITC and 5MT) are shown. c, d (Left) Representative traces of GCaMP6f fluorescence of the TG (c) and VG (d) are shown. A representative image of the TG and VG used in the calcium imaging is also shown. Scale bar, 1 mm. (Right) Calcium activity of AITC-responsive Trpa1+ cells in the TG (c) and VG (d) in response to the indicated compounds were analyzed and relative calcium activities of responsive cells for each compound are shown. The number of responded and recorded cells are indicated in the bar graphs. Statistical significance was assessed between activities of all the recorded cells in saline condition and responsive cells for each condition (c, p = 0.4916 for TO, p = 0.3701 for 4E2MT, p < 0.0001 for TMO, CNA, 2MT, and AITC, and p = 0.7902 for 5MT; d, p < 0.0001 for 4E2MT, TMO, CNA, and AITC). Scale bar, 100 μm. Data are shown as mean ± SEM. Kruskal–Wallis with Dunn’s multiple comparison test (b) and Kruskal–Wallis with uncorrected Dunn’s test (c, d) were used to assess significance; *p < 0.05; **p < 0.01; ***p < 0.001.
Fig. 8
Fig. 8. Sp5/NTS activation by various compounds.
a, b Representative images of in situ hybridization of c-fos mRNA (left) and quantification of c-fos-positive cells (right) in the Sp5 (a) and NTS (b) in response to IP injection of the indicated compounds (n = 6 for saline, n = 4 for 2MO, 2MT, and AITC, and n = 8 for TO, 4E2MT, TMO, CNA, and 5MT; a, p = 0.5447 for 2MO, p = 0.5745 for TO, p < 0.0001 for 4E2MT, p = 0.0071 for TMO, p = 0.4904 for CNA, p = 0.0005 for 2MT, p = 0.2331 for AITC, and p = 0.0028 for 5MT; b, p = 0.5148 for 2MO, p = 0.9379 for TO, p < 0.0001 for 4E2MT, p = 0.0001 for TMO, p = 0.2798 for CNA, p = 0.0034 for 2MT, p = 0.0447 for AITC, and p = 0.0043 for 5MT). Scale bar, 100 μm. Data are shown as mean ± SEM. Kruskal–Wallis with uncorrected Dunn’s test was used to assess significance; *p < 0.05; **p < 0.01; ***p < 0.001.
Fig. 9
Fig. 9. Compounds induce differential gene expression in the TG.
a Clustered heat map depicting relationships across 12 genes, which exhibited significant differences (q < 0.01) under 16 stimulation conditions. The color bar indicates the z score scale. Egr1a and Egr1b are Ensemble transcript ENSMUST0000006479.5 and ENSMUST00000165033.1, respectively. bi Box plots depicting the log estimated counts of gene expression in 16 stimulation conditions are shown for the indicated genes that exhibited significant differences (q < 0.01); n = 2 for saline, TO, AITC, and 2MT, and n = 4 for CNA and 4E2M; q = 0.00024 for Egr1b (b), q = 0.0012 for c-fos (c), q = 0.0024 for Btg2 (d), q = 0.0067 for Dusp1 (e), q = 0.0047 for Tbk1 (f), q = 0.0045 for AC149090.1 (g), q = 0.0058 for Tln2 (h), and q = 0.0083 for Col5a3 (i). All boxplots indicate median (center line), 25th and 75th percentiles (bounds of box), and minimum and maximum (whiskers); q value obtained by likelihood ratio test was corrected by Benjamin–Hochberg multiple test.
Fig. 10
Fig. 10. Identification of novel compounds with ultrapotent anti-hypoxic activities.
a Mean survival time in 4% oxygen in response to IP administration of the indicated compounds are shown (n = 6 for saline, 2MT, TO, and AITC; n = 8 for 4E2MT; n = 4 for TMO, CNA, and 5MT; and n = 12 for 2MT; p = 0.8728 for 2MO, p = 0.2701 for TO, p = 0.0001 for 4E2MT and TMO, p = 0.9493 for CNA; p = 0.0182 for 2MT; p = 0.0015 for AITC; and p = 0.0036 for 5MT, on Kruskal–Wallis with uncorrected Dunn’s test). b Temporal analysis of cutaneous temperature in Trpa1−/− (red) and control (black) mice in response to IP administration of 4E2MT are shown (n = 6 for each genotype). Statistical significance was assessed for cutaneous temperature after IP administration of 4E2MT (11–40 min; p < 0.0001, Student’s t test, unpaired, one-tailed). c Mean survival time in 4% oxygen in Trpa1−/− (red) and control (black) mice in response to IP administration of 4E2MT (n = 6 for each genotype, p = 0.0011, one-tailed Mann–Whitney U test). d Survival rate in 4% oxygen with prior IP administration of saline (gray; n = 6), 2MT (blue; n = 12), and TMO (orange; n = 6). e Temporal analysis of oxygen consumption in response to IP administration of saline (gray), 2MT (blue), and TMO (orange) (n = 4 for each condition). Data are shown as mean ± SEM; *p < 0.05; **p < 0.01; ***p < 0.001.

References

    1. Golden FS, Tipton MJ, Scott RC. Immersion, near-drowning and drowning. Br. J. Anaesth. 1997;79:214–225. doi: 10.1093/bja/79.2.214. - DOI - PubMed
    1. Graham DT, Kabler JD, Lunsford L. Vasovagal fainting: a diphasic response. Psychosom. Med. 1961;23:493–507. doi: 10.1097/00006842-196111000-00004. - DOI - PubMed
    1. Vernet-Maury E, Polak EH, Demael A. Structure-activity relationship of stress-inducing odorants in the rat. J. Chem. Ecol. 1984;10:1007–1018. doi: 10.1007/BF00987509. - DOI - PubMed
    1. Isosaka T, et al. Htr2a-expressing cells in the central amygdala control the hierarchy between innate and learned fear. Cell. 2015;163:1153–1164. doi: 10.1016/j.cell.2015.10.047. - DOI - PubMed
    1. Matsuo T, et al. Artificial hibernation/life-protective state induced by thiazoline-related innate fear odors. Commun. Biol. 2021;4:101. doi: 10.1038/s42003-020-01629-2. - DOI - PMC - PubMed

Publication types

MeSH terms