. 2021 Apr 6;12(1):2044.
doi: 10.1038/s41467-021-22322-w.

Robustness and plasticity in Drosophila heat avoidance

Affiliations

Robustness and plasticity in Drosophila heat avoidance

José Miguel Simões et al. Nat Commun. .

Abstract

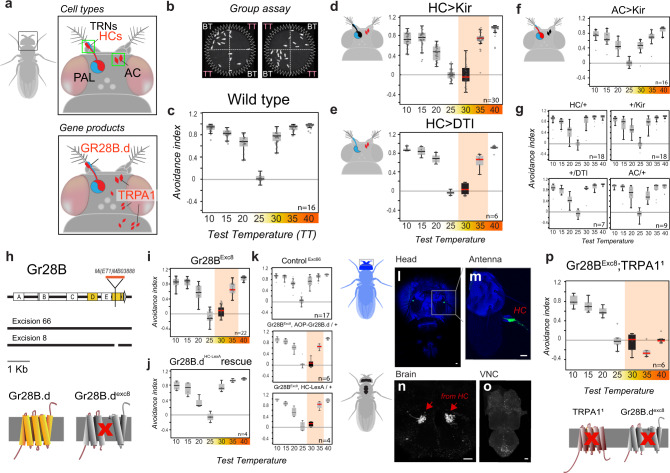
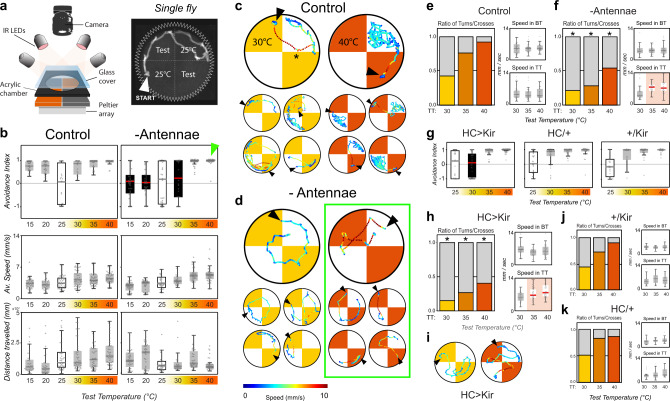
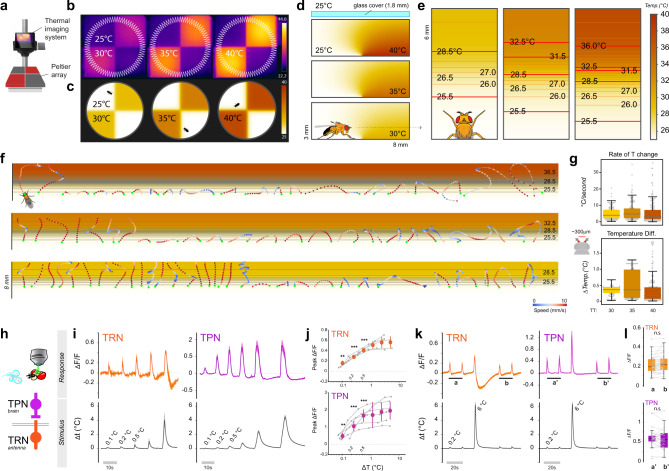
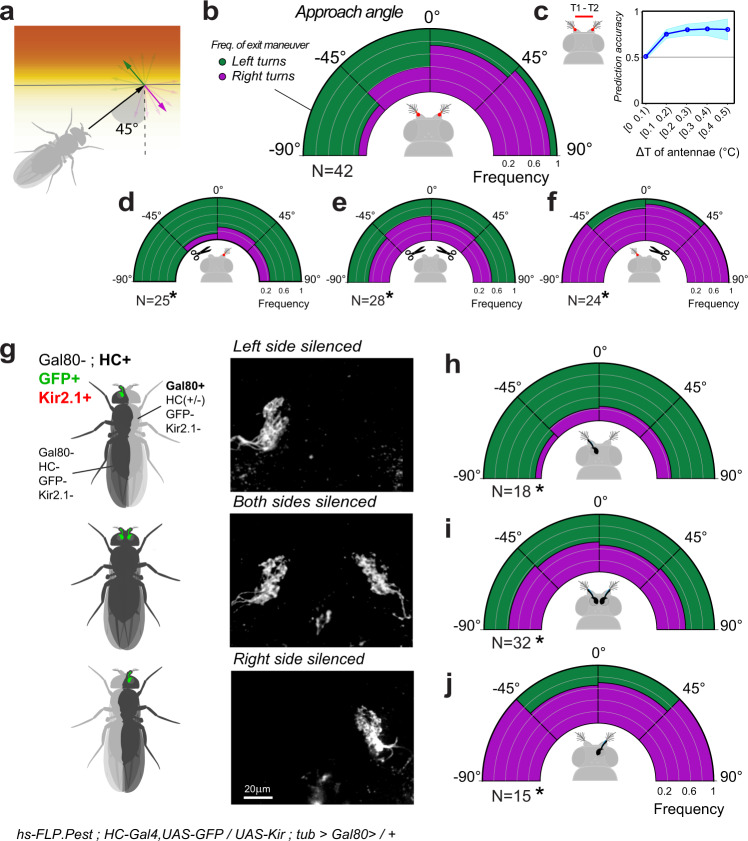
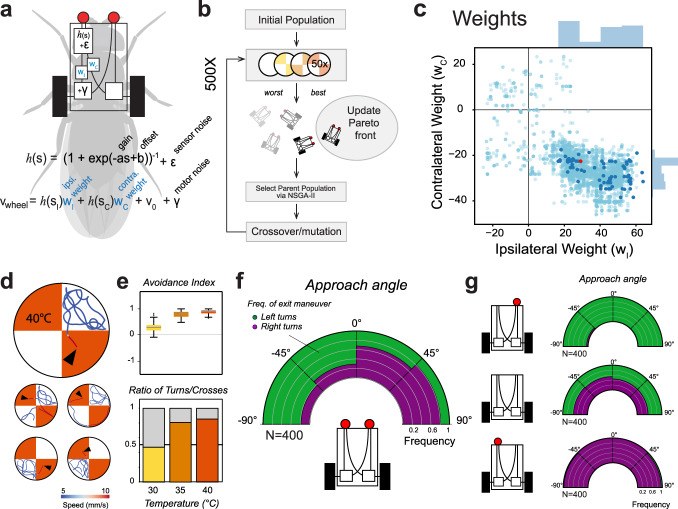
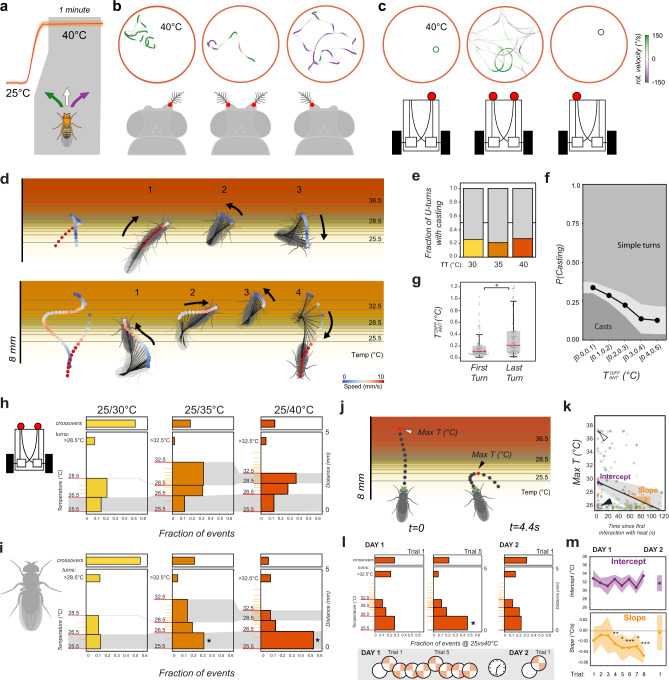
Simple innate behavior is often described as hard-wired and largely inflexible. Here, we show that the avoidance of hot temperature, a simple innate behavior, contains unexpected plasticity in Drosophila. First, we demonstrate that hot receptor neurons of the antenna and their molecular heat sensor, Gr28B.d, are essential for flies to produce escape turns away from heat. High-resolution fly tracking combined with a 3D simulation of the thermal environment shows that, in steep thermal gradients, the direction of escape turns is determined by minute temperature differences between the antennae (0.1°-1 °C). In parallel, live calcium imaging confirms that such small stimuli reliably activate both peripheral thermosensory neurons and central circuits. Next, based on our measurements, we evolve a fly/vehicle model with two symmetrical sensors and motors (a "Braitenberg vehicle") which closely approximates basic fly thermotaxis. Critical differences between real flies and the hard-wired vehicle reveal that fly heat avoidance involves decision-making, relies on rapid learning, and is robust to new conditions, features generally associated with more complex behavior.


Conflict of interest statement

The authors declare no competing interests.

Figures

Fig. 1
Fig. 1. Noxious and innocuous heat sensing together mediate heat avoidance in Drosophila.
a Schematic representation of the cell types and gene products involved in heat sensing in adult Drosophila (TRNs: temperature receptor neurons, HCs: hot cells, AC: anterior cells, PAL: posterior antennal lobe). b, c Two-choice assay for temperature preference. b Groups of flies are given a choice between a base temperature (BT, 25 °C; n = no. of groups) and a variable test temperature (TT; a single video frame is shown). c Temperature preference is quantified as an avoidance index for the various test temperatures (wild type is shown). d Genetic silencing (by expression of Kir2.1, a hyperpolarizing agent) or (e) ablation (by Diphteria toxin, DTI, a cell killing toxin—under the control of HC-Gal4) of hot TRNs of the arista abolishes avoidance of 30 °C and reduces avoidance of 35 °C. f Genetic silencing of AC (in AC-Gal4>UAS-Kir2.1) has no effect on avoidance. g Control genotypes (drivers and effectors). h Creation of a GR28B null mutant. Schematics of the Gr28B genomic locus, Minos insertion, genomic excisions produced for this work and effect of excisions on the predicted protein. i An excision in one of the common exons (Exc8) abolishes avoidance of 30 °C and reduces avoidance of 35 °C. j Targeting expression of a GR28B.d cDNA to hot-activated TRNs (by HC-LexA) completely rescues avoidance defects. k Controls. lo HC-LexA expression visualized by GFP (in HC-LexA>Aop-GFP animals). l, m Confocal stacks from head/antennae (blue = cuticle autofluorescence, green = GFP expression in Hot TRNs of the arista; scalebars = 20 μm). no 2-photon stacks of brain and ventral nerve chord (VNC), showing (n) hot TRNs axon terminals in the brain, and (o) no labeling in the VNC (scalebars, 20 µm). p Gr28BExc8, TRPA11 double mutants display no heat avoidance, but normal cold avoidance. In all boxplots, the edges of the boxes are the first and third quartiles, a solid line marks the median, and whiskers delimit the data range; a solid red median line denotes a significant interaction between experimental and control animals (two-way ANOVA, P < 0.001), a black box denotes avoidance indexes not significantly different from zero (one sample t test, P < 0.05). See Supplementary Fig. 1 for additional controls. PHC-Kir30 = 3.78e−12, PHC-Kir35 = 6.74e−4; PHC-DTI30 = 1.73e−7, PHC-DTI35 = 2.74e−5; PHC,AC-Kir30 = 1.39e−11, PHC,AC-Kir35 = 4.67e–6; PExc8-30 = 8.12e–18, PExc8-35 = 3.8e–7; PExc8AOP-30 = 5.06e–9; PExc8AOP-35 = 8.01e–6; PExc8lexA-30 = 9.59e−8; PExc8lexA-35 = 6.28e−3; PExc8Df-30 = 4.22e−12, PExc8Df-35 = 4.14e−6; PGR28TRPA1-30 = 2.42e−18, PGR28TRPA1-35 = 1.87e−27, PGR28TRPA1-40 = 1.95e−25, PHC-Kir30 = 0.44; PHC-DTI30 = 0.25; PExc8-30 = 0.06; PExc8Df-30 = 0.24; PGR28TRPA1-30 = 0.50, PGR28TRPA1-40 = 0.80.
Fig. 2
Fig. 2. Thermosensory neurons of the arista guide rapid navigation during thermotaxis.
a Schematic representation of the single fly 2-choice assay for temperature preference. (Test = test temperature). b Avoidance indexes and locomotory parameters of (left) single wild-type control flies and (right) single flies in which the antennae had been surgically removed at eclosion. (Top row) Avoidance indexes. Antenna ablated flies display no avoidance for test temperatures ranging from 15 to 30 °C (a solid red median line denotes a significant difference between experimental and controls, ANOVA: P15 = 1.1e−7, P20 = 3.7e−6, P30 = 2.3e−2; a black box denotes avoidance indexes not different from zero, one-sample t test, P > 0.05). (Center and Bottom row) Quantification of locomotor parameters shows that antenna ablation does not produce major defects in motility (WT: N15 = 27, N20 = 26, N25 = 43, N30 = 55, N35 = 53, N40 = 55, Ablated: N15 = 43, N20 = 36, N25 = 32, N30 = 26, N35 = 38, N40 = 38). c, d Single representative tracks from control and antenna-ablated flies. c Control flies avoid hot quadrants by producing sharp U-turns at cool/hot boundaries (asterisk; note that in all panels arrowheads denote the position of each fly at the start of heating, and that tracks are color-coded by speed). d Antenna ablated flies fail to systematically produce sharp U-turns and instead frequently invade the hot quadrants. e, f Quantification of the ratio of U-turns/border crosses at the cool/hot boundaries and associated locomotor parameters (Ns as in (b)). e In control flies the ratio of U-turns/border crosses increases as a function of the temperature on the hot side, until (for test temperature = 40 °C) most border interactions result in U-turns. f Antenna-ablated flies display significantly smaller fractions of U-turns at the border in all conditions, but instead display a higher speed for traversals of the 35 °C and 40 °C hot quadrants (highlighted in the lower right panel in (f), BT base temperature, TT test temperature). gi Genetic silencing of hot-activated TRNs of the arista results in phenotypes in the hot range very similar to antenna ablation (HC/Kir: N25 = 29, N30 = 33, N35 = 36, N40 = 46, HC/+: N25 = 27, N30 = 22, N35 = 29, N40 = 26, Kir/+: N25 = 35, N30 = 32, N35 = 26, N40 = 26; 2-way ANOVA: P30 = 1.3e−3). j, k Control genotypes (drivers and effectors). In all boxplots, the edges of the boxes are the first and third quartiles, a solid line marks the median, and whiskers delimit the data range; In (fk), a solid red median line denotes a significant interaction between experimental and control animals, a black box denotes avoidance indexes not significantly different from zero. Asterisks in (f) and (h) denote significant differences in turn/cross ratios from the appropriate controls (asterisk in (f): GLMM, Wald test: vs Control P30 = 3.3e−2, P35 = 6.4e−11, P40 = 6.5e−6; red line in (f): ANOVA, P35 = 2.1e−5, P40 = 5.1e−6, control (e); asterisks in (h): 2-Way GLMM, Wald test: P30 = 2.3e−3, P35 = 1.6e−6, P40 = 3.0e−2; red line in (h): 2-way ANOVA, P35 = 3.6e−2, P40 = 1.2e−3, controls (j, k)).
Fig. 3
Fig. 3. A three-dimensional simulation of the thermal environment reveals small temperature differences are salient stimuli.
a Schematic representation of the thermal imaging system. b Thermal images of the arena in the three experimental conditions, and (c), at the same scale, thermal conditions predicted by the simulation (see scale bars for temperature). d Side view of a 3 x 8mm section of the experimental chamber, centered on the interface between floor tiles set at 25°/30°, 25°/35°, and 25°/40 °C, respectively, and showing the predicted thermal conditions (note that the glass cover on top is not to scale). e Top view of the simulated thermal gradients the fly encounters at the cool/hot boundary, produced by slicing the 3D model at the height of the antennae (~700 μm; note that the 3 panels are not aligned; scalebar: temperature in °C). f Representative fly trajectories overlaid atop the gradients in (e). Tracks are color-coded by translational speed (see scalebar). Each dot represents the position of the fly head (acquired at 30 Hz). A green dot indicates the fly head position upon entry in the boundary region. g Maximum rate of temperature change (top) and maximum inter-antennal temperature difference (bottom) experienced by flies traversing the border in the three experimental conditions. h Schematic representation of the 2-photon calcium imaging setup and of the cell types targeted for recording (temperature receptor neurons, TRN and second-order projection neurons, TPN). i Average stimuli (bottom) and response traces (top) recorded from TRN axon terminals (orange trace, left) and TPN (purple trace, right) each separately targeted by transgenic expression of G-CaMP7f (traces represent average ±STD of NTRN = 5 from 5 flies, NTPN = 6 from 6 flies). j Orange and purple dots, peak fluorescence averages from data in (i), ± STD (bin width starting at 0.1 °C and doubling in size for each consecutive bin; asterisk = significantly different from zero, one sample t test, P < 0.05; t test TRN: P0.1 = 3.5e−3, P0.2 = 1.5e−6, P0.5 = 4.1e−4; TPN: P0.1 = 2.1e−3, P0.2 = 1.5e−4, P0.5 = 9.0e−5). k, l Exposure to a larger heat stimulus does not lead to sensitization to smaller stimuli. k Average stimuli (bottom) and responses (top) ± STD. l Average peak signal recorded before (a, a′) and after (b, b) a 6 °C stimulus are not different (n.s. not significant; paired t tests; (k) and (l) are from NTRN = 18, NTPN = 12 from 7 and 6 animals, respectively; note that the twin peaks in (a, a, b, and b) are considered independently in (l)).
Fig. 4
Fig. 4. Differences in antennal input determine the direction of escape turns during thermotaxis.
ac For border interactions, the angle of heading is predictive of the angle of escape. a Schematic of the analysis. The heading angle is quantified in relation to the isothermal lines of the cool/hot boundary while the escape turn is categorized as “left” (green) or “right” (purple). b Distribution of left/right escape turns (binned in 45° intervals) as a function of initial heading angle. c Inter-antennal differences >0.1 °C are predictive of escape turn direction (prediction accuracy, bootstrap mean ± STD). df Surgical removal of the left (d) or right (f) antenna biases escape turn direction towards the side of the lesion (GLMM, Wald Test, Pleft = 6.3e−5, Pright = 9.3e−4), while removal of both antennae (e) abolishes left/right bias (GLMM, Wald test, Pboth = 2.1e−4). g Stochastic loss of the Gal4 inhibitor Gal80 produces flies in which either the left or right hot TRNs of the arista are genetically silenced and, at the same time, labeled by GFP expression (representative 2-photon stacks of TRN axon terminals are shown to the right, labels are the corresponding genotypes). hj Stochastic silencing of either left or right hot TRNs (or both), produces a distribution of turning angles similar to that obtained from surgical ablation ((i) is the control genotype with bi-lateral silencing, see corresponding panel in (g)) (In all panels N denotes the number of animals, GLMM, Wald test, Pleft = 9.0e6, Pright = 2.1e−2; Pboth = 2.5e−5). Note that mosaicism was determined by post-facto dissection and imaging.
Fig. 5
Fig. 5. An evolved “Braitenberg vehicle” nearly reproduces fly thermotaxis.
a An in silico “Braitenberg vehicle” model matching the dimensions of a fly, with key parameters used as substrate for evolution (s = sensory input, v velocity; parameters: a gain, b offset ε, γ noise (2 evolved parameters each, see methods), wi, wc = weights of ipsi- and contralateral connections). b Schematic of the evolutionary process used to optimize the parameters. c Connectivity weights. Note that the best performing vehicles (dark blue dots) preserve both ipsi- and contralateral connectivity, and that ipsilateral weights are exclusively positive (excitatory) while contralateral weights are exclusively negative (inhibitory). df An evolved vehicle (red dot in (c)) nearly reproduces fly thermotactic behavior in a simulated arena. d Traces from a top-performing vehicle in the simulated arena (see Supplementary Fig. 5 and “methods” for details; arrowhead = start). e, f Vehicle performance in the simulated chamber (N = 400 simulations). g Vehicle responses are not robust to perturbation. “Ablation” of a single sensor produces vehicles that, entering the cool/hot boundary, invariably turn to the side of the lesion, irrespective of the direction of approach (mid-panel: as a control, removal of both sensors abolishes directional responses; N = 400 simulations each).
Fig. 6
Fig. 6. Comparison of thermotaxis in flies and vehicles reveals latent robustness and plasticity in fly behavior.
ac Under uniform heat conditions, fly behavior following antenna ablation is less stereotypical that vehicle behavior following sensor ablation. a Schematic of constant-heat experiment. b, c Representative tracks from (b) antenna ablated and control flies and (c) sensor ablated and control vehicles. Track color represents rotational speed (green = leftward rotation, purple = rightward rotation). Unlike flies, sensor-ablated vehicles rotate in place in uniform heat. dg When navigating the cool/hot boundary, fly behavior is also less stereotypical than that of vehicles. Unlike vehicles, in a fraction of border interactions, flies perform “casting” (defined as at least two changes in direction in close succession) before escaping. d Two examples of casting behavior. e Fraction of escape turns that contain at least one casting event, plotted by experimental condition (N30 = 67/28, N35 = 114/30, N40 = 191/39 turns/animals). f Probability of casting is highest when the approach angle results in a small temperature difference between the antennae (N = 341 interactions from 95 flies; bins = 0.1 °C intervals, gray shading = ±STD, GLMM with Wald test, P = 1.5e−2, Coefficient = −3.12). g The last turn of a casting sequence is often characterized by a larger temperature difference between the antennae, compared with the first turn (box edges = first and third quartiles, solid line = median, whiskers = data range; N=92 casts from 55 animals, LMM, ANOVA, P = 2.2e−4). hm Fly heat avoidance also displays hallmarks of rapid learning. h, i Compared to vehicles, flies display a disproportionate fraction of early turns (turns in the <26.5 °C region, lower gray shading) in the 25°/35 °C and 25°/40 °C experimental conditions. Histograms represent fraction of U-turns in different regions of the temperature gradients for (h) vehicles and (i) flies (left y-axis = temperature (°C), right y axis = distance (mm); gray shading = similar temperature range across conditions; crossover frequencies are shown at the top; asterisks in i = GLMM, Wald Test, P35 = 1.2e−7, P40 = 1.1e−26; h: N30 = 138/29, N35 = 131/25, N40 = 181/29 events/flies; i: N = 2493,3087, 3109 events/ 400 vehicle simulations each). jm The dynamics of appearance of early turns suggests an underlying learning process. j Representative tracks showing a border crossing followed by an “early turn” (t = time from first border interaction; arrowheads = maximum temperature at the antennae, Max T, capped at 37 °C for crossings). k Border crossings and deep turns (leading to exposure to high heat) decrease during the course of an experiment in favor of early turns (LMM ANOVA, P = 1.3e−4; gray shading = 95% confidence interval; arrowheads in (k) correspond to events in (j); N = 28 flies). l When naïve flies are subjected to consecutive trials, early turns are significantly increased after five trials (plots as in (h, i); asterisk = GLMM, Wald test, P = 1.3e−2, N = 55 flies, Nevents: ND1T1 = 238, ND1T5 = 264, ND2T1 = 79). Early turn frequency returns to naïve levels after 24 h (right panel). m When considering the maximum temperature experienced at each border interaction, the initial exposure to heat remains constant across trials (intercept, top panel), but, after trial 4, flies rapidly resort to early turns as a strategy to escape heat (negative slope, bottom panel). This effect is reversed after 24 h of rest. Here, max temperature data were extracted and plotted as in (j, k) (points = coefficient from maximum likelihood estimation LMM, shading = 95% confidence interval from parametric bootstrap; asterisks = LMM ANOVA, P4 = 1.4e−3, P5 = 1.7e−2, P6 = 5.5e−5, P7 = 1.7e−2, P8 = 1.4e−9; in (l, m): Nday1 = 55 flies, Nevents: N1 = 108, N2 = 268, N3 = 71, N4 = 338, N5 = 105, N6 = 280, N7 = 103, N8 = 268, Nday2 = 13 flies, Nevents = 71).

References

    1. Braitenberg, V. Vehicles, Experiments in Synthetic Psychology (MIT Press, 1984).
    1. Inoue T, Yamashita T, Agata K. Thermosensory signaling by TRPM is processed by brain serotonergic neurons to produce planarian thermotaxis. J. Neurosci. 2014;34:15701–15714. - PMC - PubMed
    1. Robinson DP, et al. Some like it hot: repeat migration and residency of whale sharks within an extreme natural environment. PLoS ONE. 2017;12:e0185360. - PMC - PubMed
    1. Currier TA, Nagel KI. Multisensory control of orientation in tethered flying Drosophila. Curr. Biol. 2018;28:e3536. - PMC - PubMed
    1. Warren, T. L., Giraldo, Y. M. & Dickinson, M. H. Celestial navigation in Drosophila. J. Exp. Biol.222, jeb186148 (2019). - PMC - PubMed

Publication types