. 2021 Apr 6;12(1):2057.
doi: 10.1038/s41467-021-22361-3.

Lipocalin 2 mediates appetite suppression during pancreatic cancer cachexia

Affiliations

Lipocalin 2 mediates appetite suppression during pancreatic cancer cachexia

Brennan Olson et al. Nat Commun. .

Abstract

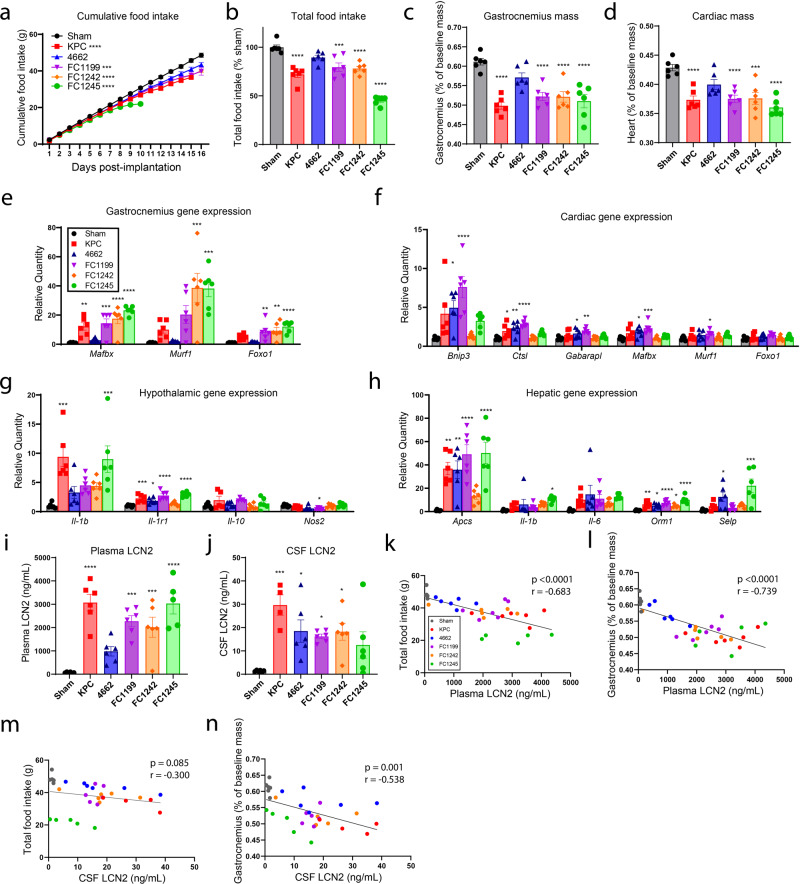
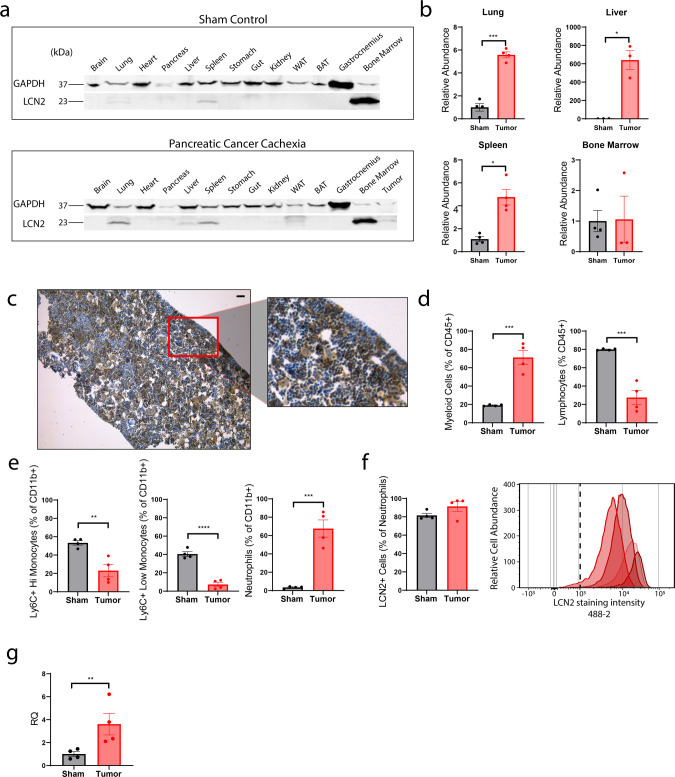
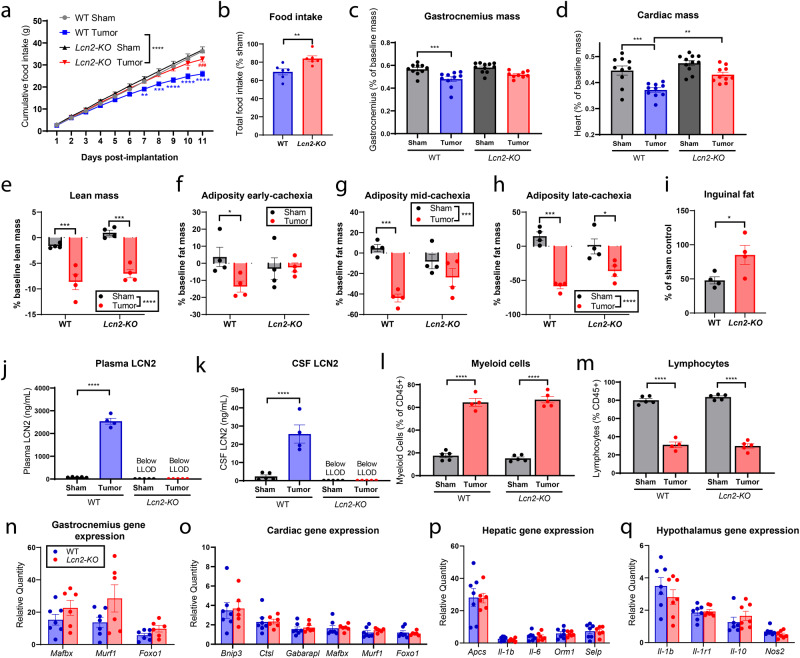
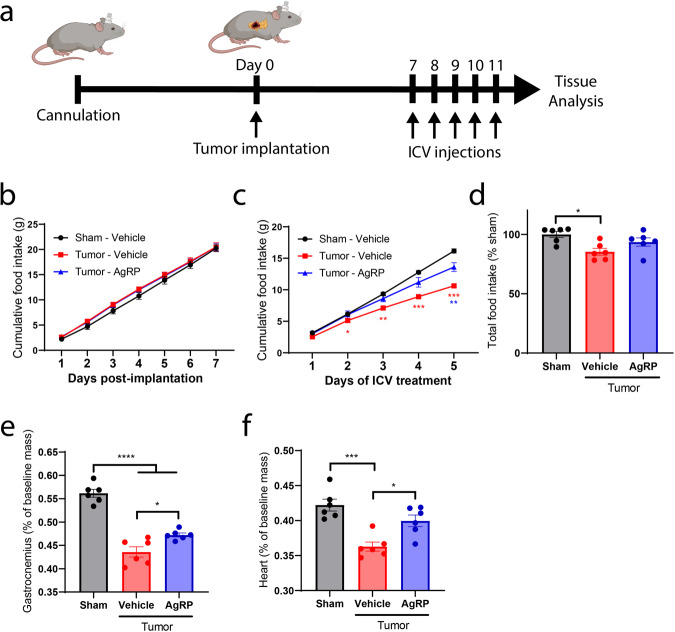
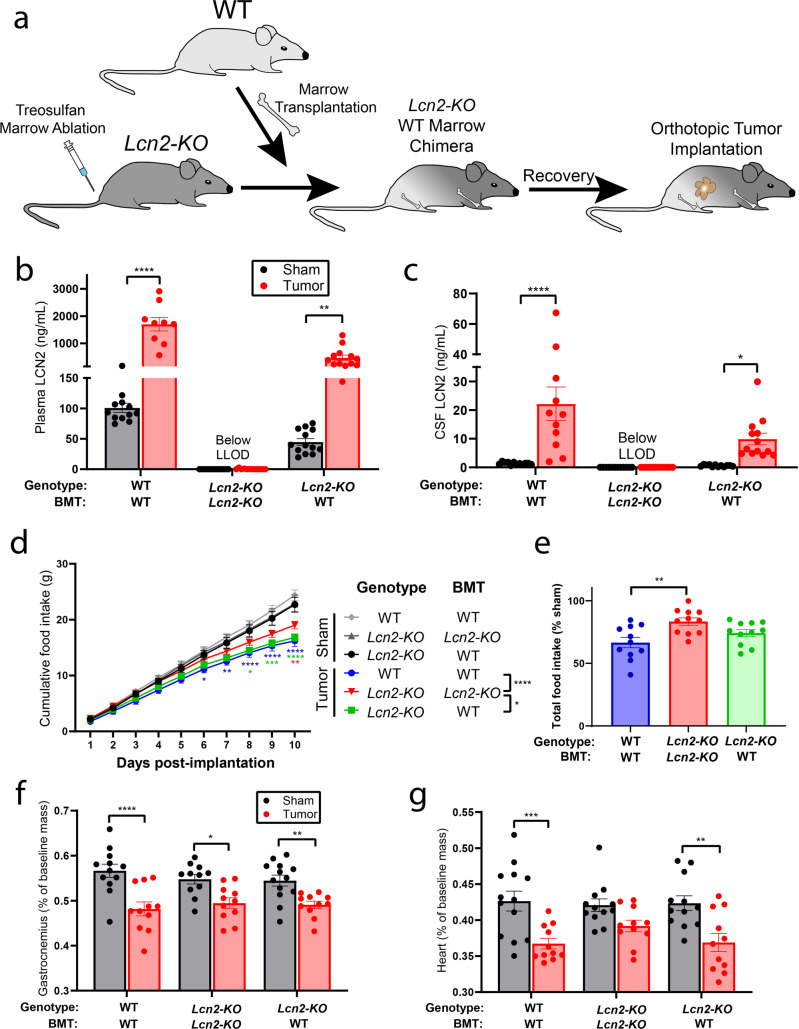
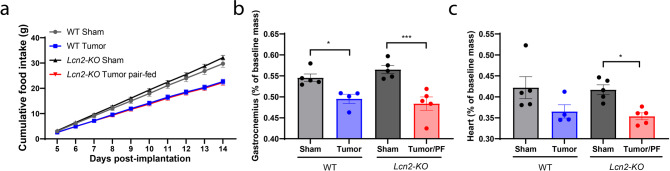
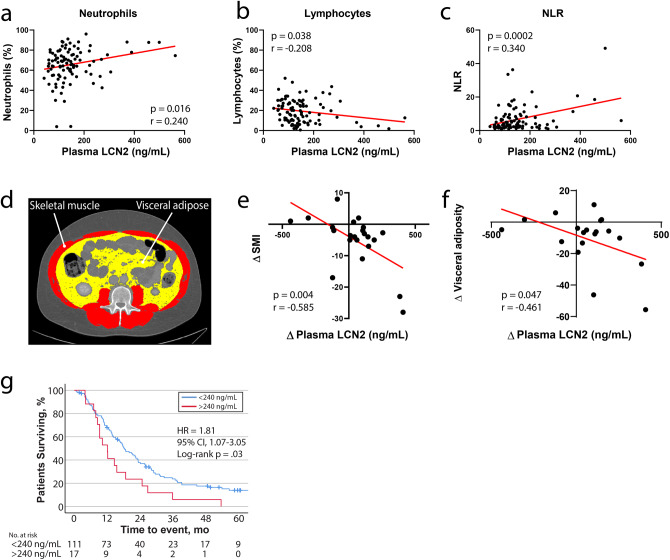
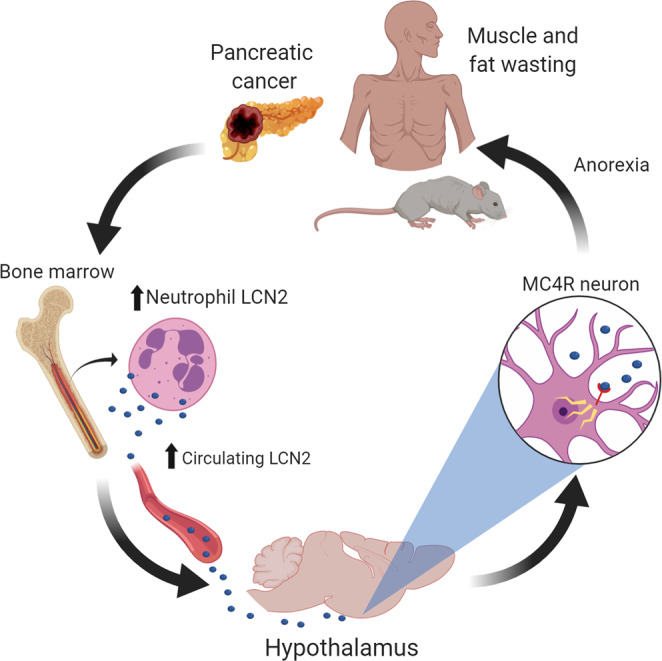
Lipocalin 2 (LCN2) was recently identified as an endogenous ligand of the type 4 melanocortin receptor (MC4R), a critical regulator of appetite. However, it remains unknown if this molecule influences appetite during cancer cachexia, a devastating clinical entity characterized by decreased nutrition and progressive wasting. We demonstrate that LCN2 is robustly upregulated in murine models of pancreatic cancer, its expression is associated with reduced food consumption, and Lcn2 deletion is protective from cachexia-anorexia. Consistent with LCN2's proposed MC4R-dependent role in cancer-induced anorexia, pharmacologic MC4R antagonism mitigates cachexia-anorexia, while restoration of Lcn2 expression in the bone marrow is sufficient in restoring the anorexia feature of cachexia. Finally, we observe that LCN2 levels correlate with fat and lean mass wasting and is associated with increased mortality in patients with pancreatic cancer. Taken together, these findings implicate LCN2 as a pathologic mediator of appetite suppression during pancreatic cancer cachexia.


Conflict of interest statement

D.L.M. is a consultant for Pfizer, Inc. and Alkermes, Inc. D.L.M. is a consultant, has received grant funding, and has equity in Tensive Controls, Inc. The other authors declare no competing interests.

Figures

Fig. 1
Fig. 1. LCN2 is upregulated across several models of pancreatic cancer cachexia and correlates with food consumption and muscle loss.
a Cumulative food intake in five models of pancreatic cancer cachexia and sham operation controls. b Total food intake normalized to sham control group. c Skeletal muscle catabolism as indicated by terminal gastrocnemius mass normalized to body mass. d Cardiac muscle catabolism as indicated by terminal heart mass normalized to body mass. e Gastrocnemius, f heart, g hypothalamus, and h liver gene expression profiles in pancreatic cancer cachexia models (represented as relative quantity to sham control). Terminal i plasma and j CSF LCN2 levels. Linear regression analysis between plasma LCN2 levels and k total food intake or l gastrocnemius mass. Linear regression analysis between CSF LCN2 levels and m total food intake or n gastrocnemius mass. ai, k, l N = 6 per group. j, m, n N = 6 per group except KPC (N = 4 per group). All data are expressed as mean ± SEM. Data represented in bj were analyzed with one-way ANOVA with Bonferroni multiple comparisons comparing tumor experimental groups to sham operation control. kn Analyzed by simple linear regression and two-tailed correlation analyses. *p ≤ 0.05, **p ≤ 0.01, and ***p ≤ 0.001, ****p ≤ 0.0001. Sham operation controls = gray/black, KPC = red, 4662 = blue, FC1199 = purple, FC1242 = orange, FC1245 = green.
Fig. 2
Fig. 2. LCN2 is predominantly produced by the bone marrow compartment and neutrophils during cachexia.
a Representative tissue Western blot analysis of LCN2 in sham operated or pancreatic cancer cachexia mice (orthotopic KPC pancreatic cancer cell implantation). b Western blot quantification of LCN2 in lung, liver, spleen, and bone marrow compartments (n = 4 per group, except in KPC-engrafted liver and bone marrow samples [n = 3 per group]). c Representative immunohistochemistry staining images of LCN2 in the bone marrow of cachectic mice; 10× and high-resolution inset (scale bar = 50 µm). d, e Flow cytometry analysis to detect myeloid and lymphoid populations and myeloid cell subpopulations. f Flow cytometry quantification of intracellular LCN2 in Ly6G+ neutrophils; accompanying fluorescent intensity histogram, capturing relative abundance of Ly6G+ LCN2+ neutrophils between sham (gray lines) and cachectic (red lines) groups. The Ly6G+ cell population in the sham group is suppressed to the X-axis by the relative abundance found in the cachectic group. Each curve represents a single subject. Vertical dotted line approximates gating threshold for positive intracellular LCN2 staining. g FACS-sorted neutrophil RNASeq analysis of LCN2 transcripts. dg N = 4 per group. b, dg Analyzed by two-tailed Students t tests. a LCN2 molecular weight = 23 kDa, GAPDH = 37 kDa. All data expressed as mean ± SEM. Quantitative data analyzed by Student’s t test. *p ≤ 0.05, **p ≤ 0.01, ***p ≤ 0.001, and ****p ≤ 0.0001. Sham operation controls = gray/black, KPC = red.
Fig. 3
Fig. 3. Genetic deletion of LCN2 ameliorates cachexia–anorexia.
a Cumulative and b total food intake for WT and Lcn2-KO mice after receiving tumor implantations or sham operations (n = 6 per group for WT sham, WT tumor, and Lcn2-KO tumor groups; n = 7 for Lcn2-KO sham controls). c Terminal gastrocnemius and d heart mass as a percentage of baseline body mass (n = 10 per group in WT sham, WT tumor, and Lcn2-KO tumor groups; n = 11 in Lcn2-KO sham controls). e NMR body composition analysis of terminal tumor-free lean (n = 4 per group). fh NMR body composition analysis of fat mass at early (study day 4), mid (study day 8), and late (study day 11) cachexia (n = 4 per group). i Terminal inguinal fat pad mass normalized to genotype control (n = 4 per group). j Terminal plasma and k cerebrospinal fluid LCN2 levels (n = 5 per group for WT Sham, Lcn2-KO sham, and Lcn2-KO tumor groups; n = 4 for the WT tumor group). l Proportions of myeloid and m lymphoid cells as a percentage of CD45+ cells (n = 5 per group for WT Sham, Lcn2-KO sham, and Lcn2-KO tumor groups; n = 4 for the WT tumor group). n Ubiquitin proteasome pathway gene expression in the gastrocnemius. o Ubiquitin proteasome and autophagy-related gene expression in cardiac muscle. p Hepatic expression of acute-phase- and inflammatory-related transcripts. q Hypothalamic gene expression of inflammation-related transcripts. For nq, n = 6 per group for WT sham and Lcn2-KO tumor groups; n = 7 for Lcn2-KO sham and WT tumor, groups. All gene expression data represented as fold change over genotype-matched controls. No difference was observed in baseline expression of transcripts between WT and Lcn2-KO mice. All data expressed as mean ± SEM. Cumulative food intake data were analyzed by a repeated-measures Two-way ANOVA followed by Bonferroni’s post hoc test. Food intake and inguinal fat mass as % of sham was analyzed by two-tailed Student’s t test. All other data (ch, jq) were analyzed by ordinary Two-way ANOVA followed by Bonferroni’s post hoc test. *p ≤ 0.05, **p ≤ 0.01, ***p ≤ 0.001, and ****p ≤ 0.0001. LLOD lower limit of detection. ad, j, k, nq Gray = WT sham operation control; black = Lcn2-KO sham operation control; blue = WT KPC-engrafted mice; red = Lcn2-KO KPC-engrafted mice. ei, l, m Sham operation controls = gray/black, KPC-engrafted mice = red.
Fig. 4
Fig. 4. MC4R inverse agonism improves feeding behaviors and muscle mass during pancreatic cancer cachexia.
a Experimental design and protocol of cannulation, tumor implantation, and ICV treatment. Cumulative food intake after tumor implantation b before and c after initiation of daily ICV AgRP (1 nmol) or vehicle treatments. In b, the Tumor–AgRP group is masked immediately behind the Tumor–Vehicle group. d Total food intake as a percentage of sham control for entire study. f Terminal gastrocnemius and e cardiac tissue mass normalized to baseline mass. n = 6 per group. All data expressed as mean ± SEM. Cumulative food intake data were analyzed by a repeated-measures Two-way ANOVA followed by Bonferroni’s post hoc test. All other data were analyzed by ordinary One-way ANOVA followed by Bonferroni’s post hoc test. *p ≤ 0.05, **p ≤ 0.01, ***p ≤ 0.001, and ****p ≤ 0.0001. Black/gray = sham operation control, red = KPC-engrafted, ICV vehicle treated mice, blue = KPC-engrafted, ICV AgRP-treated mice.
Fig. 5
Fig. 5. LCN2 readily crosses the BBB and its expression in the bone marrow is sufficient to induce appetite suppression during pancreatic cancer cachexia.
a Experimental design of bone marrow transplantation experiments. b Terminal peripheral and c central LCN2 levels. d Cumulative food intake and e total food intake as a percent of sham control. f Terminal gastrocnemius and g cardiac tissue mass normalized to baseline mass. b, c N = 12 for WT/WT-BM sham, Lcn2-KO/KO-BMT sham, and Lcn2-KO/KO-BMT KPC-engrafted mice; N = 9 for WT/WT-BM tumor group; N = 13 for Lcn2-KO/WT-BMT sham and Lcn2-KO/WT-BMT KPC-engrafted mice. dg N = 12 per group for WT/WT-BM sham and Lcn2-KO/KO-BMT sham groups; N = 13 for the Lcn2-KO/WT-BMT sham group; N = 11 per group for WT/WT-BM tumor, Lcn2-KO/WT-BMT tumor, and Lcn2-KO/KO-BMT tumor groups. All data expressed as mean ± SEM. Cumulative food intake data were analyzed by Mixed Model ANOVA with continuous measures followed by Bonferroni’s post hoc test. Total food intake data were analyzed by One-way ANOVA followed by Bonferroni’s post hoc test. All other data were analyzed by Mixed Model ANOVA followed by Bonferroni’s post hoc test. Main column effects were calculated amongst tumor groups in d and are represented in the figure legend. *p ≤ 0.05, **p ≤ 0.01, ***p ≤ 0.001, and ****p ≤ 0.0001. LLOD lower limit of detection. BMT bone marrow transplantation. b, c, f, g Sham operation controls = gray/black, KPC-engrafted mice = red. d, e Light gray = WT/WT-BMT sham operation control, dark gray = Lcn2-KO/Lcn2-KO-BMT sham operation control, black = Lcn2-KO/WT-BMT sham operation control, blue = WT/WT-BMT KPC-engrafted mice, red = Lcn2-KO/Lcn2-KO-BMT KPC-engrafted mice, green = Lcn2-KO/WT-BMT KPC-engrafted mice.
Fig. 6
Fig. 6. Pair feeding abolishes muscle gain in Lcn2-KO mice during cachexia.
a Cumulative food intake after the initiation of cachexia symptoms. N = 5 per group. b Terminal gastrocnemius and c cardiac tissue mass normalized to baseline mass. N = 5 per group for WT sham, Lcn2-KO sham, and Lcn2-KO tumor groups; N = 4 for the WT tumor group. Cumulative food intake data were analyzed by a repeated-measures Two-way ANOVA followed by Bonferroni’s post hoc test. Data presented in b, c were analyzed by a Two-way ANOVA followed by Bonferroni’s post hoc test. *p ≤ 0.05, **p ≤ 0.01, ***p ≤ 0.001, and ****p ≤ 0.0001. PF pair-fed. All data are expressed as mean ± SEM. Gray = WT sham operation control; black = Lcn2-KO sham operation control; blue = WT KPC-engrafted mice; red = Lcn2-KO KPC-engrafted, pair-fed mice.
Fig. 7
Fig. 7. LCN2 is regulated during pancreatic cancer in humans and is associated with neutrophil expansion, skeletal muscle catabolism, and increased mortality.
Scatter plot of plasma LCN2 levels and a circulating neutrophil percentage, b lymphocyte percentage, and c neutrophil to lymphocyte ratio (n = 100). d Representative axial computed tomography scan at the third lumbar vertebrae highlighting visceral adipose tissue in yellow and skeletal muscle in red. e Correlation plot of change in skeletal muscle index and change in LCN2 levels after diagnosis (n = 22). f Correlation plot of change in visceral adiposity and change in LCN2 levels after diagnosis (n = 19). g Overall survival for patients with pancreatic cancer dichotomized by 240-ng/mL LCN2 levels at diagnosis (n = 128; two patients with <1.5 months of follow-up were excluded from analysis). SMI skeletal muscle index; both SMI and visceral adiposity calculated by dividing total cross-sectional area at L3 (cm2) by patient height squared (m2). Data from e, f represent a subset of patients from ac, which have baseline and follow computed tomography scans. Please see Supplementary tables for demographics information for each patient population in ac, eg. ac, e, f Analyzed by simple linear regression and two-tailed correlation analyses. Data represented in g analyzed by the log-rank Mantel-Cox test (two-sided). NLR neutrophil-to-lymphocyte ratio. g Blue = <240-ng/mL LCN2, red = >240-ng/mL LCN2.
Fig. 8
Fig. 8. Graphical summary of findings.
We report that the pathogenesis of pancreatic cancer cachexia is associated with increased circulating levels of LCN2, which is an anorectic molecule that potentiates muscle and fat wasting associated with cachexia.

References

    1. Baracos VE, Martin L, Korc M, Guttridge DC, Fearon KCH. Cancer-associated cachexia. Nat. Rev. Dis. Prim. 2018;4:17105. doi: 10.1038/nrdp.2017.105. - DOI - PubMed
    1. Fearon K, et al. Definition and classification of cancer cachexia: an international consensus. Lancet Oncol. 2011;12:489–495. doi: 10.1016/S1470-2045(10)70218-7. - DOI - PubMed
    1. Mak RH, Cheung W, Cone RD, Marks DL. Mechanisms of disease: cytokine and adipokine signaling in uremic cachexia. Nat. Clin. Pract. Nephrol. 2006;2:527–534. doi: 10.1038/ncpneph0273. - DOI - PubMed
    1. von Haehling S, Anker SD. Prevalence, incidence and clinical impact of cachexia: facts and numbers-update 2014. J. Cachexia Sarcopenia Muscle. 2014;5:261–263. doi: 10.1007/s13539-014-0164-8. - DOI - PMC - PubMed
    1. Bachmann J, et al. Cachexia worsens prognosis in patients with resectable pancreatic cancer. J. Gastrointest. Surg.: Off. J. Soc. Surg. Alimentary Trac. 2008;12:1193–1201. doi: 10.1007/s11605-008-0505-z. - DOI - PubMed

Publication types

MeSH terms