. 2021 Apr 6;12(1):2055.
doi: 10.1038/s41467-021-21856-3.

T cell assays differentiate clinical and subclinical SARS-CoV-2 infections from cross-reactive antiviral responses

Ane Ogbe #  1 Barbara Kronsteiner #  1   2 Donal T Skelly #  1   3   4 Matthew Pace #  1 Anthony Brown #  1 Emily Adland #  1 Kareena Adair  5 Hossain Delowar Akhter  1 Mohammad Ali  1   2 Serat-E Ali  5 Adrienn Angyal  6 M Azim Ansari  1 Carolina V Arancibia-Cárcamo  4   7 Helen Brown  1 Senthil Chinnakannan  1 Christopher Conlon  2   3 Catherine de Lara  1 Thushan de Silva  6 Christina Dold  8   9 Tao Dong  10   11 Timothy Donnison  1 David Eyre  3   12 Amy Flaxman  13 Helen Fletcher  14 Joshua Gardner  5 James T Grist  9   15   16 Carl-Philipp Hackstein  1 Kanoot Jaruthamsophon  5 Katie Jeffery  3 Teresa Lambe  13 Lian Lee  1 Wenqin Li  1 Nicholas Lim  1 Philippa C Matthews  1   3 Alexander J Mentzer  3   17 Shona C Moore  18 Dean J Naisbitt  5 Monday Ogese  5 Graham Ogg  3   9   10 Peter Openshaw  19 Munir Pirmohamed  5 Andrew J Pollard  8   9 Narayan Ramamurthy  1 Patpong Rongkard  1   2   20 Sarah Rowland-Jones  6   21 Oliver Sampson  1 Gavin Screaton  17 Alessandro Sette  22   23 Lizzie Stafford  3 Craig Thompson  24 Paul J Thomson  5 Ryan Thwaites  19 Vinicius Vieira  1   25 Daniela Weiskopf  22   23 Panagiota Zacharopoulou  1 Oxford Immunology Network Covid-19 Response T Cell ConsortiumOxford Protective T Cell Immunology for COVID-19 (OPTIC) Clinical TeamLance Turtle  18   26 Paul Klenerman  27   28   29   30 Philip Goulder  25 John Frater  1   3   9 Eleanor Barnes  1   3   9 Susanna Dunachie  1   2   3   9   20
Collaborators, Affiliations

T cell assays differentiate clinical and subclinical SARS-CoV-2 infections from cross-reactive antiviral responses

Ane Ogbe et al. Nat Commun. .

Abstract

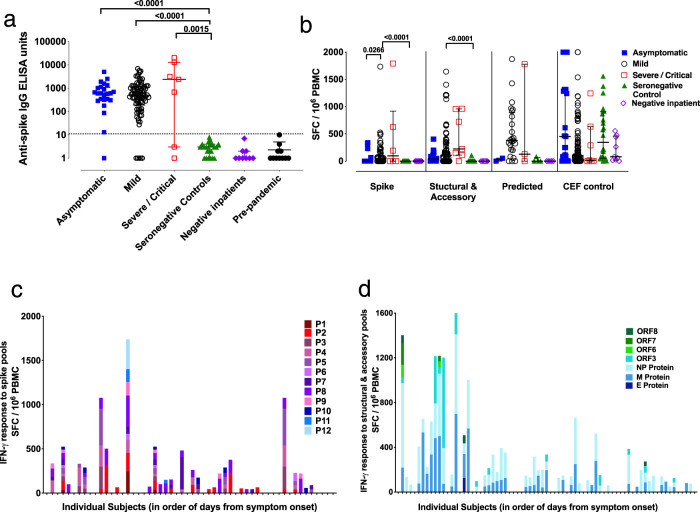
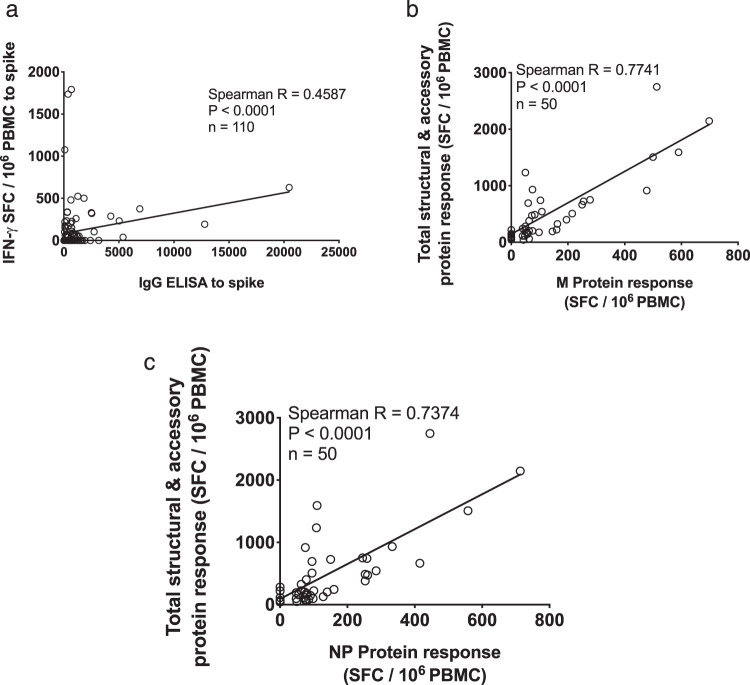
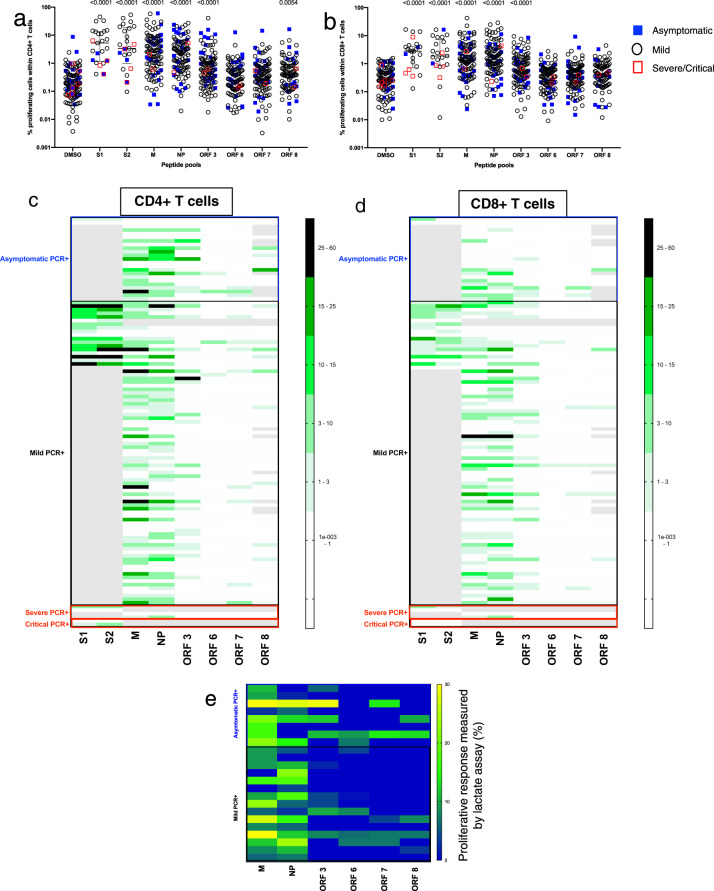
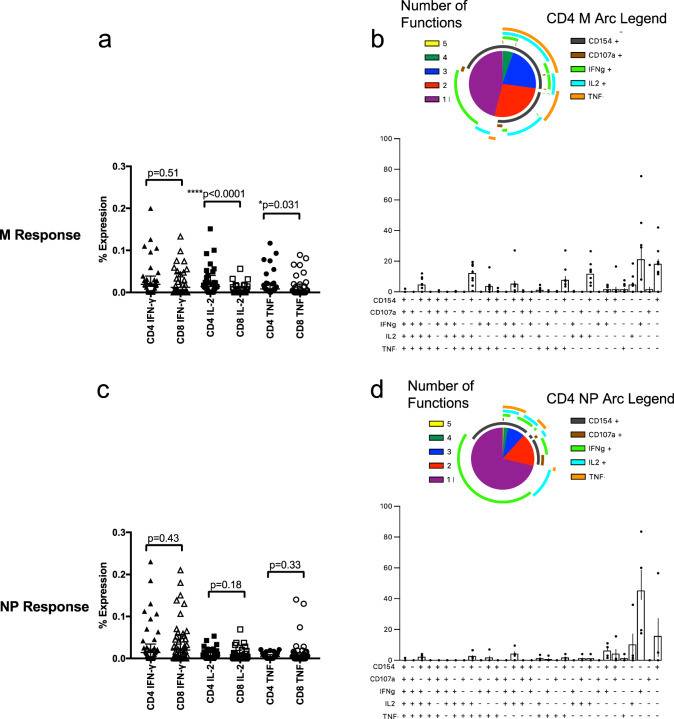
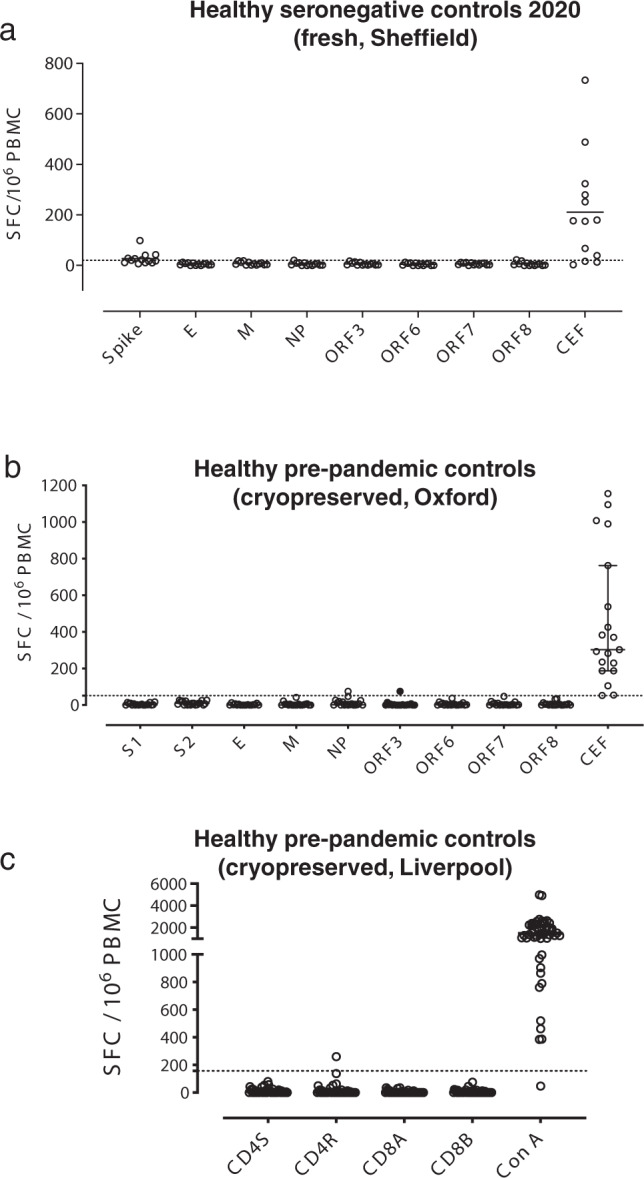
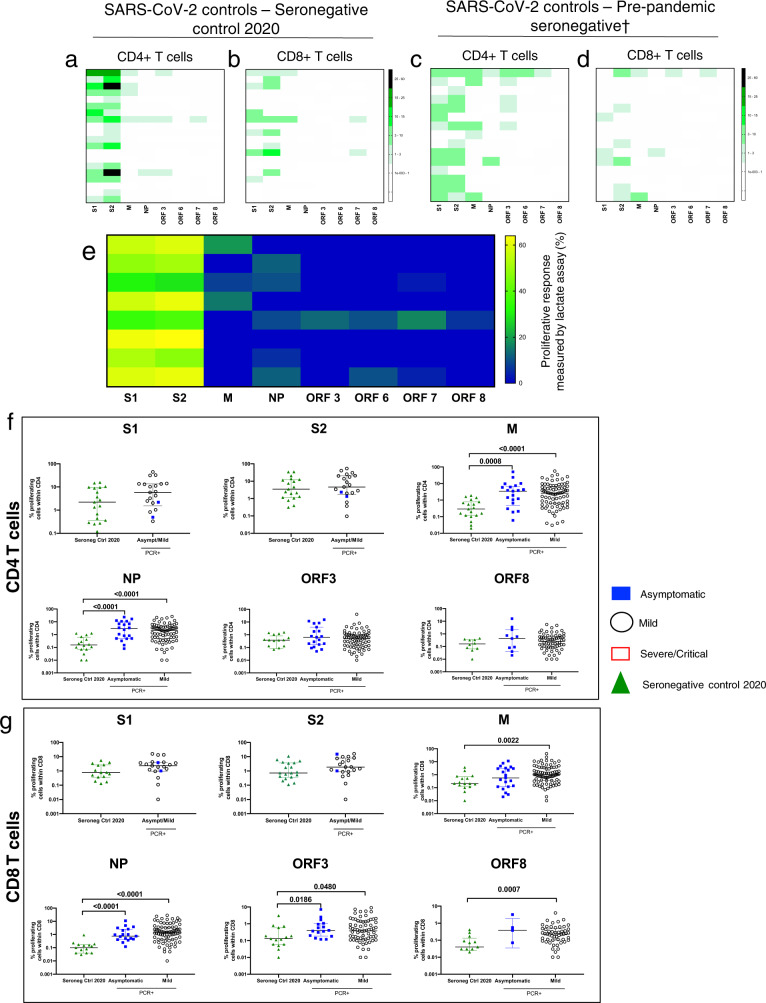
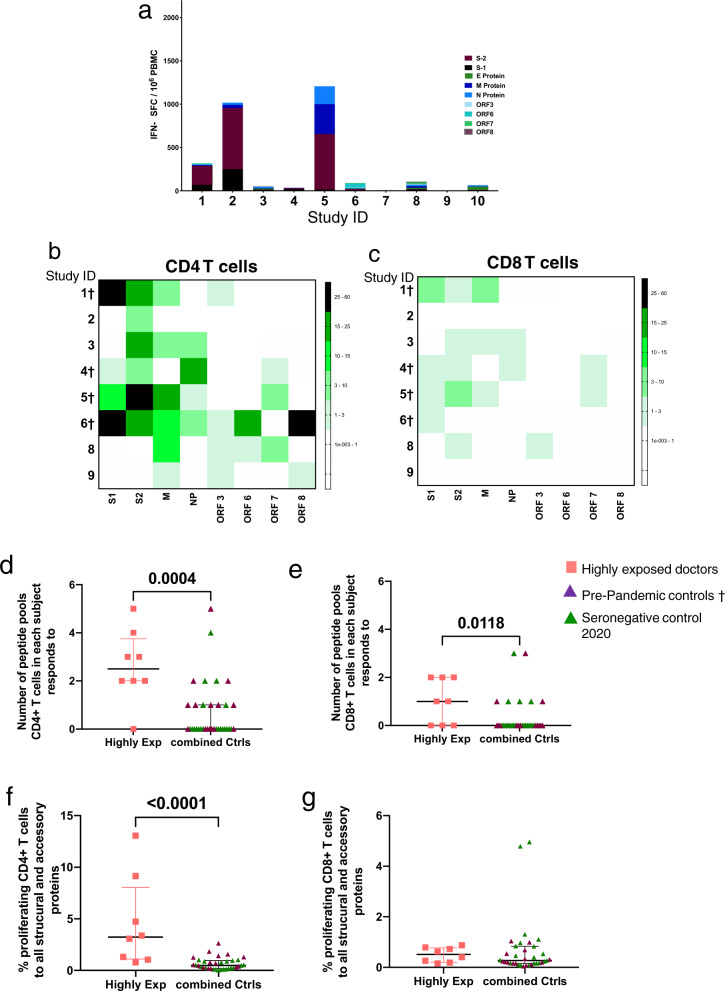
Identification of protective T cell responses against SARS-CoV-2 requires distinguishing people infected with SARS-CoV-2 from those with cross-reactive immunity to other coronaviruses. Here we show a range of T cell assays that differentially capture immune function to characterise SARS-CoV-2 responses. Strong ex vivo ELISpot and proliferation responses to multiple antigens (including M, NP and ORF3) are found in 168 PCR-confirmed SARS-CoV-2 infected volunteers, but are rare in 119 uninfected volunteers. Highly exposed seronegative healthcare workers with recent COVID-19-compatible illness show T cell response patterns characteristic of infection. By contrast, >90% of convalescent or unexposed people show proliferation and cellular lactate responses to spike subunits S1/S2, indicating pre-existing cross-reactive T cell populations. The detection of T cell responses to SARS-CoV-2 is therefore critically dependent on assay and antigen selection. Memory responses to specific non-spike proteins provide a method to distinguish recent infection from pre-existing immunity in exposed populations.


Conflict of interest statement

D.W.E. declares lecture fees from Gilead. A.S. is listed as an inventor on patent application no. 63/012,902, submitted by La Jolla Institute for Immunology, covers the use of the megapools and peptides thereof for therapeutic and diagnostic purposes. A.S. is a consultant for Gritstone and Flow Pharma and Avalia. The remaining authors declare no competing interests.

Figures

Fig. 1
Fig. 1. Magnitude and breadth of SARS-CoV-2-specific immune response.
a Total anti-SARS-CoV-2 spike IgG antibody titres by indirect ELISA in 22 seronegative controls, 24 asymptomatic and 82 mildly symptomatic healthcare workers (HCWs) with PCR-confirmed SARS-CoV-2 infection, 7 hospitalised patients with severe or critical PCR-confirmed SARS-CoV-2 infection, 9 PCR-negative inpatient controls, and 11 pre-pandemic controls. b Ex vivo IFN-γ ELISpot showing the effector T cell responses to summed SARS-CoV-2 peptide pools spanning spike, accessory and structural proteins (E, M, NP, ORF 3, ORF6, ORF7 and ORF8), in silico-predicted pools and the CEF T cell control panel in cohort groups as in a. c Ex vivo IFN-γ ELISpot showing the magnitude and breadth of effector T cell responses in 54 individual volunteers to 12 SARS-CoV-2 spike peptide pools (numbered P1 to P12) and d M, NP and accessory proteins ORF 3, ORF6, ORF7 and ORF8 in 73 HCWs convalescent with mildly symptomatic SARS-CoV-2 infection. X axis shows number of days from onset of symptoms (not to scale), with blank columns representing zero response in the individual tested at that time-point. SFC/106 PBMC = spot-forming cells per million peripheral blood mononuclear cells, with background subtracted. Plots show median with error bars indicating ± IQR. Kruskal–Wallis one-way ANOVA, with Dunn’s multiple comparisons test, was performed. Two-tailed P-values < 0.05 are shown on plots with Supplementary Table 3 showing full Kruskal–Wallis one-way ANOVA, with Dunn’s multiple comparisons test for b. Source data are available in the source data file.
Fig. 2
Fig. 2. Correlation between antibody and total summed ex vivo ELISpot responses.
a Correlation between IgG ELISA to spike and ex vivo IFN-γ ELISpot summed response to spike (n = 110), the correlation between ex vivo IFN-γ ELISpot response to b M protein and c NP and total summed response to spike, E, M, N, ORF 3, ORF6, ORF7 and ORF8 (n = 50), SFC/106 PBMC = spot-forming cells per million peripheral blood mononuclear cells, with background subtracted. The correlation was performed via Spearman’s rank correlation coefficient and comparison of two groups by two-tailed Mann–Whitney U test.
Fig. 3
Fig. 3. Proliferative responses in CD4+ and CD8+ T cells to key SARS-CoV-2 proteins.
Plot showing raw frequency (without background subtraction) of proliferating cells in response to peptide pool stimulation in 113 volunteers in a CD4+ and b CD8+ T cells to DMSO (media), and overlapping peptide pools spanning S1, S2, M, NP, ORF 3, ORF6, ORF7 and ORF8. c Heatmap showing the magnitude of proliferative responses to overlapping peptide pools spanning SARS-CoV-2 proteome in CD4+ T cells and d CD8+ T cells following background subtraction. Scales on the heatmap represent the magnitude of proliferating cells. Only data points >1% corresponding to mean + 2× SD in DMSO only well for both CD4+ and CD8+ T cells are shown. The grey box indicates absent data where tests were not run due to sample or peptide availability. e Cellular lactate proliferative response in convalescent mild and asymptomatic HCWs (n = 23 asymptomatic and mild symptoms) at day 4 revealed a variable response to M, NP, ORF 3, 6, 7 and 8. Heatmaps show background-subtracted responses. Each data point represents a single volunteer and plots show median with error bars indicating ± IQR. Where indicated, ns not significant, * = <0.05, ** = <0.01, *** = <0.001 and **** = <0.0001 by Kruskal–Wallis one-way ANOVA, with Dunn’s multiple comparisons test for shown in Supplementary Tables 4 and 5. Number of volunteers for ad: asymptomatic = 23, mild = 84, severe = 4, critical = 2.
Fig. 4
Fig. 4. ICS responses in CD4+ and CD8+ T cells for M and NP pools in ELISpot positive individuals.
ICS was performed on individuals with convalescent mild cases and a positive ELISpot for the indicated peptides. PBMC were stimulated with 2 μg/ml peptide for 6 h. Expression levels of IFN-γ, IL-2 and TNF in CD4+ and CD8+ T cells using M pools are shown in a, n = 31. Bars represent median ± IQR. Statistics were performed using a two-tailed Wilcoxon matched-pairs signed-rank test between each cytokine in CD4+ vs CD8+ T cells. Boolean gates were then set and cytokine expression was examined in CD4+ T cells (n = 9) using SPICE (b). Error bars represent SEM for cytokine expression figures. Expression levels of cytokines using NP pools are shown in c (n = 41) with polyfunctionality analysis for CD4+ T cells (d) (n = 4) as above.
Fig. 5
Fig. 5. Ex vivo ELISpot responses in seronegative controls.
Ex vivo IFN-γ ELISpot responses to summed SARS-CoV-2 peptide pools spanning spike, accessory and structural proteins (E, M, NP, ORF 3, ORF6, ORF7 and ORF8) and CEF T cell control panel in a freshly isolated peripheral blood mononuclear cells (PBMC) from seronegative controls in Sheffield, UK (n = 13), and b cryopreserved PBMC from pre-pandemic healthy controls in Oxford, UK (n = 19). c Ex vivo IFN-γ ELISpot responses to in silico-predicted epitope pools cryopreserved PBMC from pre-pandemic healthy controls in Liverpool, UK (n = 48). Responses are shown with background subtracted, a line represents mean +2 stand deviations of responses to the background.
Fig. 6
Fig. 6. Cross-reactive T cell response in seronegative controls from 2020 and pre-COVID19 pandemic.
a Heatmaps showing CD4+ and b CD8+ T cell proliferative responses in fresh PBMCs from healthy seronegative controls (n = 20). c heatmaps showing the magnitude of cross-reactive responses in CD4+ and d CD8+ T cell response in cryopreserved samples obtained pre-COVID19 pandemic (n = 15). Only data points >1% corresponding to mean + 2× SD in DMSO only well for both CD4+ and CD8+ T cells are shown in heatmaps. e Heatmap measuring the lactate proliferative response in both healthy seronegative controls at day 4 revealed a strong response to spike (all S1 and S2 values divided by 2 for ease of viewing) as well a small, variable, response to SARS-CoV-2 peptide pools. f comparative analysis of peptide pool-specific proliferative response to SARS-CoV-2 proteins in CD4+ and g CD8+ T cells in SARS-CoV-2 seronegative controls during COVID pandemic and PCR+ volunteers. All data plotted are background subtracted (number of volunteers: seronegative control 2020 = 20, pre-pandemic seronegative = 15). For statistical comparison, all data points have been included for all groups. Each data point represents a single volunteer and plots show median with error bars indicating ± IQR. Comparison of two groups was done by two-tailed Mann–Whitney U test.
Fig. 7
Fig. 7. T cell response in highly exposed seronegative controls.
a Ex vivo IFN-γ ELISpot responses to summed SARS-CoV-2 peptide pools spanning spike, accessory and structural proteins (E, M, NP, ORF 3, ORF6, ORF7 and ORF8) in highly exposed HCWs working in acute medical care who experienced a COVID-19-compatible illness without PCR testing and were subsequently seronegative. Responses are shown with background subtracted, n = 10. b Heatmaps showing CD4+ and c CD8+ T cell proliferative responses in the same population of highly exposed HCWs. All data plotted are background subtracted, n = 8 (cells unavailable for 2). d Breadth of responses to structural and accessory proteins from SARS-COV-2 in CD4+ and e CD8+ proliferating T cells. f Magnitude of responding CD4+ and g CD8+ T cells to structural and accessory proteins from SARS-CoV-2 (M, NP, ORF3, 6, 7, 8). Each data point represents a single volunteer and plots show median with error bars indicating ± IQR. Comparison of two groups was done by two-tailed Mann–Whitney U test. Study ID with † was assessed from cryopreserved samples. Proliferation assay for individuals 7 and 10 was not performed. N = 35 for combined control.

References

    1. Gorbalenya AE, et al. Coronaviridae Study Group of the International Committee on Taxonomy of Viruses. The species Severe acute respiratory syndrome-related coronavirus: classifying 2019-nCoV and naming it SARS-CoV-2. Nat. Microbiol. 2020;5:536–544. doi: 10.1038/s41564-020-0695-z. - DOI - PMC - PubMed
    1. Lu R, et al. Genomic characterisation and epidemiology of 2019 novel coronavirus: implications for virus origins and receptor binding. Lancet. 2020;395:565–574. doi: 10.1016/S0140-6736(20)30251-8. - DOI - PMC - PubMed
    1. Guan WJ, et al. China Medical Treatment Expert Group for Covid. Clinical characteristics of coronavirus disease 2019 in China. N. Engl. J. Med. 2020;382:1708–1720. doi: 10.1056/NEJMoa2002032. - DOI - PMC - PubMed
    1. Wu Z, McGoogan JM. Characteristics of and important lessons from the coronavirus disease 2019 (COVID-19) outbreak in China: summary of a report of 72314 cases from the chinese center for disease control and prevention. JAMA. 2020;323:1239–1242. doi: 10.1001/jama.2020.2648. - DOI - PubMed
    1. Docherty AB, et al. Features of 20133 UK patients in hospital with covid-19 using the ISARIC WHO clinical characterisation protocol: prospective observational cohort study. BMJ. 2020;369:m1985. doi: 10.1136/bmj.m1985. - DOI - PMC - PubMed

Publication types

MeSH terms